| Param | Original file | Final file |
|---|---|---|
| Filename | modeM0/AS1A09_145T01_9000003900_26995cztM0_level2.evt | modeM0/AS1A09_145T01_9000003900_26995cztM0_level2_quad_clean.evt |
| Size (bytes) | 628,868,160 | 115,750,080 |
| Size | 599.7 MB | 110.4 MB |
| Events in quadrant A | 6,179,803 | 752,956 |
| Events in quadrant B | 3,605,367 | 818,610 |
| Events in quadrant C | 3,444,059 | 781,166 |
| Events in quadrant D | 5,406,109 | 729,011 |
| Mode M0 | |||
|---|---|---|---|
| Quadrant | BADHDUFLAG | Total packets | Discarded packets |
| A | 0 | 22708 | 0 |
| B | 0 | 14716 | 0 |
| C | 0 | 14139 | 0 |
| D | 0 | 20109 | 0 |
| Mode M9 | |||
|---|---|---|---|
| Quadrant | BADHDUFLAG | Total packets | Discarded packets |
| A | 0 | 13 | 0 |
| B | 0 | 13 | 0 |
| C | 0 | 13 | 0 |
| D | 0 | 13 | 0 |
| Quadrant | Total seconds | Saturated seconds | Saturation percentage |
|---|---|---|---|
| A | 6068 | 650 | 10.711931% |
| B | 6068 | 100 | 1.647989% |
| C | 6068 | 111 | 1.829268% |
| D | 6068 | 498 | 8.206987% |
Noise dominated data is calculated using 1-second bins in cleaned event files. If a bin has >2000 counts, and if more than 50% of those come from <1% of pixels, then it is considered to be noise-dominated and hence unusable.
| Quadrant | # 1 sec bins | Bins with >0 counts | Bins with >2000 counts | High rate bins dominated by noise | Noise dominated (total time) | Noise dominated (detector-on time) | Marked lightcurve |
|---|---|---|---|---|---|---|---|
| A | 7418 | 6068 | 491 | 491 | 6.62% | 8.09% | 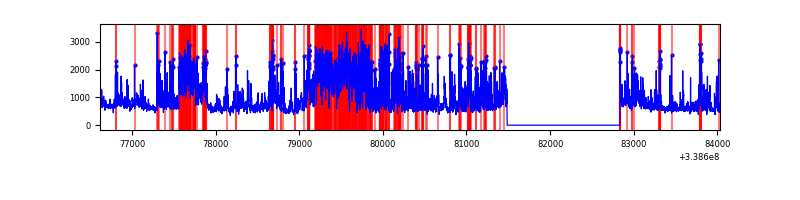 |
| B | 7418 | 6068 | 35 | 35 | 0.47% | 0.58% | 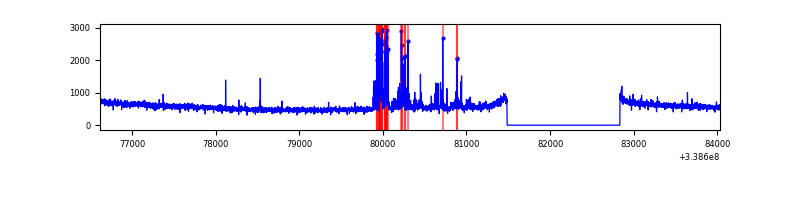 |
| C | 7418 | 6068 | 5 | 5 | 0.07% | 0.08% | 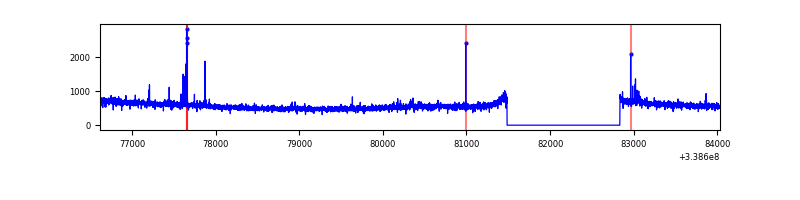 |
| D | 7418 | 6068 | 391 | 391 | 5.27% | 6.44% | 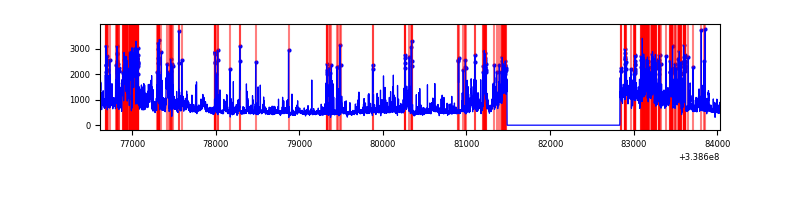 |
Top three noisy pixels from each quadrant. If the there are fewer than three noisy pixels in the level2.evt file, extra rows are filled as -1
| Pixel properties | Quadrant properties | ||||||
|---|---|---|---|---|---|---|---|
| Quadrant | DetID | PixID | Counts | Sigma | Mean | Median | Sigma |
| A | 14 | 235 | 1697654 | 10264.83 | 820 | 810 | 165.3 |
| A | 6 | 16 | 1307666 | 7905.65 | 820 | 810 | 165.3 |
| A | 8 | 192 | 15362 | 88.03 | 820 | 810 | 165.3 |
| B | 10 | 245 | 262306 | 1630.21 | 854 | 837 | 160.4 |
| B | 12 | 111 | 17978 | 106.87 | 854 | 837 | 160.4 |
| B | 11 | 111 | 16068 | 94.96 | 854 | 837 | 160.4 |
| C | 14 | 238 | 133683 | 676.47 | 830 | 842 | 196.4 |
| C | 15 | 208 | 43619 | 217.84 | 830 | 842 | 196.4 |
| C | 8 | 128 | 12682 | 60.29 | 830 | 842 | 196.4 |
| D | 1 | 52 | 1334032 | 6987.76 | 798 | 782 | 190.8 |
| D | 5 | 222 | 671575 | 3515.72 | 798 | 782 | 190.8 |
| D | 2 | 250 | 175085 | 913.55 | 798 | 782 | 190.8 |
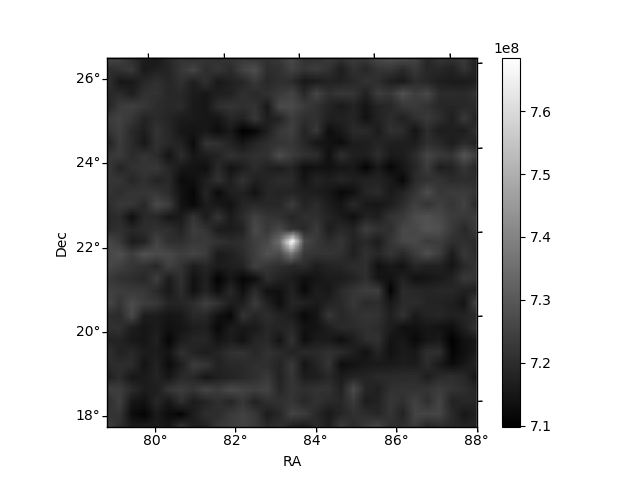
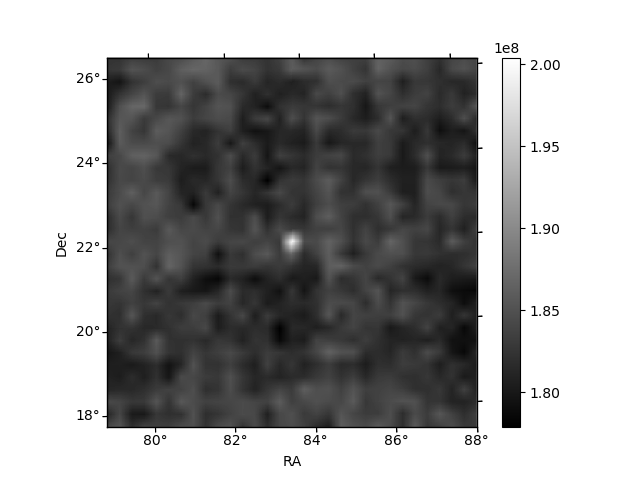
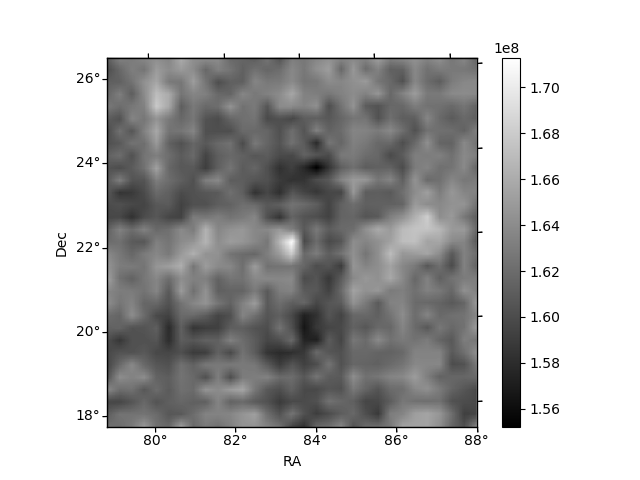
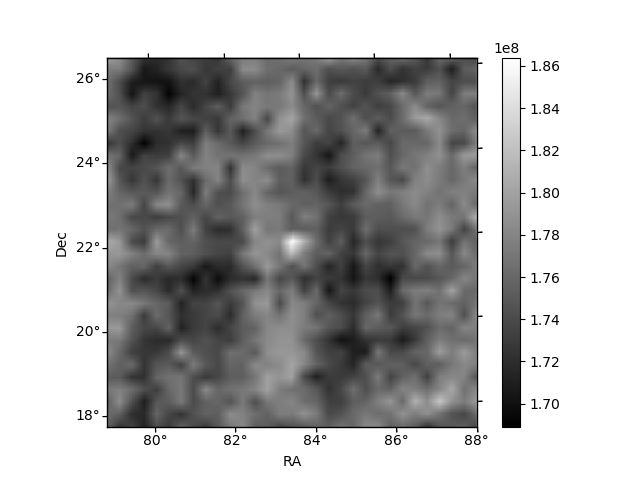
Histogram calculated using DETX and DETY for each event in the final _common_clean file
| Quadrant A | 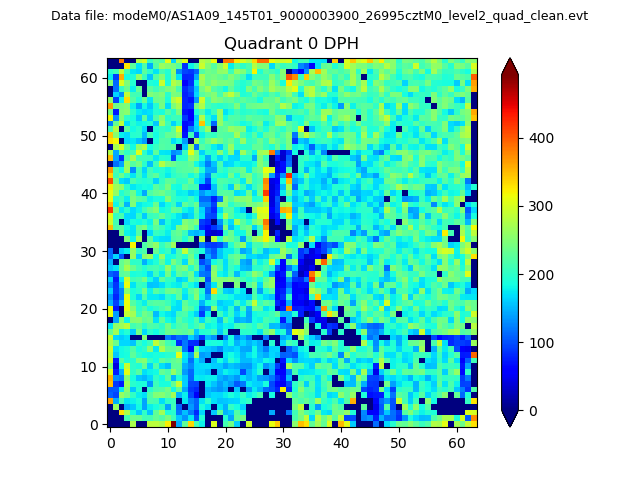 |
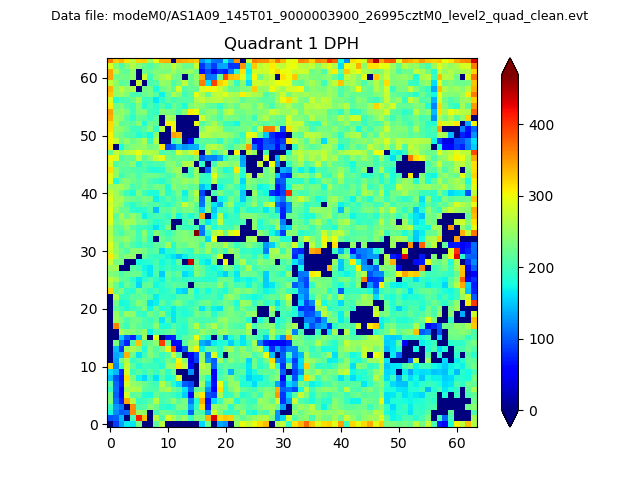 |
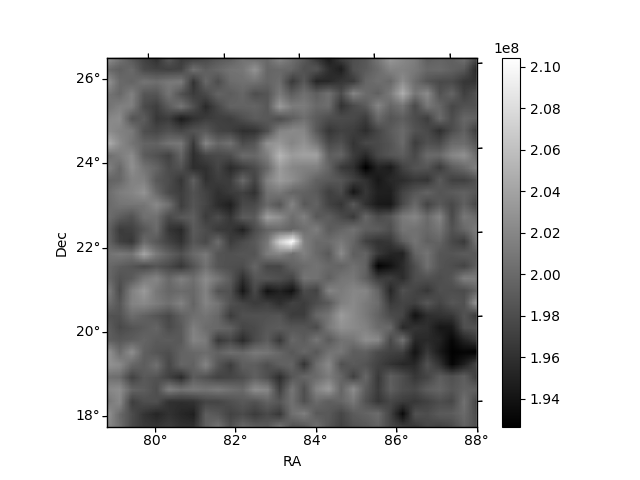
Quadrant B |
|---|---|---|---|
| Quadrant D | 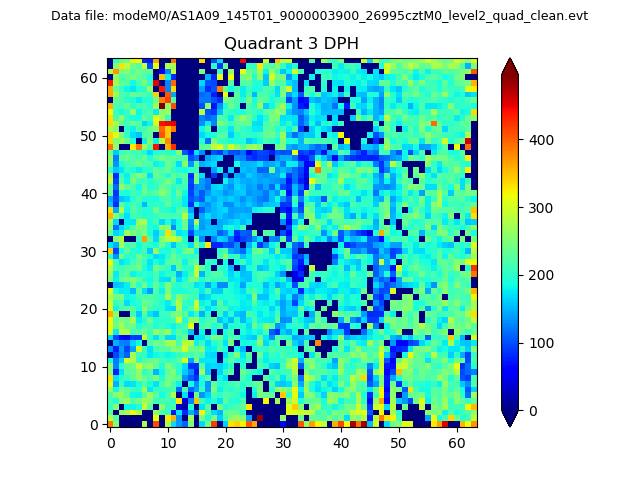 |
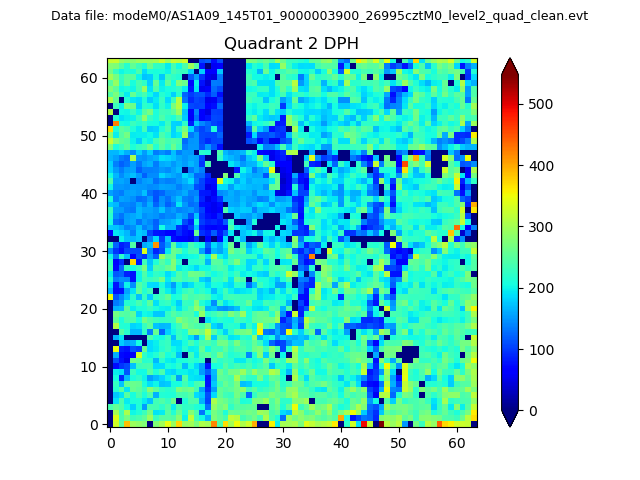 |
Quadrant C |
| Plot type | Count rate plots | Images |
|---|---|---|
| Comparison with Poisson distribution Blue bars denote a histogram of data divided into 1 sec bins. Red curve is a Poisson curve with rate = median count rate of data. |
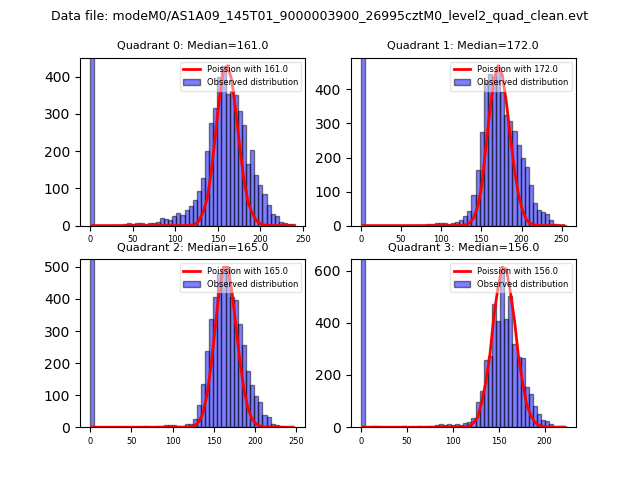 |
 |
| Quadrant-wise count rates Data is divided into 100 sec bins |
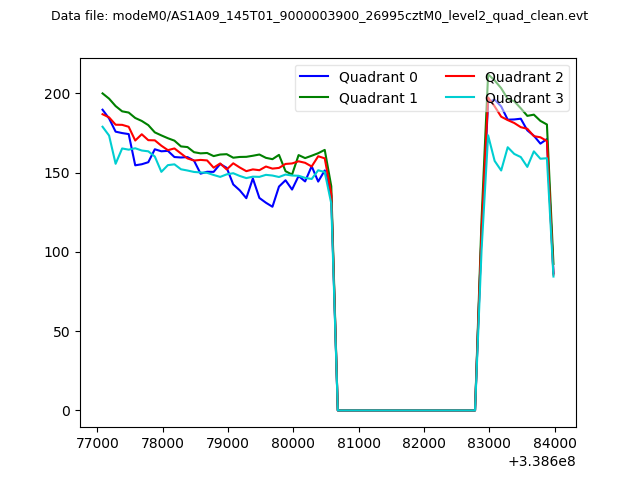 |
|
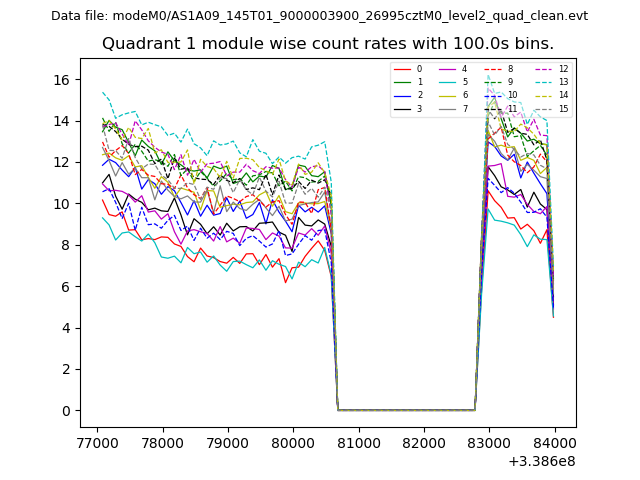
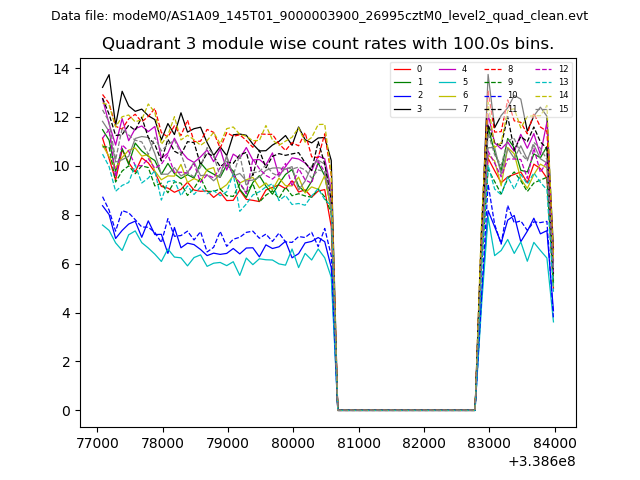
| Module-wise count rates for Quadrant A Data is divided into 100 sec bins |
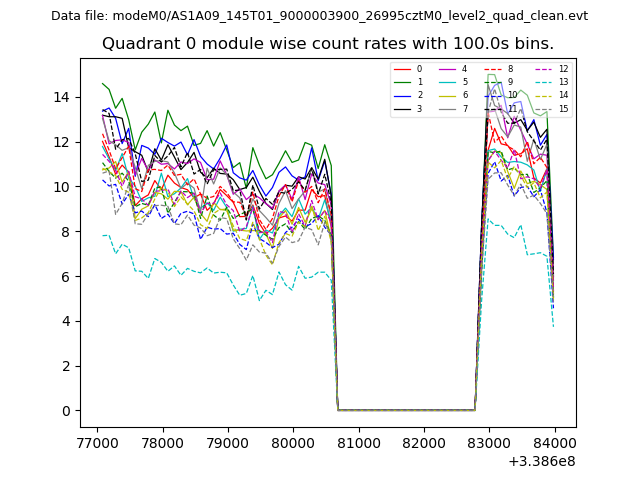 |
 |
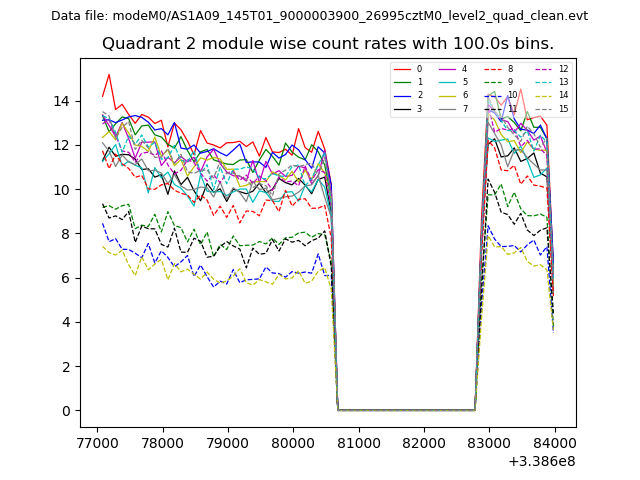
| Module-wise count rates for Quadrant B Data is divided into 100 sec bins |
 |
 |
| Module-wise count rates for Quadrant C Data is divided into 100 sec bins |
 |
 |
| Module-wise count rates for Quadrant D Data is divided into 100 sec bins |
 |
 |
| Parameter | Plot |
|---|---|
| CZT HV Monitor | 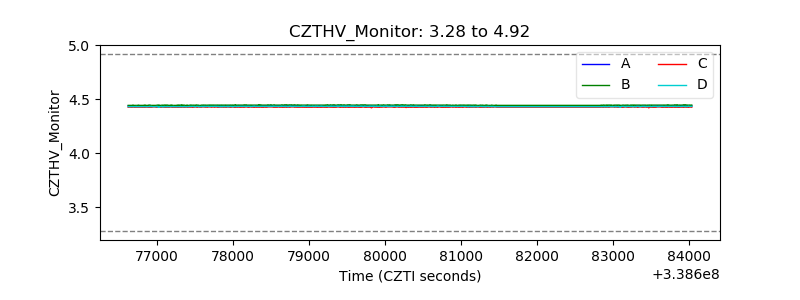 |
| D_VDD | 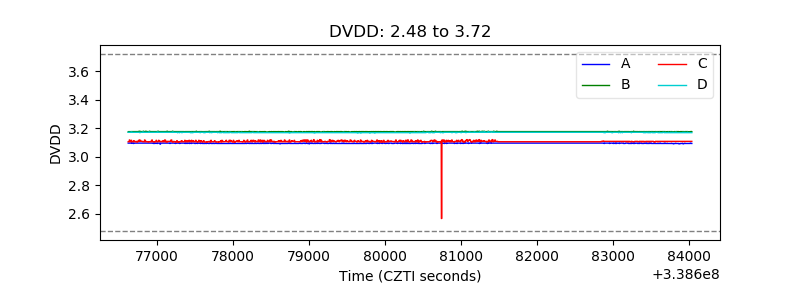 |
| Temperature 1 | 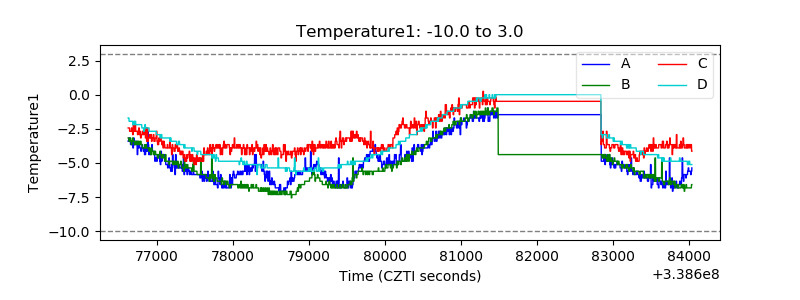 |
| Veto HV Monitor | 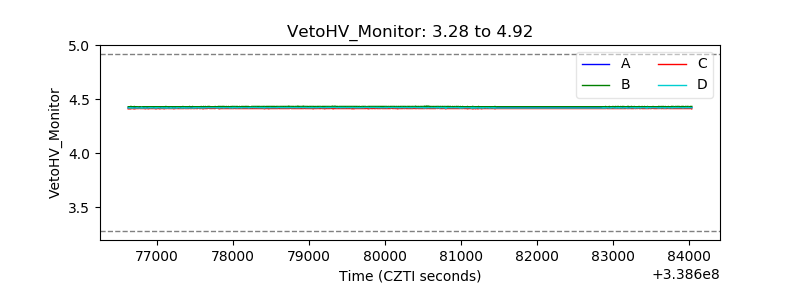 |
| Veto LLD | 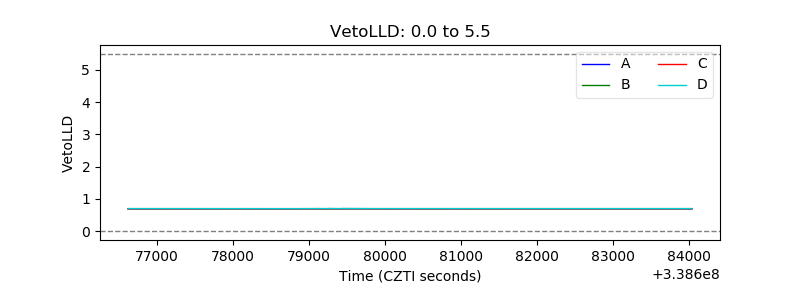 |
| Alpha Counter | 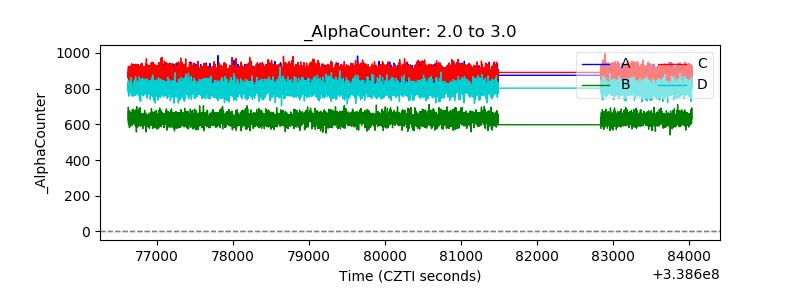 |
| _CPM_Rate | 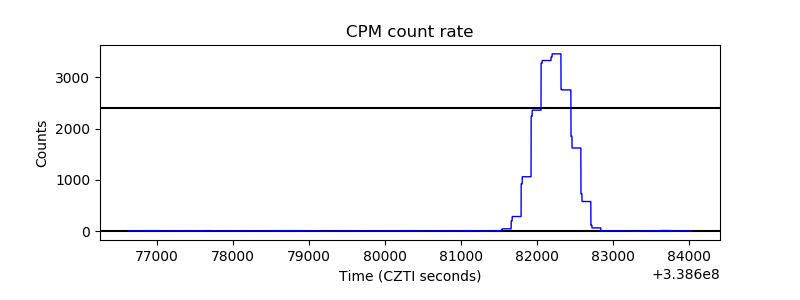 |
| CZT Counter | 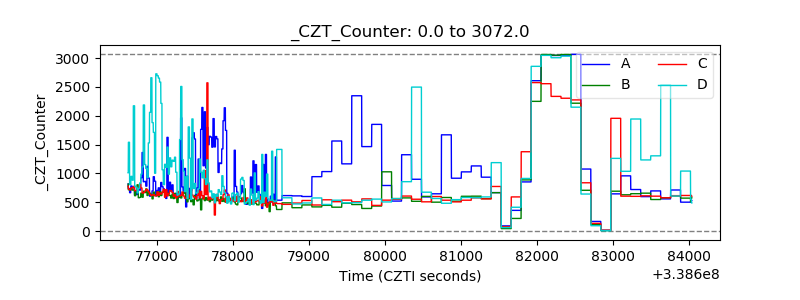 |
| +2.5 Volts monitor | 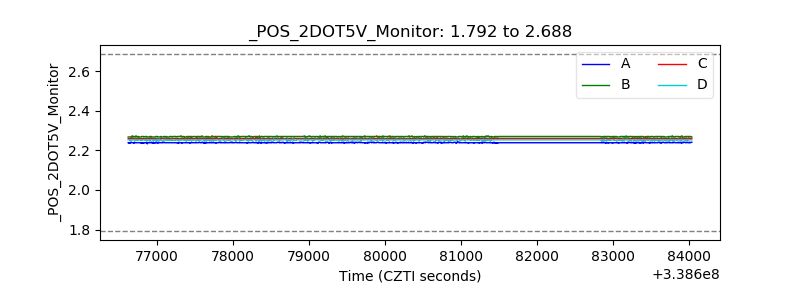 |
| +5 Volts monitor | 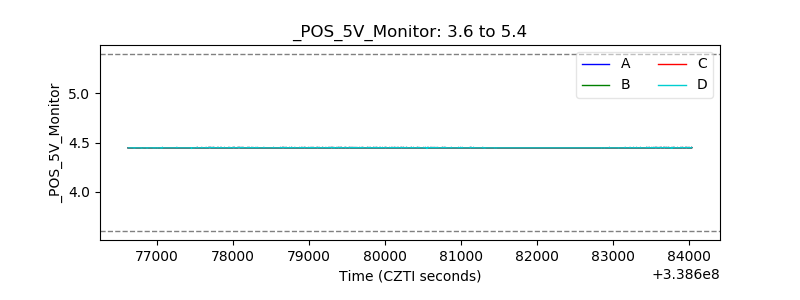 |
| _ROLL_ROT | 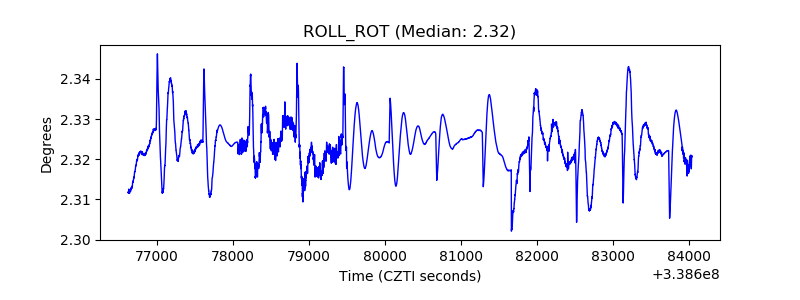 |
| _Roll_DEC | 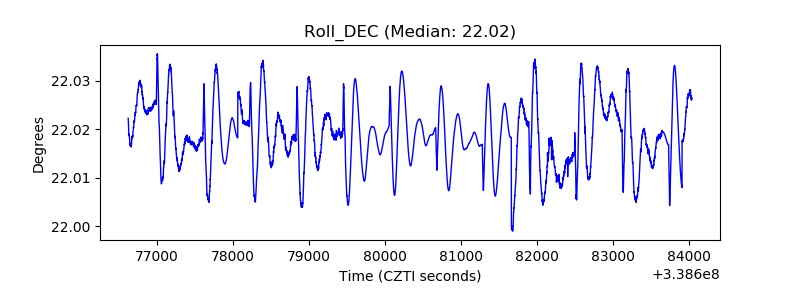 |
| _Roll_RA | 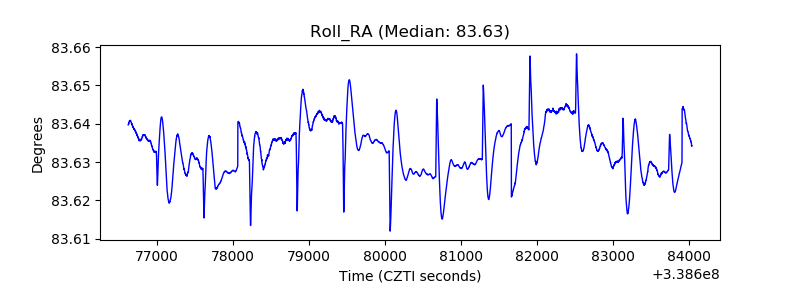 |
| Veto Counter | 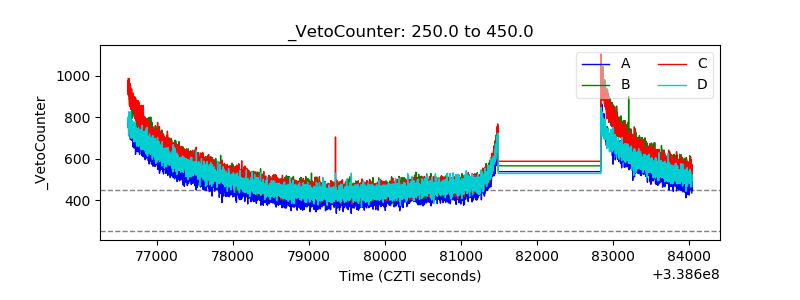 |