| Param | Original file | Final file |
|---|---|---|
| Filename | modeM0/AS1A09_145T01_9000003900_26996cztM0_level2.evt | modeM0/AS1A09_145T01_9000003900_26996cztM0_level2_quad_clean.evt |
| Size (bytes) | 598,296,960 | 115,269,120 |
| Size | 570.6 MB | 109.9 MB |
| Events in quadrant A | 4,342,352 | 780,301 |
| Events in quadrant B | 3,180,026 | 826,287 |
| Events in quadrant C | 3,193,732 | 782,322 |
| Events in quadrant D | 7,003,872 | 689,300 |
| Mode M0 | |||
|---|---|---|---|
| Quadrant | BADHDUFLAG | Total packets | Discarded packets |
| A | 0 | 16801 | 0 |
| B | 0 | 13026 | 0 |
| C | 0 | 13047 | 0 |
| D | 0 | 24834 | 0 |
| Mode M9 | |||
|---|---|---|---|
| Quadrant | BADHDUFLAG | Total packets | Discarded packets |
| A | 0 | 13 | 0 |
| B | 0 | 13 | 0 |
| C | 0 | 13 | 0 |
| D | 0 | 13 | 0 |
| Quadrant | Total seconds | Saturated seconds | Saturation percentage |
|---|---|---|---|
| A | 5900 | 268 | 4.542373% |
| B | 5901 | 30 | 0.508388% |
| C | 5900 | 70 | 1.186441% |
| D | 5900 | 1088 | 18.440678% |
Noise dominated data is calculated using 1-second bins in cleaned event files. If a bin has >2000 counts, and if more than 50% of those come from <1% of pixels, then it is considered to be noise-dominated and hence unusable.
| Quadrant | # 1 sec bins | Bins with >0 counts | Bins with >2000 counts | High rate bins dominated by noise | Noise dominated (total time) | Noise dominated (detector-on time) | Marked lightcurve |
|---|---|---|---|---|---|---|---|
| A | 7295 | 5901 | 234 | 234 | 3.21% | 3.97% | 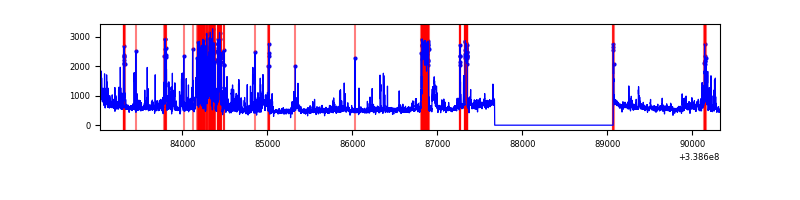 |
| B | 7296 | 5902 | 1 | 1 | 0.01% | 0.02% | 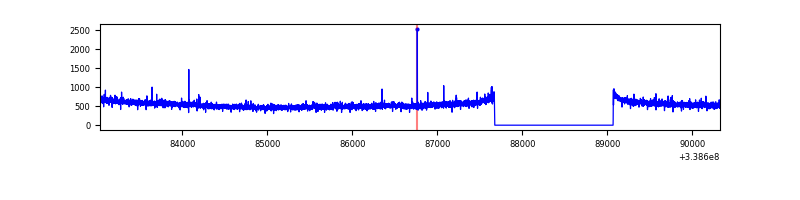 |
| C | 7295 | 5901 | 2 | 2 | 0.03% | 0.03% | 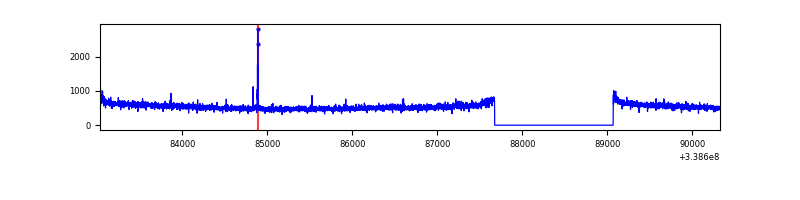 |
| D | 7295 | 5901 | 1056 | 1056 | 14.48% | 17.90% | 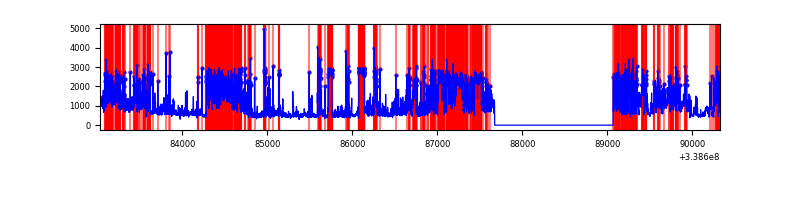 |
Top three noisy pixels from each quadrant. If the there are fewer than three noisy pixels in the level2.evt file, extra rows are filled as -1
| Pixel properties | Quadrant properties | ||||||
|---|---|---|---|---|---|---|---|
| Quadrant | DetID | PixID | Counts | Sigma | Mean | Median | Sigma |
| A | 14 | 235 | 919398 | 5826.93 | 781 | 770 | 157.7 |
| A | 6 | 16 | 397981 | 2519.54 | 781 | 770 | 157.7 |
| A | 8 | 192 | 13812 | 82.73 | 781 | 770 | 157.7 |
| B | 12 | 111 | 17106 | 107.73 | 806 | 791 | 151.4 |
| B | 3 | 112 | 16773 | 105.53 | 806 | 791 | 151.4 |
| B | 11 | 111 | 15259 | 95.53 | 806 | 791 | 151.4 |
| C | 14 | 238 | 127072 | 693.74 | 777 | 788 | 182.0 |
| C | 15 | 208 | 29187 | 156.01 | 777 | 788 | 182.0 |
| C | 5 | 218 | 7212 | 35.29 | 777 | 788 | 182.0 |
| D | 1 | 52 | 2562923 | 15121.11 | 707 | 690 | 169.4 |
| D | 5 | 222 | 1224406 | 7221.81 | 707 | 690 | 169.4 |
| D | 12 | 233 | 178900 | 1051.71 | 707 | 690 | 169.4 |
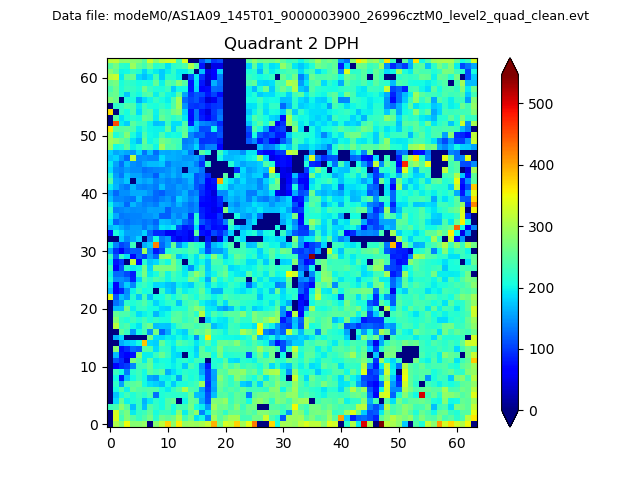
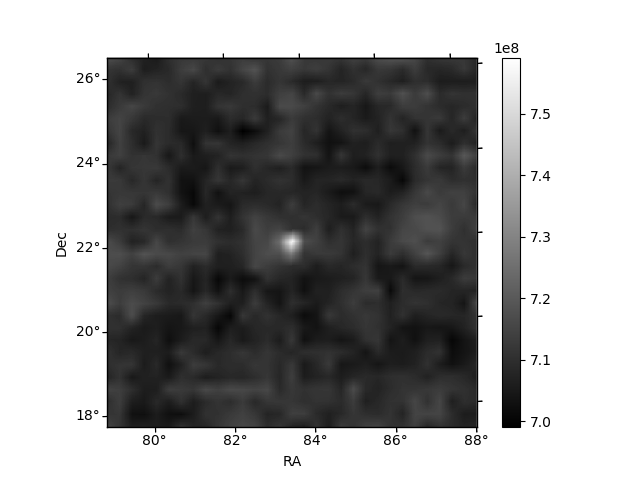
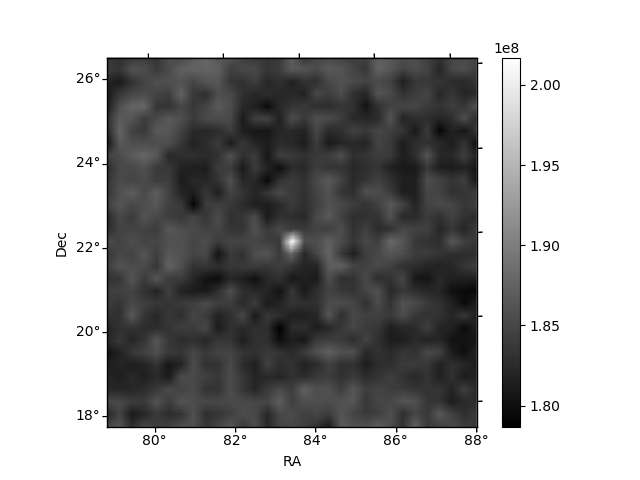
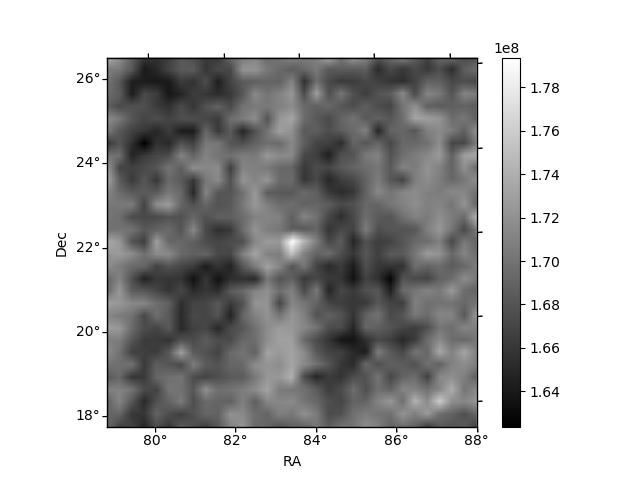
Histogram calculated using DETX and DETY for each event in the final _common_clean file
| Quadrant A | 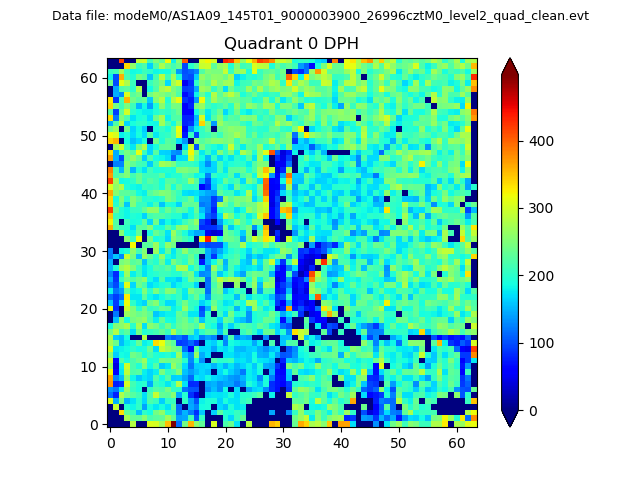 |
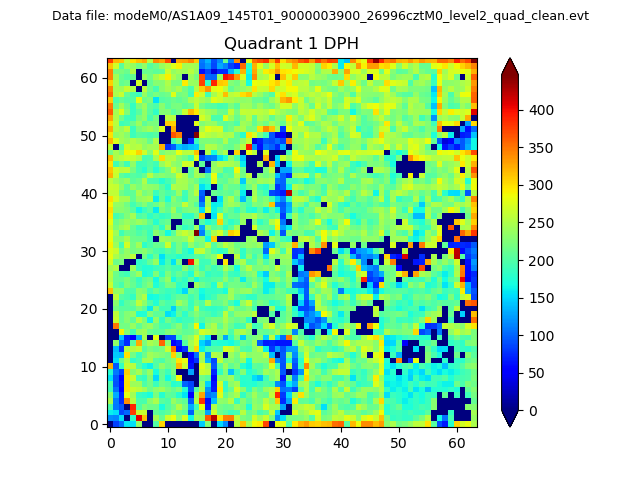 |
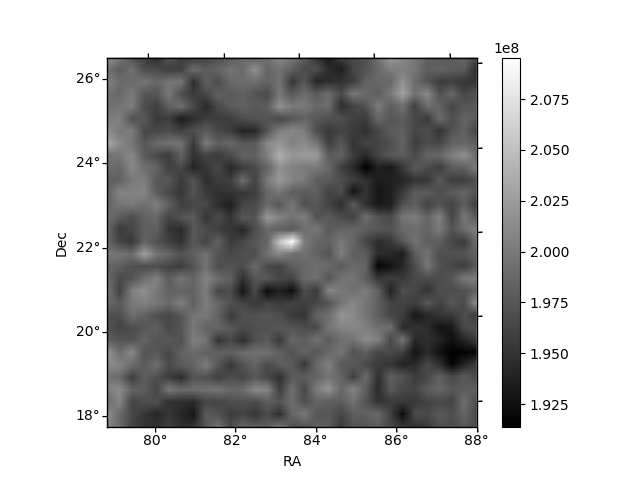
Quadrant B |
|---|---|---|---|
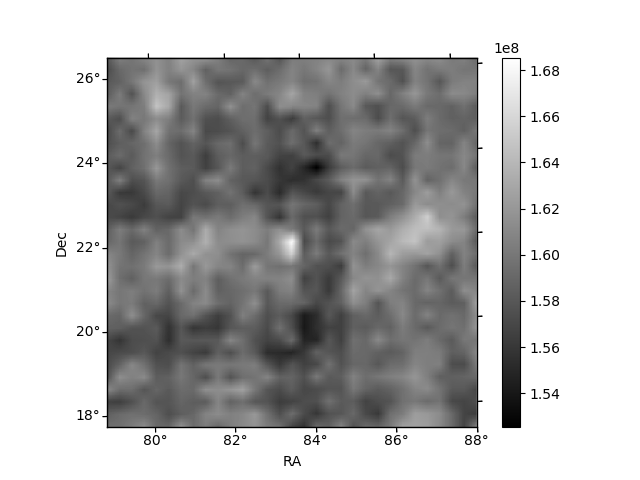
| Quadrant D | 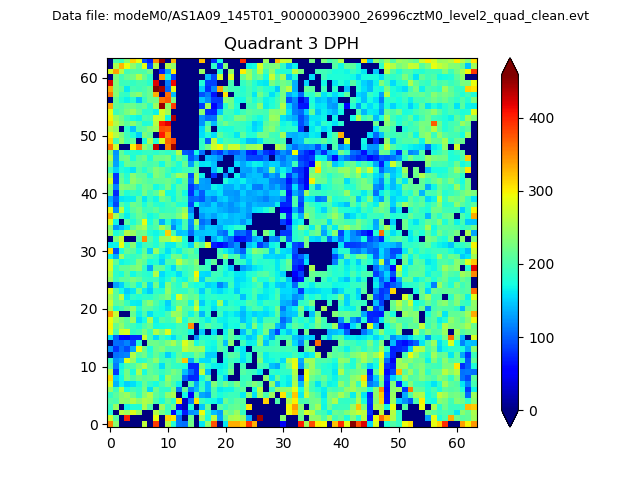 |
 |
Quadrant C |
| Plot type | Count rate plots | Images |
|---|---|---|
| Comparison with Poisson distribution Blue bars denote a histogram of data divided into 1 sec bins. Red curve is a Poisson curve with rate = median count rate of data. |
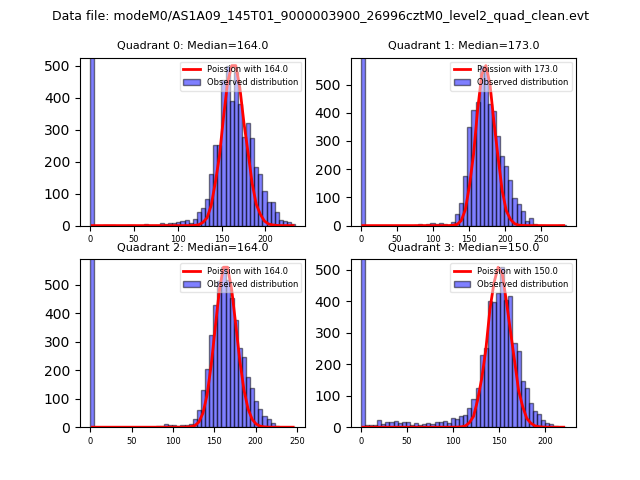 |
 |
| Quadrant-wise count rates Data is divided into 100 sec bins |
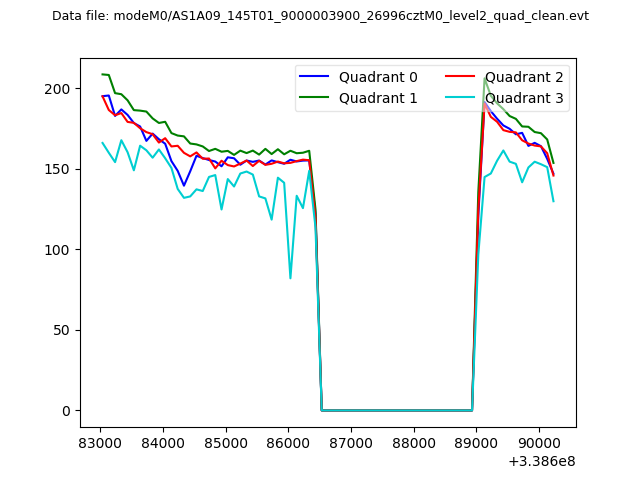 |
|
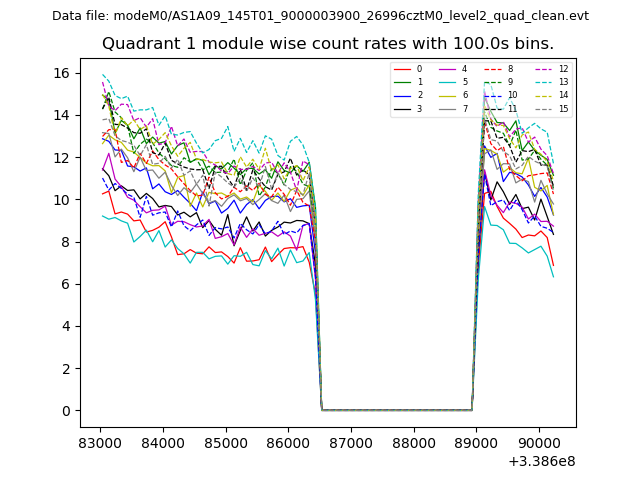
| Module-wise count rates for Quadrant A Data is divided into 100 sec bins |
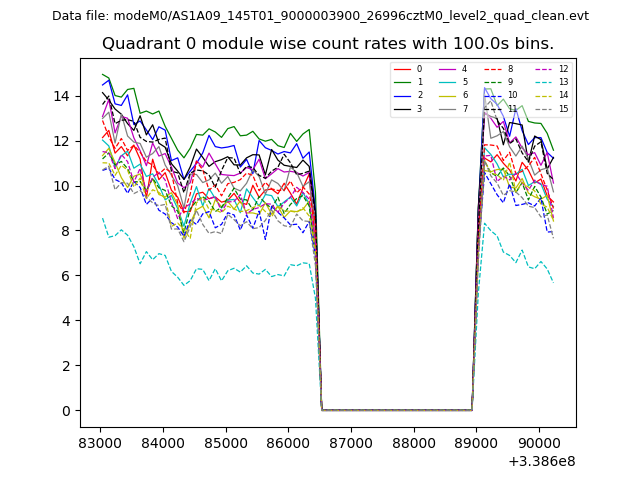 |
 |
| Module-wise count rates for Quadrant B Data is divided into 100 sec bins |
 |
 |
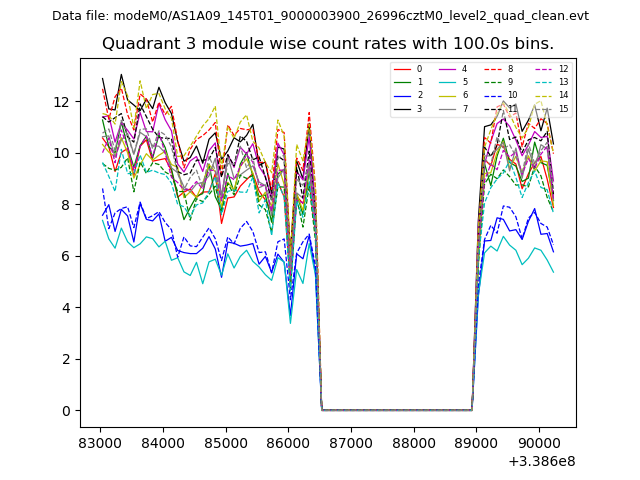
| Module-wise count rates for Quadrant C Data is divided into 100 sec bins |
 |
 |
| Module-wise count rates for Quadrant D Data is divided into 100 sec bins |
 |
 |
| Parameter | Plot |
|---|---|
| CZT HV Monitor | 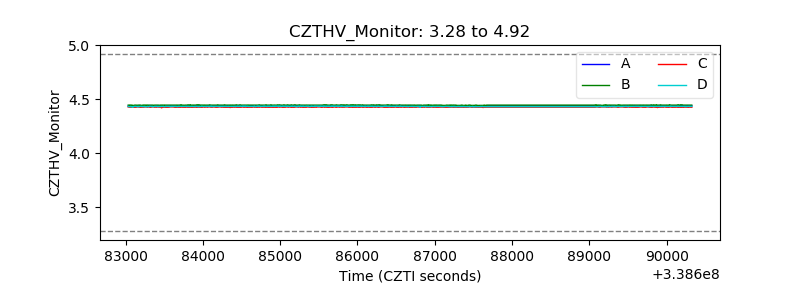 |
| D_VDD | 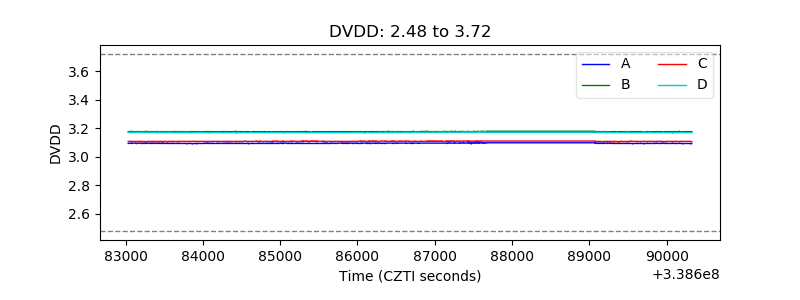 |
| Temperature 1 | 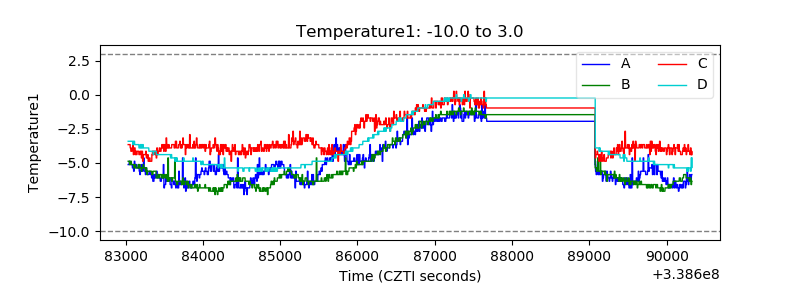 |
| Veto HV Monitor | 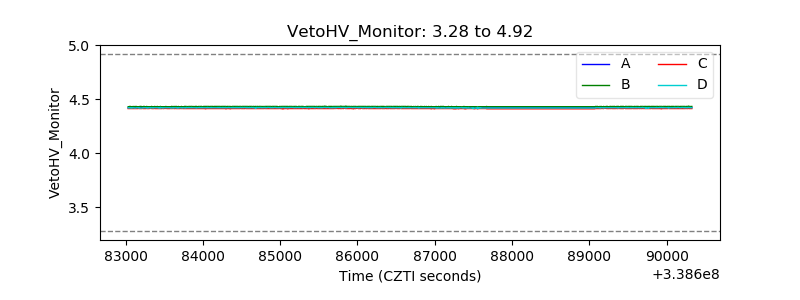 |
| Veto LLD | 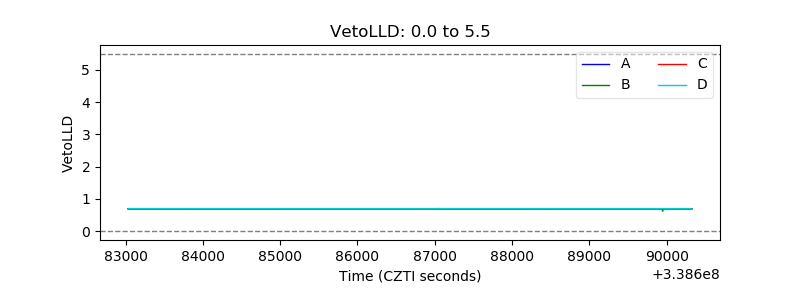 |
| Alpha Counter | 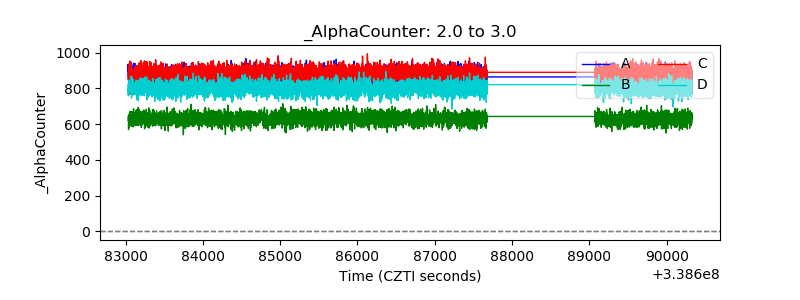 |
| _CPM_Rate | 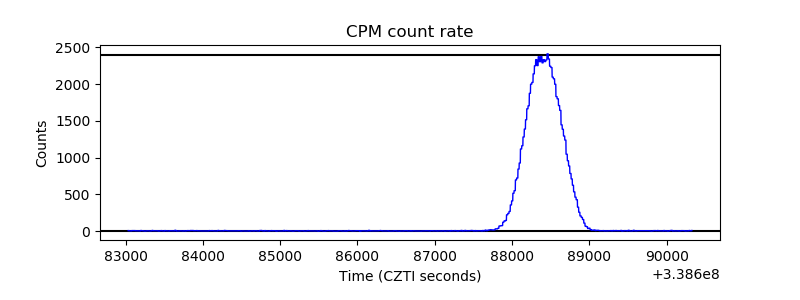 |
| CZT Counter | 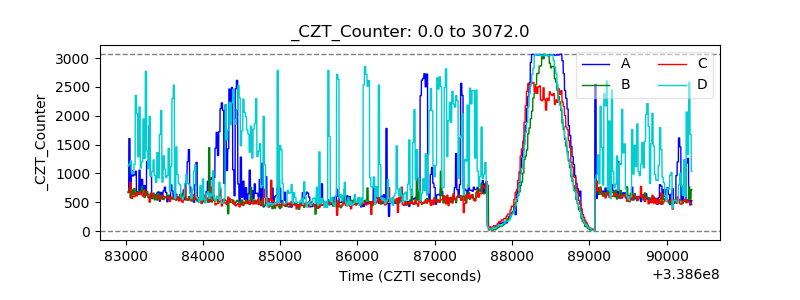 |
| +2.5 Volts monitor |  |
| +5 Volts monitor |  |
| _ROLL_ROT | 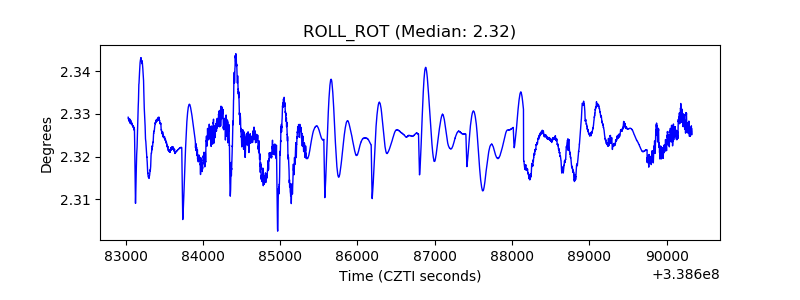 |
| _Roll_DEC | 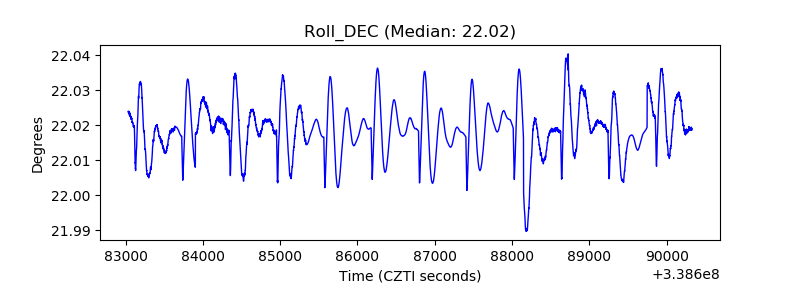 |
| _Roll_RA | 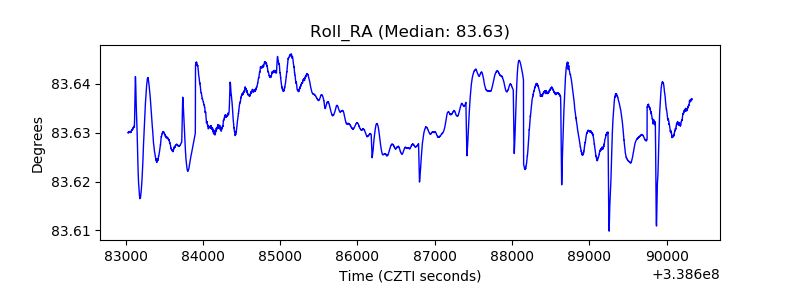 |
| Veto Counter | 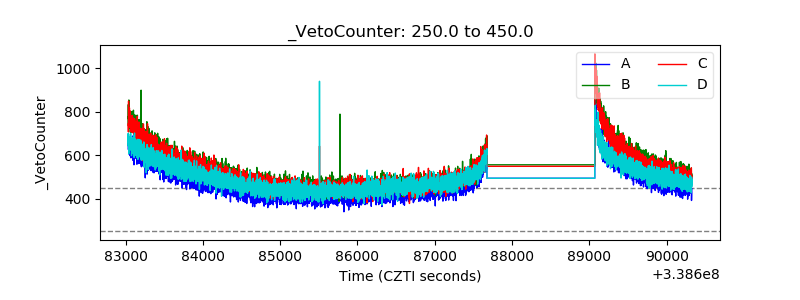 |