| Param | Original file | Final file |
|---|---|---|
| Filename | modeM0/AS1A09_145T01_9000003900_26997cztM0_level2.evt | modeM0/AS1A09_145T01_9000003900_26997cztM0_level2_quad_clean.evt |
| Size (bytes) | 653,616,000 | 106,980,480 |
| Size | 623.3 MB | 102.0 MB |
| Events in quadrant A | 7,244,576 | 692,298 |
| Events in quadrant B | 3,259,123 | 749,326 |
| Events in quadrant C | 3,247,947 | 710,357 |
| Events in quadrant D | 5,624,324 | 655,381 |
| Mode M0 | |||
|---|---|---|---|
| Quadrant | BADHDUFLAG | Total packets | Discarded packets |
| A | 0 | 25774 | 0 |
| B | 0 | 13391 | 0 |
| C | 0 | 13304 | 0 |
| D | 0 | 20936 | 0 |
| Mode M9 | |||
|---|---|---|---|
| Quadrant | BADHDUFLAG | Total packets | Discarded packets |
| A | 0 | 13 | 0 |
| B | 0 | 13 | 0 |
| C | 0 | 13 | 0 |
| D | 0 | 13 | 0 |
| Quadrant | Total seconds | Saturated seconds | Saturation percentage |
|---|---|---|---|
| A | 6195 | 1432 | 23.115416% |
| B | 6196 | 35 | 0.564881% |
| C | 6196 | 81 | 1.307295% |
| D | 6195 | 407 | 6.569814% |
Noise dominated data is calculated using 1-second bins in cleaned event files. If a bin has >2000 counts, and if more than 50% of those come from <1% of pixels, then it is considered to be noise-dominated and hence unusable.
| Quadrant | # 1 sec bins | Bins with >0 counts | Bins with >2000 counts | High rate bins dominated by noise | Noise dominated (total time) | Noise dominated (detector-on time) | Marked lightcurve |
|---|---|---|---|---|---|---|---|
| A | 7450 | 6196 | 1224 | 1224 | 16.43% | 19.75% | 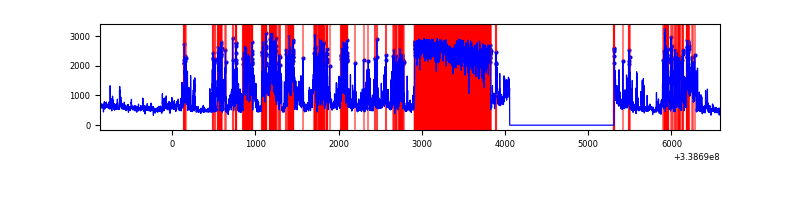 |
| B | 7451 | 6197 | 0 | 0 | 0.00% | 0.00% | 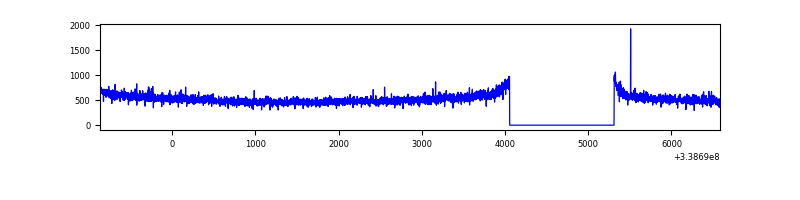 |
| C | 7451 | 6196 | 0 | 0 | 0.00% | 0.00% | 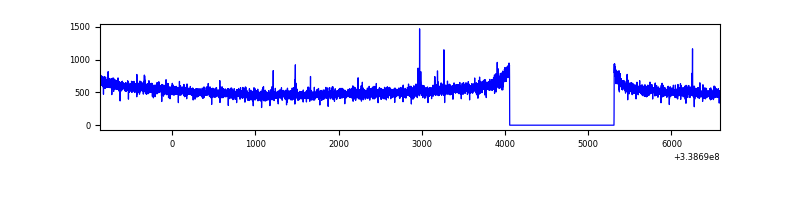 |
| D | 7450 | 6196 | 393 | 393 | 5.28% | 6.34% | 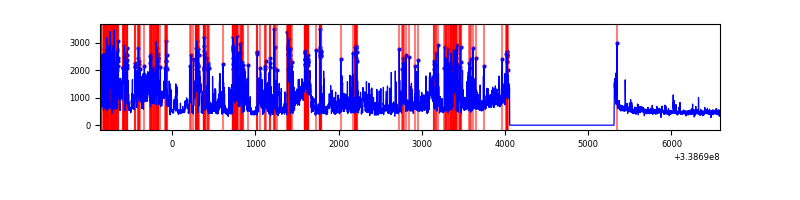 |
Top three noisy pixels from each quadrant. If the there are fewer than three noisy pixels in the level2.evt file, extra rows are filled as -1
| Pixel properties | Quadrant properties | ||||||
|---|---|---|---|---|---|---|---|
| Quadrant | DetID | PixID | Counts | Sigma | Mean | Median | Sigma |
| A | 6 | 16 | 2667873 | 18195.15 | 729 | 717 | 146.6 |
| A | 14 | 235 | 1752070 | 11947.61 | 729 | 717 | 146.6 |
| A | 8 | 192 | 12857 | 82.82 | 729 | 717 | 146.6 |
| B | 0 | 219 | 22146 | 136.41 | 826 | 808 | 156.4 |
| B | 12 | 111 | 18107 | 110.59 | 826 | 808 | 156.4 |
| B | 11 | 111 | 16056 | 97.48 | 826 | 808 | 156.4 |
| C | 14 | 238 | 130540 | 700.1 | 793 | 802 | 185.3 |
| C | 15 | 208 | 14226 | 72.44 | 793 | 802 | 185.3 |
| C | 5 | 218 | 6456 | 30.51 | 793 | 802 | 185.3 |
| D | 1 | 52 | 1411588 | 7142.33 | 765 | 753 | 197.5 |
| D | 5 | 222 | 820647 | 4150.7 | 765 | 753 | 197.5 |
| D | 11 | 176 | 254391 | 1284.04 | 765 | 753 | 197.5 |
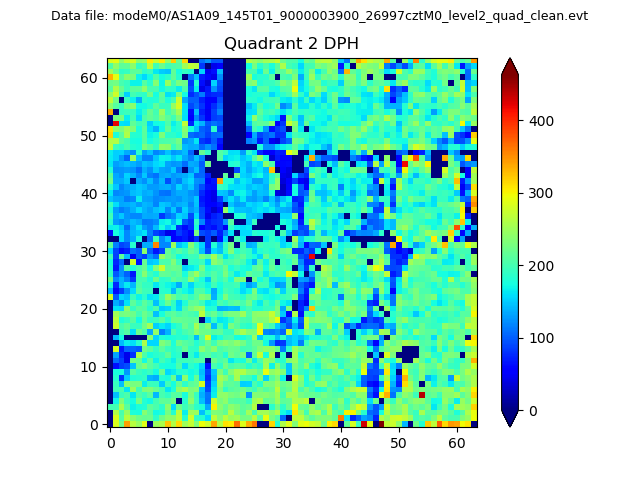
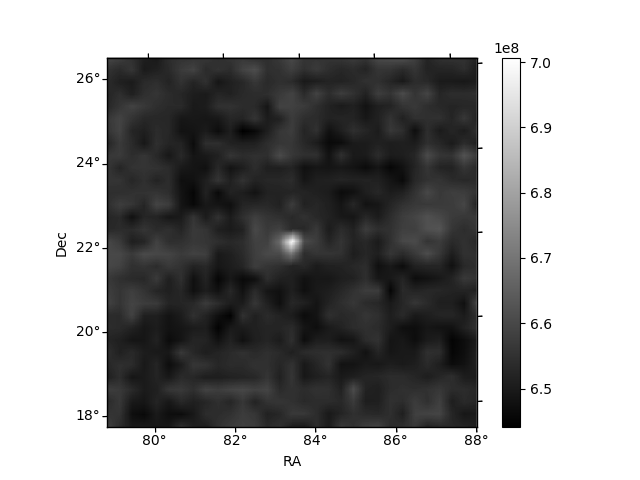
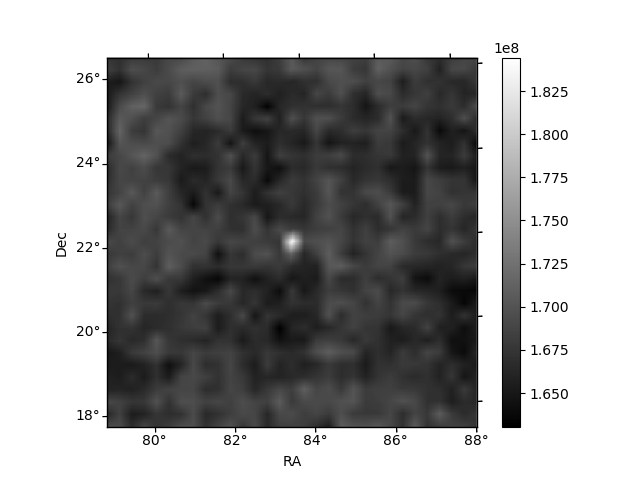
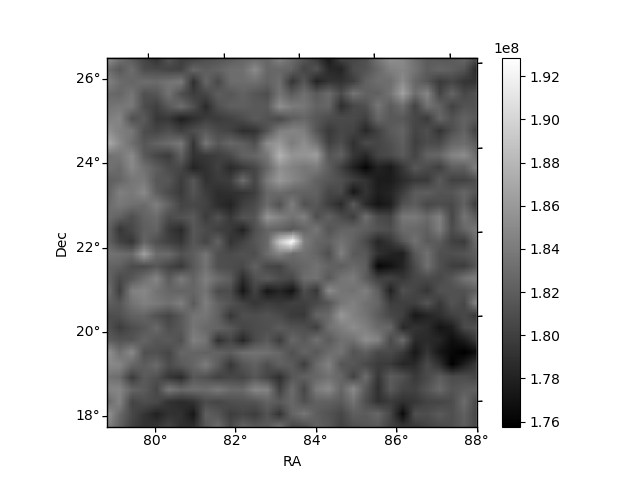
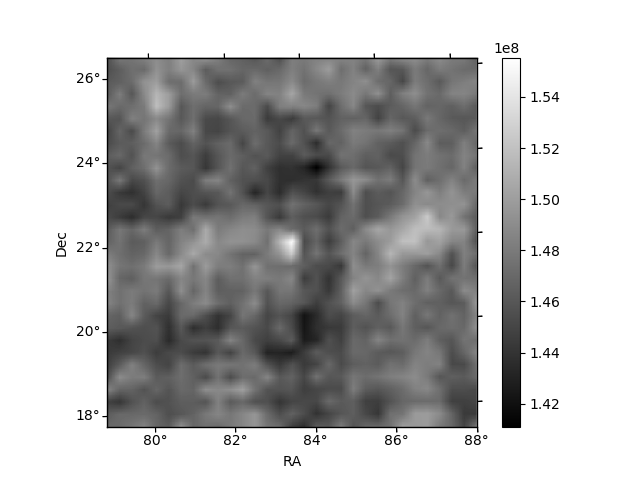
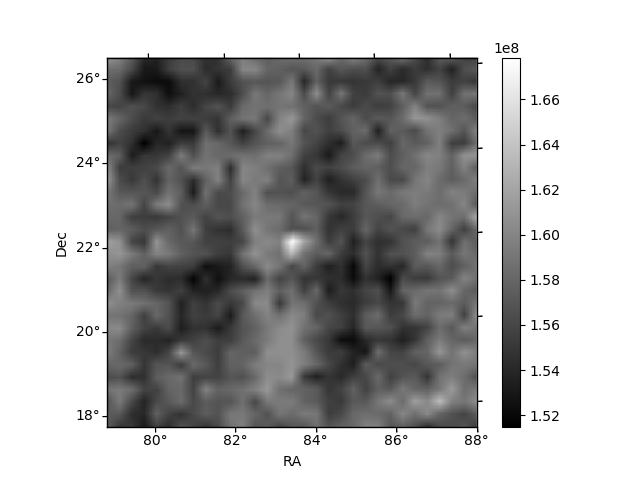
Histogram calculated using DETX and DETY for each event in the final _common_clean file
| Quadrant A | 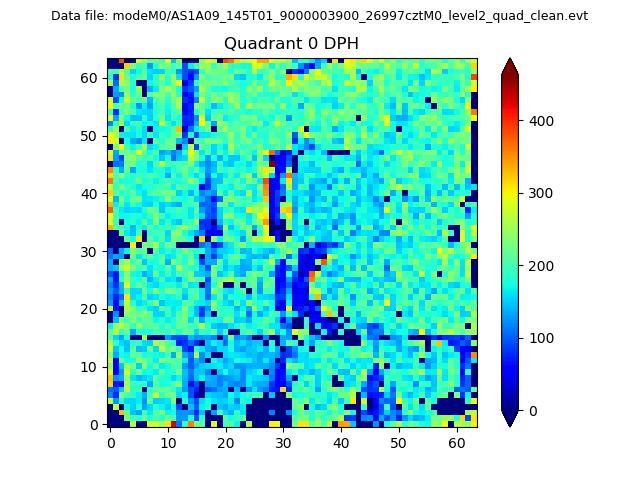 |
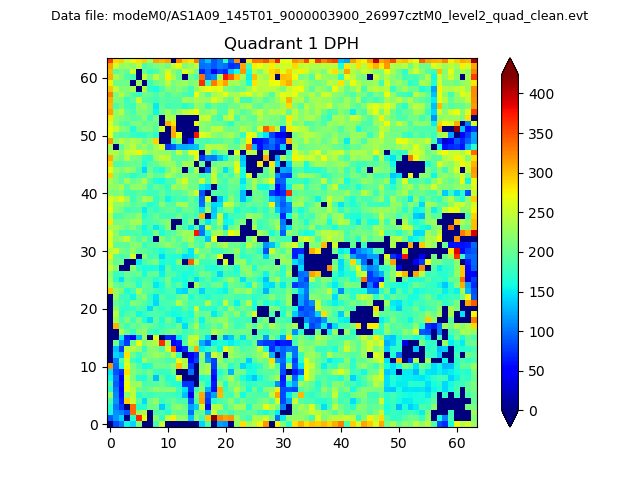 |
Quadrant B |
|---|---|---|---|
| Quadrant D | 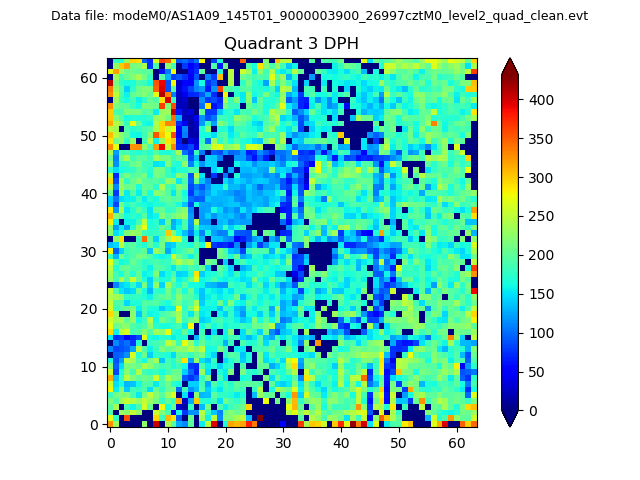 |
 |
Quadrant C |
| Plot type | Count rate plots | Images |
|---|---|---|
| Comparison with Poisson distribution Blue bars denote a histogram of data divided into 1 sec bins. Red curve is a Poisson curve with rate = median count rate of data. |
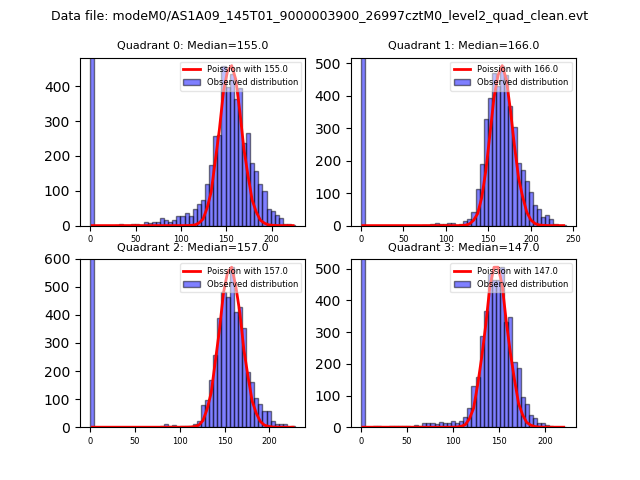 |
 |
| Quadrant-wise count rates Data is divided into 100 sec bins |
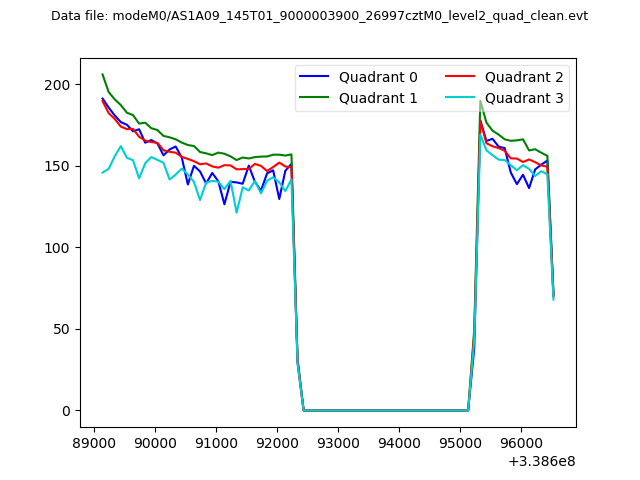 |
|
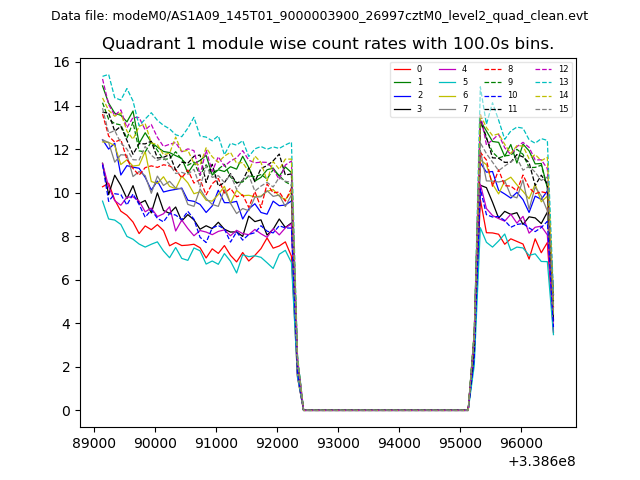
| Module-wise count rates for Quadrant A Data is divided into 100 sec bins |
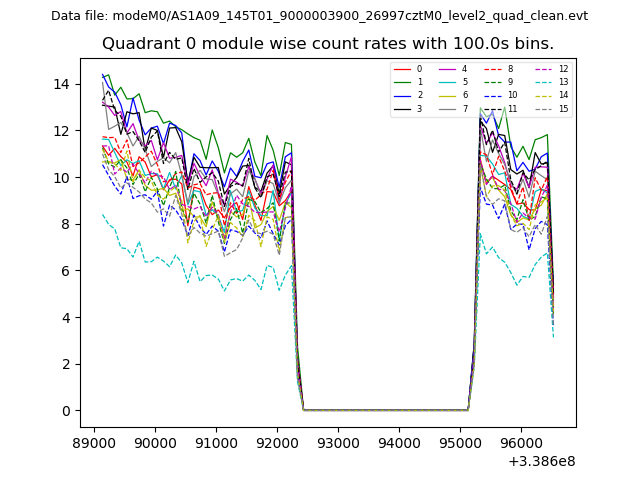 |
 |
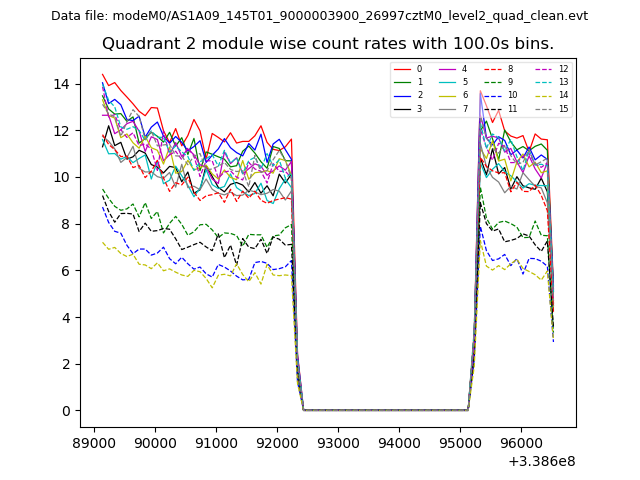
| Module-wise count rates for Quadrant B Data is divided into 100 sec bins |
 |
 |
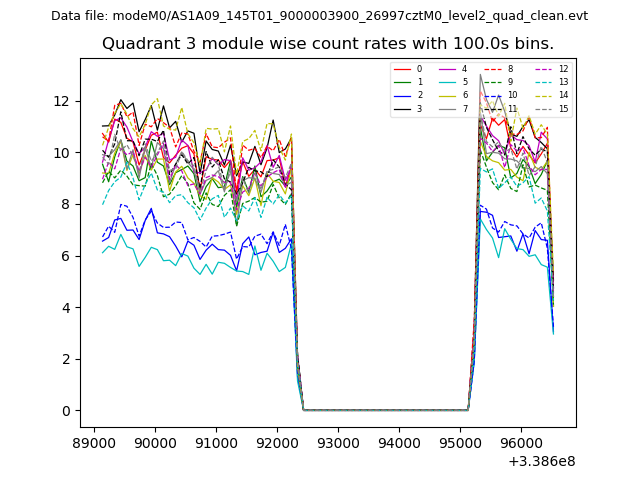
| Module-wise count rates for Quadrant C Data is divided into 100 sec bins |
 |
 |
| Module-wise count rates for Quadrant D Data is divided into 100 sec bins |
 |
 |
| Parameter | Plot |
|---|---|
| CZT HV Monitor | 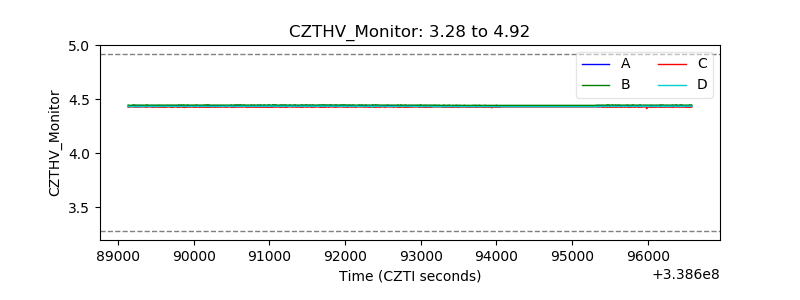 |
| D_VDD | 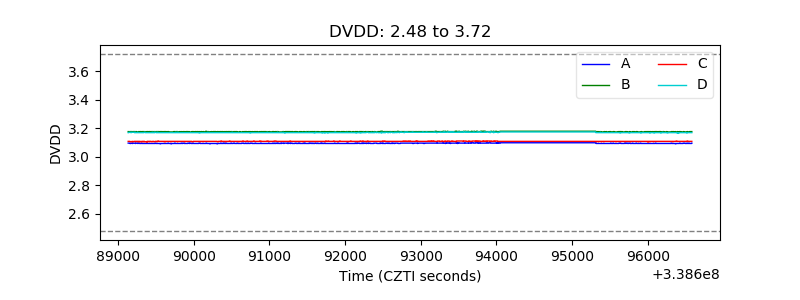 |
| Temperature 1 | 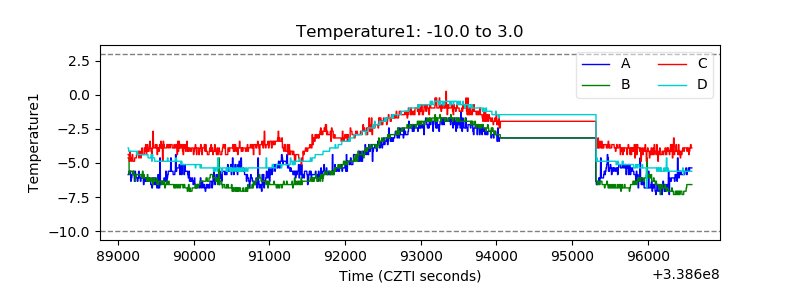 |
| Veto HV Monitor | 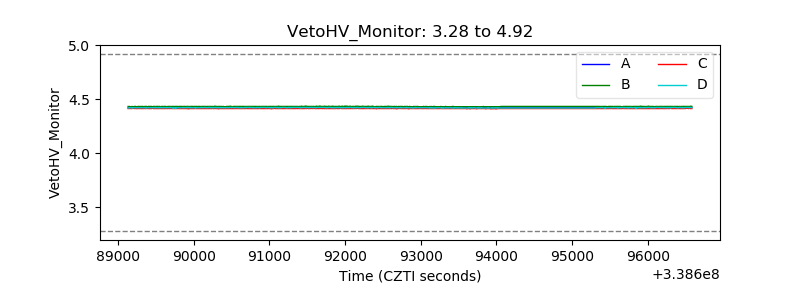 |
| Veto LLD | 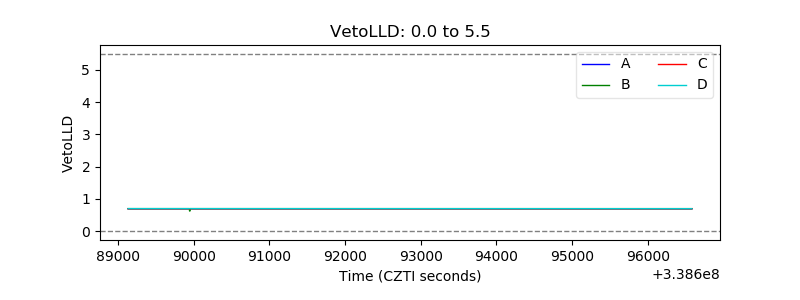 |
| Alpha Counter | 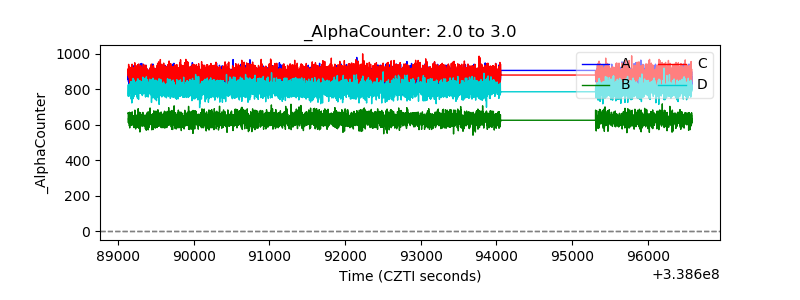 |
| _CPM_Rate | 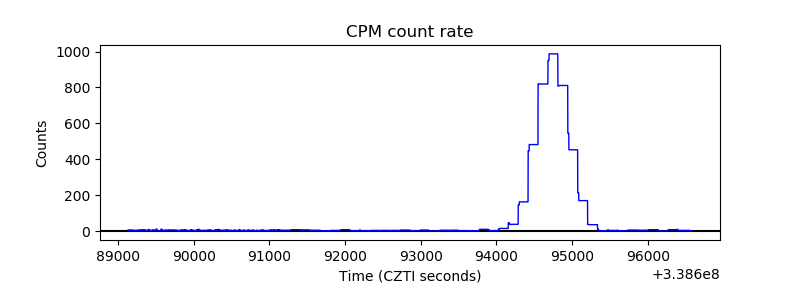 |
| CZT Counter | 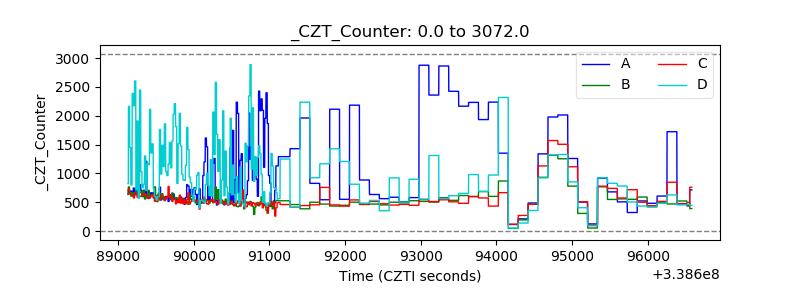 |
| +2.5 Volts monitor |  |
| +5 Volts monitor |  |
| _ROLL_ROT | 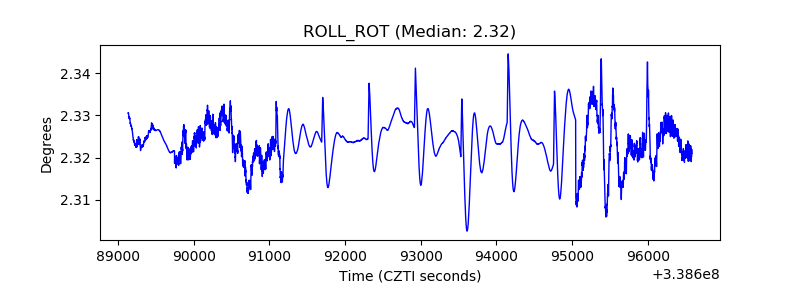 |
| _Roll_DEC | 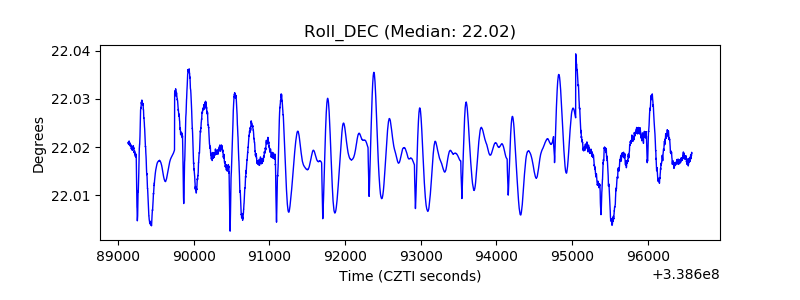 |
| _Roll_RA | 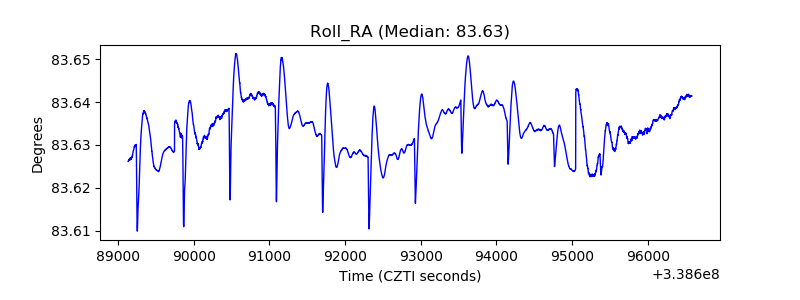 |
| Veto Counter | 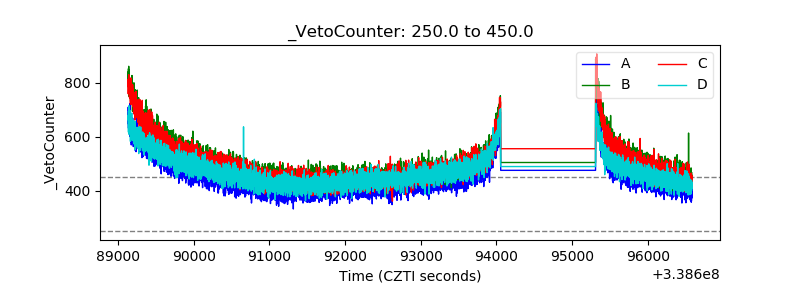 |