| Param | Original file | Final file |
|---|---|---|
| Filename | modeM0/AS1A09_145T01_9000003900_26998cztM0_level2.evt | modeM0/AS1A09_145T01_9000003900_26998cztM0_level2_quad_clean.evt |
| Size (bytes) | 593,202,240 | 110,134,080 |
| Size | 565.7 MB | 105.0 MB |
| Events in quadrant A | 6,343,432 | 701,731 |
| Events in quadrant B | 3,587,382 | 747,267 |
| Events in quadrant C | 3,568,050 | 712,344 |
| Events in quadrant D | 3,989,281 | 683,461 |
| Mode M0 | |||
|---|---|---|---|
| Quadrant | BADHDUFLAG | Total packets | Discarded packets |
| A | 0 | 23611 | 0 |
| B | 0 | 14909 | 0 |
| C | 0 | 14829 | 0 |
| D | 0 | 16573 | 0 |
| Mode M9 | |||
|---|---|---|---|
| Quadrant | BADHDUFLAG | Total packets | Discarded packets |
| A | 0 | 9 | 0 |
| B | 0 | 10 | 0 |
| C | 0 | 10 | 0 |
| D | 0 | 10 | 0 |
| Quadrant | Total seconds | Saturated seconds | Saturation percentage |
|---|---|---|---|
| A | 7040 | 623 | 8.849432% |
| B | 7040 | 60 | 0.852273% |
| C | 7040 | 93 | 1.321023% |
| D | 7040 | 121 | 1.718750% |
Noise dominated data is calculated using 1-second bins in cleaned event files. If a bin has >2000 counts, and if more than 50% of those come from <1% of pixels, then it is considered to be noise-dominated and hence unusable.
| Quadrant | # 1 sec bins | Bins with >0 counts | Bins with >2000 counts | High rate bins dominated by noise | Noise dominated (total time) | Noise dominated (detector-on time) | Marked lightcurve |
|---|---|---|---|---|---|---|---|
| A | 7975 | 7040 | 365 | 365 | 4.58% | 5.18% | 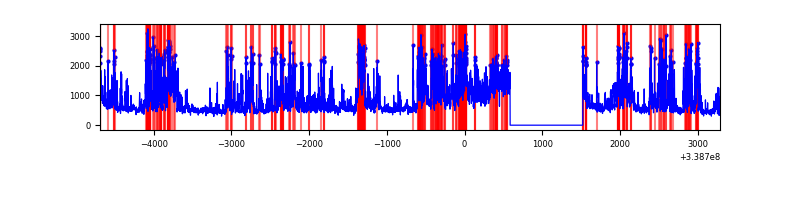 |
| B | 7975 | 7041 | 0 | 0 | 0.00% | 0.00% | 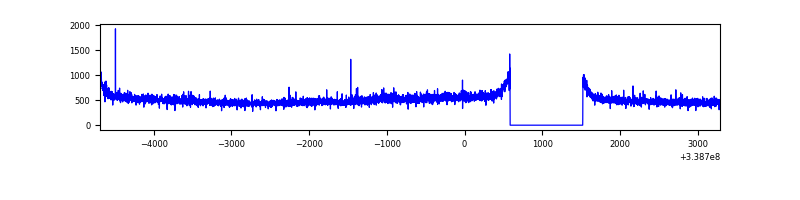 |
| C | 7975 | 7041 | 1 | 1 | 0.01% | 0.01% | 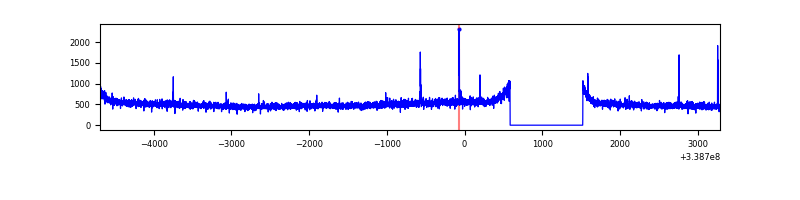 |
| D | 7975 | 7041 | 112 | 112 | 1.40% | 1.59% | 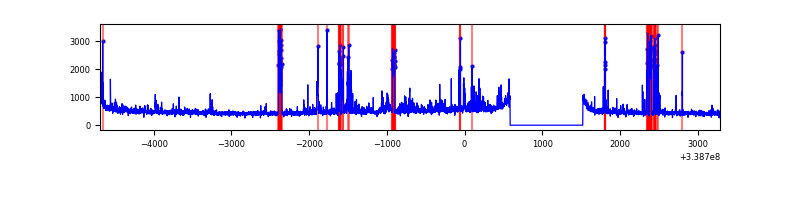 |
Top three noisy pixels from each quadrant. If the there are fewer than three noisy pixels in the level2.evt file, extra rows are filled as -1
| Pixel properties | Quadrant properties | ||||||
|---|---|---|---|---|---|---|---|
| Quadrant | DetID | PixID | Counts | Sigma | Mean | Median | Sigma |
| A | 6 | 16 | 1663346 | 9391.48 | 876 | 861 | 177.0 |
| A | 14 | 235 | 1271568 | 7178.3 | 876 | 861 | 177.0 |
| A | 8 | 192 | 25290 | 138.0 | 876 | 861 | 177.0 |
| B | 0 | 219 | 40642 | 229.3 | 903 | 883 | 173.4 |
| B | 12 | 111 | 20678 | 114.16 | 903 | 883 | 173.4 |
| B | 11 | 111 | 18247 | 100.14 | 903 | 883 | 173.4 |
| C | 14 | 238 | 138457 | 671.39 | 869 | 878 | 204.9 |
| C | 15 | 208 | 35298 | 167.97 | 869 | 878 | 204.9 |
| C | 5 | 218 | 8395 | 36.68 | 869 | 878 | 204.9 |
| D | 5 | 222 | 289782 | 1385.77 | 863 | 842 | 208.5 |
| D | 11 | 176 | 247641 | 1183.66 | 863 | 842 | 208.5 |
| D | 12 | 233 | 86314 | 409.93 | 863 | 842 | 208.5 |
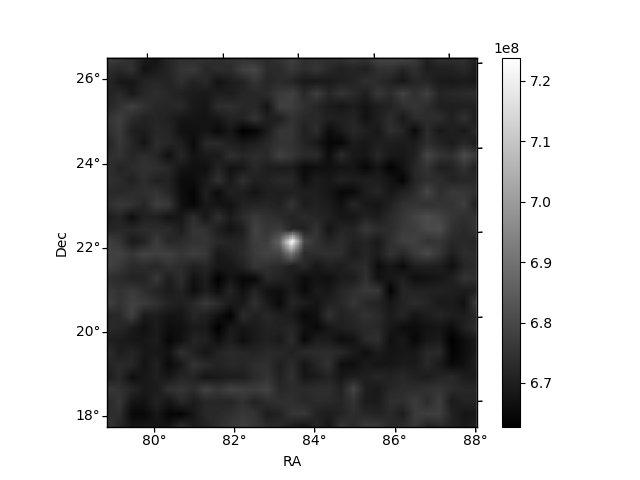
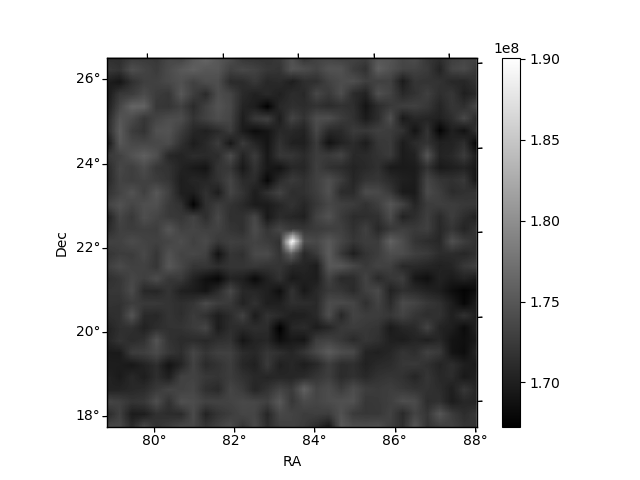
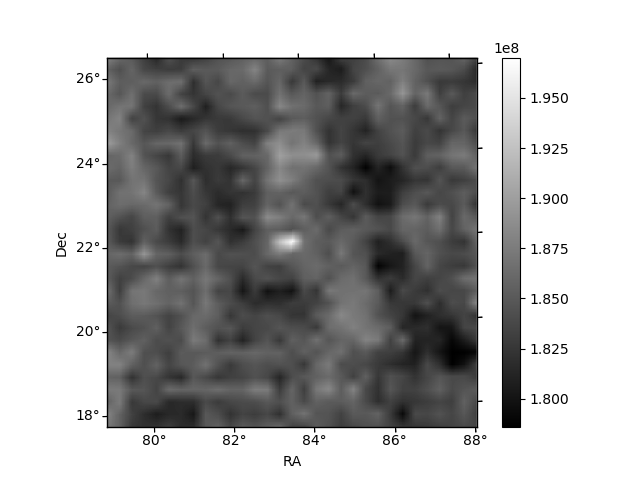
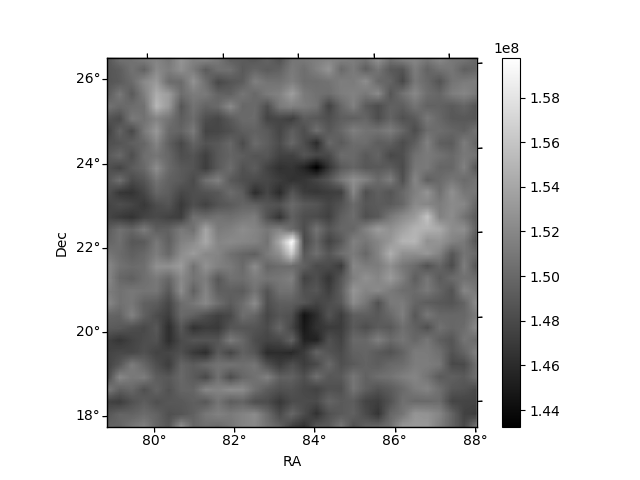
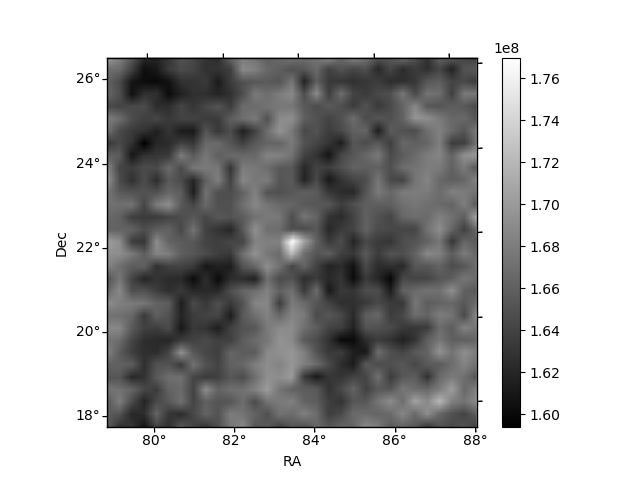
Histogram calculated using DETX and DETY for each event in the final _common_clean file
| Quadrant A | 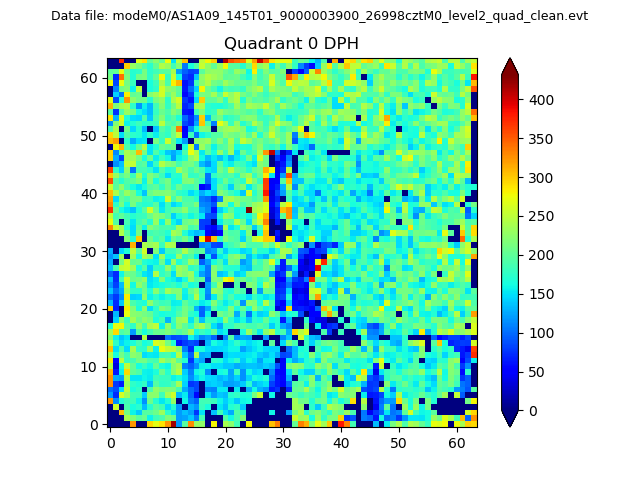 |
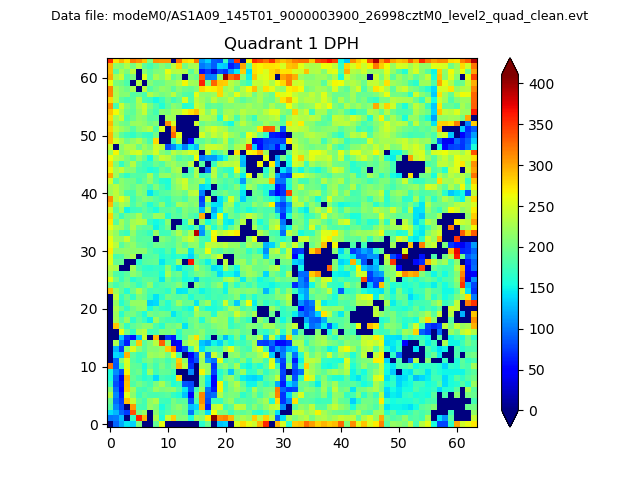 |
Quadrant B |
|---|---|---|---|
| Quadrant D |  |
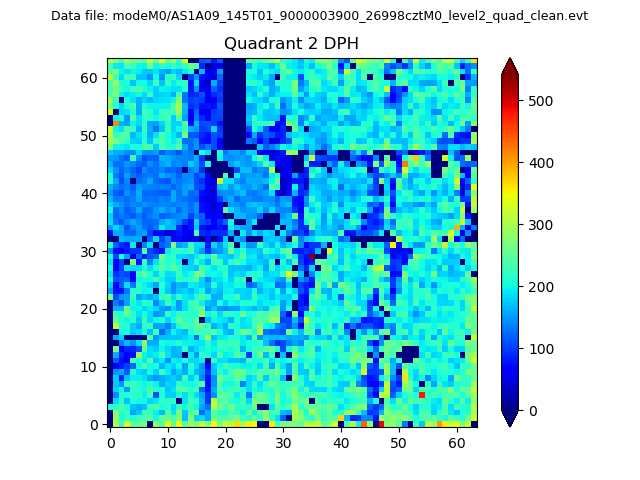 |
Quadrant C |
| Plot type | Count rate plots | Images |
|---|---|---|
| Comparison with Poisson distribution Blue bars denote a histogram of data divided into 1 sec bins. Red curve is a Poisson curve with rate = median count rate of data. |
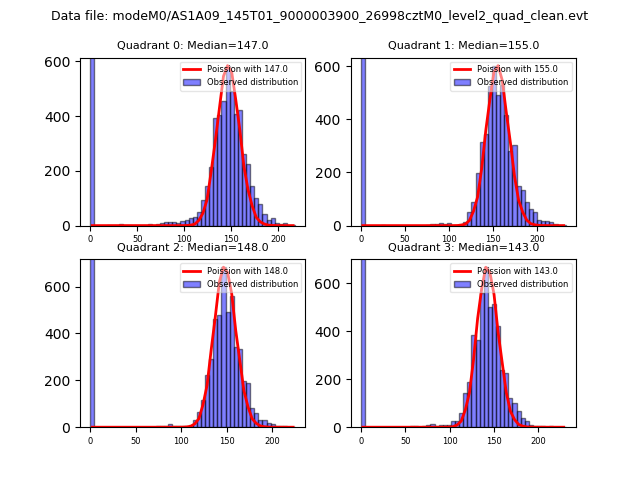 |
 |
| Quadrant-wise count rates Data is divided into 100 sec bins |
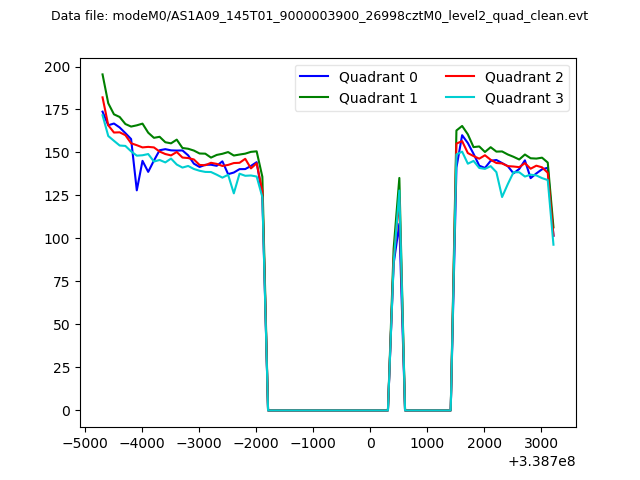 |
|
| Module-wise count rates for Quadrant A Data is divided into 100 sec bins |
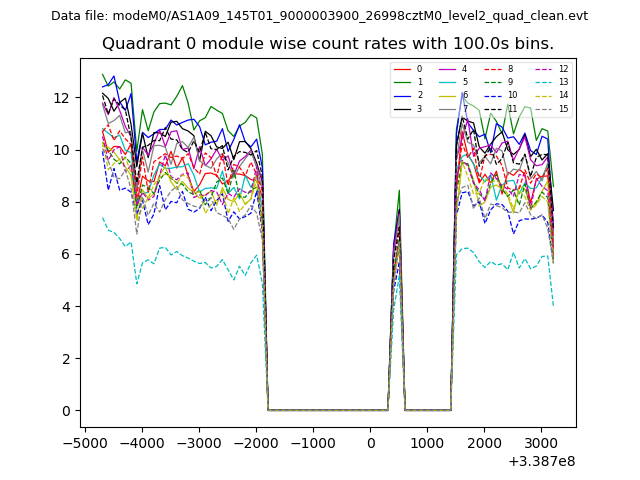 |
 |
| Module-wise count rates for Quadrant B Data is divided into 100 sec bins |
 |
 |
| Module-wise count rates for Quadrant C Data is divided into 100 sec bins |
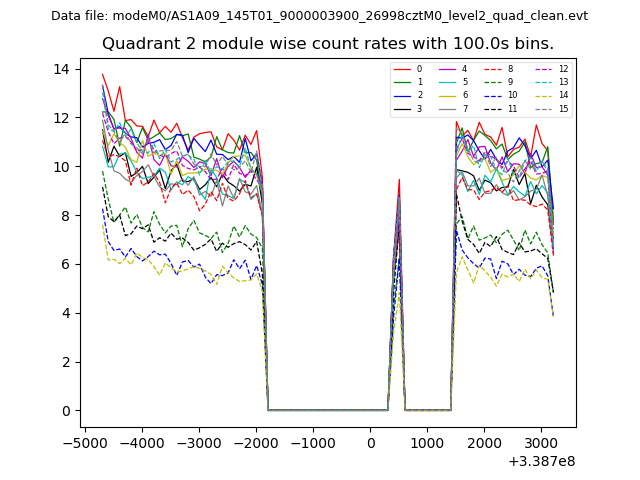 |
 |
| Module-wise count rates for Quadrant D Data is divided into 100 sec bins |
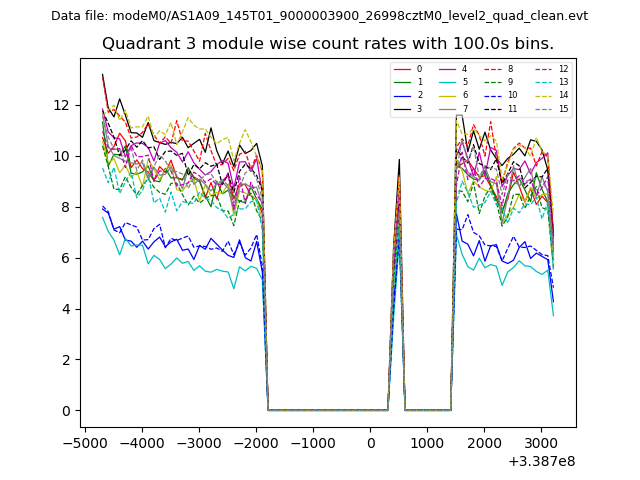 |
 |
| Parameter | Plot |
|---|---|
| CZT HV Monitor | 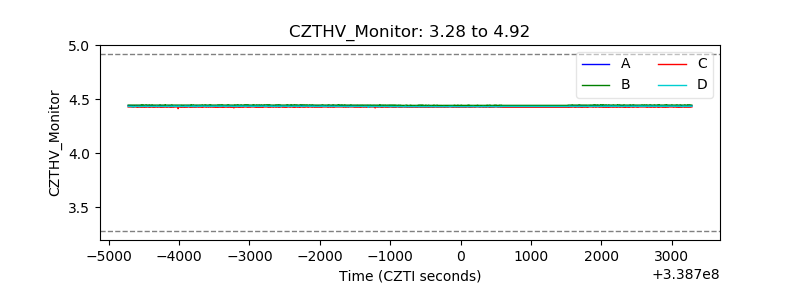 |
| D_VDD | 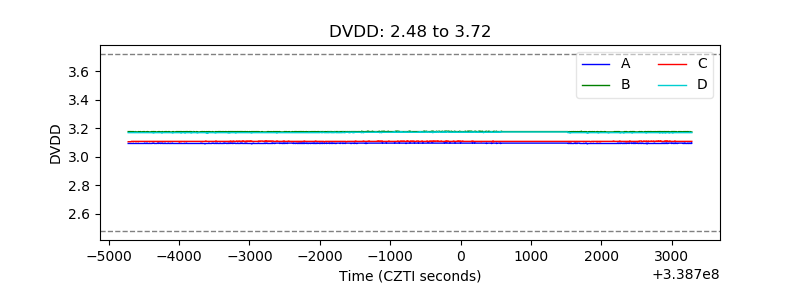 |
| Temperature 1 | 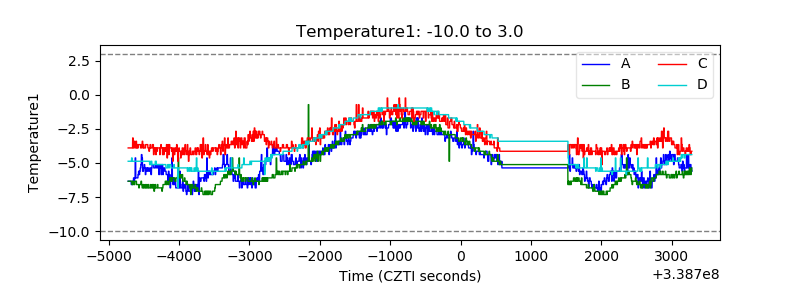 |
| Veto HV Monitor | 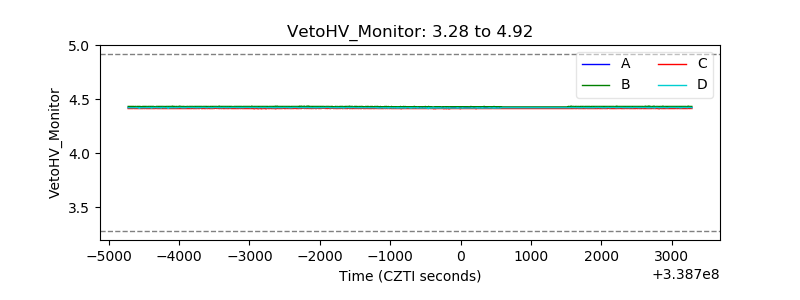 |
| Veto LLD | 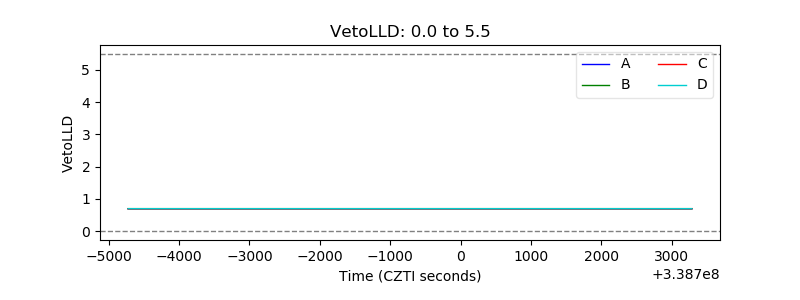 |
| Alpha Counter | 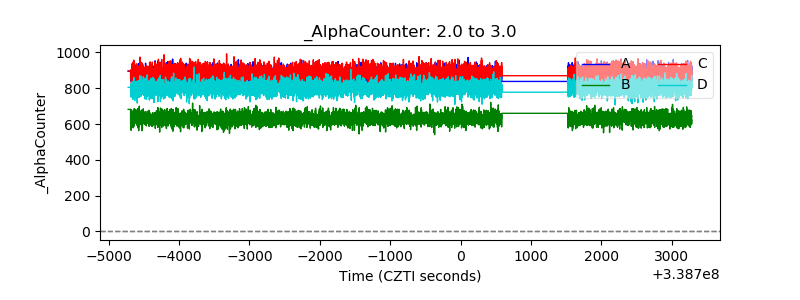 |
| _CPM_Rate | 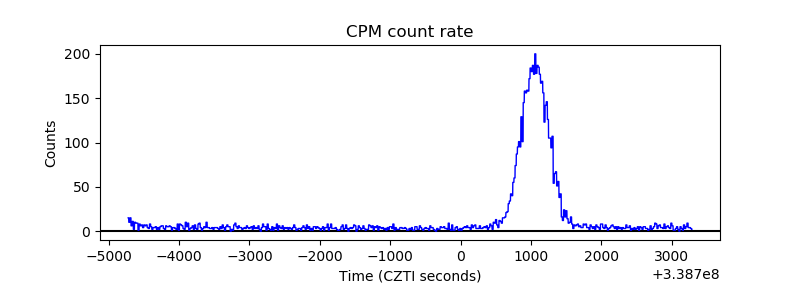 |
| CZT Counter | 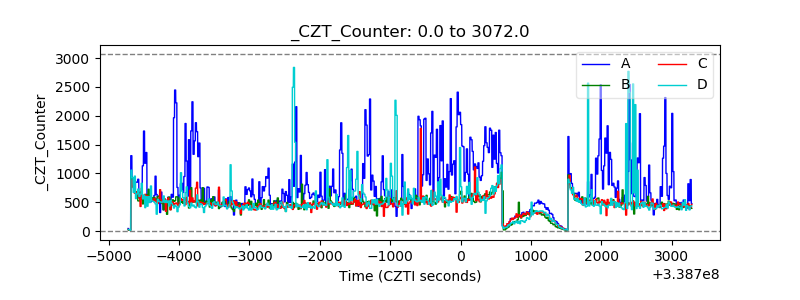 |
| +2.5 Volts monitor |  |
| +5 Volts monitor |  |
| _ROLL_ROT | 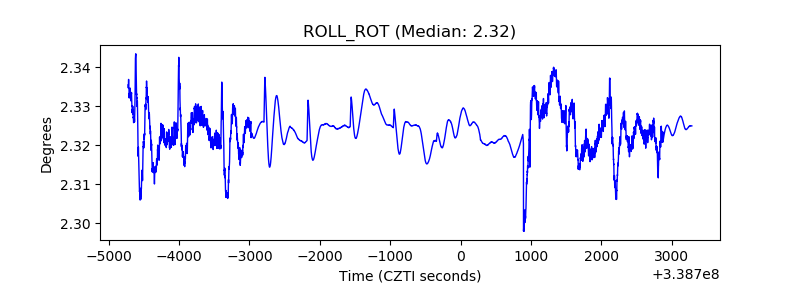 |
| _Roll_DEC | 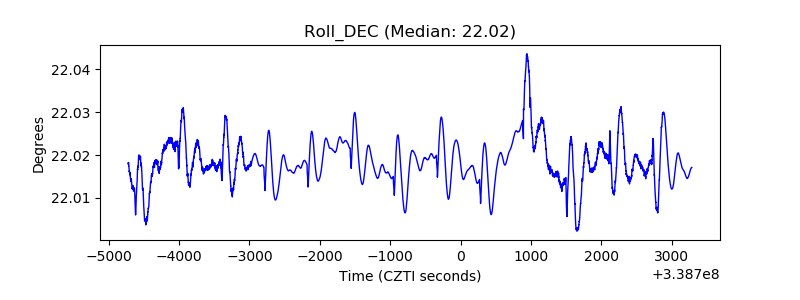 |
| _Roll_RA | 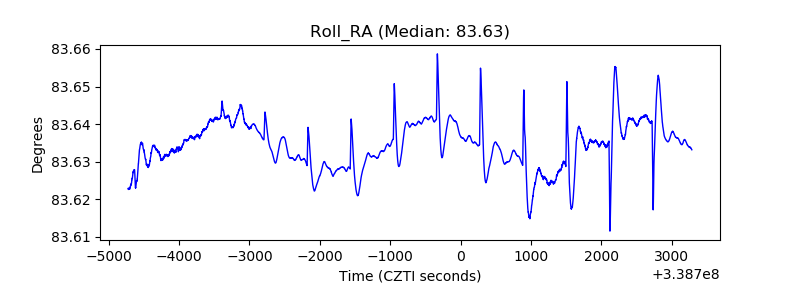 |
| Veto Counter | 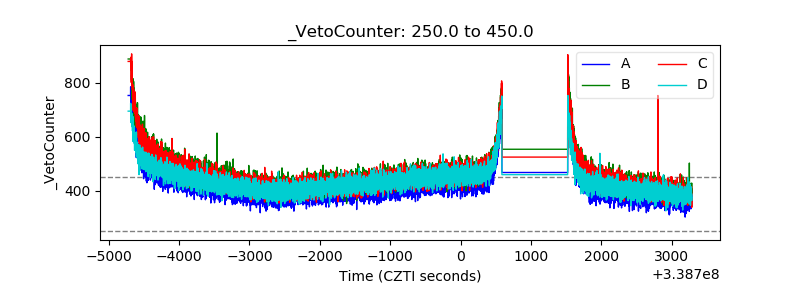 |