| Param | Original file | Final file |
|---|---|---|
| Filename | modeM0/AS1A09_145T01_9000003900_26999cztM0_level2.evt | modeM0/AS1A09_145T01_9000003900_26999cztM0_level2_quad_clean.evt |
| Size (bytes) | 645,557,760 | 100,405,440 |
| Size | 615.7 MB | 95.8 MB |
| Events in quadrant A | 5,863,182 | 620,447 |
| Events in quadrant B | 3,377,175 | 681,955 |
| Events in quadrant C | 3,363,759 | 654,670 |
| Events in quadrant D | 6,483,426 | 606,587 |
| Mode M0 | |||
|---|---|---|---|
| Quadrant | BADHDUFLAG | Total packets | Discarded packets |
| A | 0 | 21937 | 0 |
| B | 0 | 14178 | 0 |
| C | 0 | 14184 | 0 |
| D | 0 | 24092 | 0 |
| Mode M9 | |||
|---|---|---|---|
| Quadrant | BADHDUFLAG | Total packets | Discarded packets |
| A | 0 | 5 | 0 |
| B | 0 | 5 | 0 |
| C | 0 | 5 | 0 |
| D | 0 | 5 | 0 |
| Quadrant | Total seconds | Saturated seconds | Saturation percentage |
|---|---|---|---|
| A | 6836 | 807 | 11.805149% |
| B | 6836 | 91 | 1.331188% |
| C | 6837 | 106 | 1.550388% |
| D | 6837 | 1133 | 16.571596% |
Noise dominated data is calculated using 1-second bins in cleaned event files. If a bin has >2000 counts, and if more than 50% of those come from <1% of pixels, then it is considered to be noise-dominated and hence unusable.
| Quadrant | # 1 sec bins | Bins with >0 counts | Bins with >2000 counts | High rate bins dominated by noise | Noise dominated (total time) | Noise dominated (detector-on time) | Marked lightcurve |
|---|---|---|---|---|---|---|---|
| A | 7361 | 6836 | 597 | 597 | 8.11% | 8.73% | 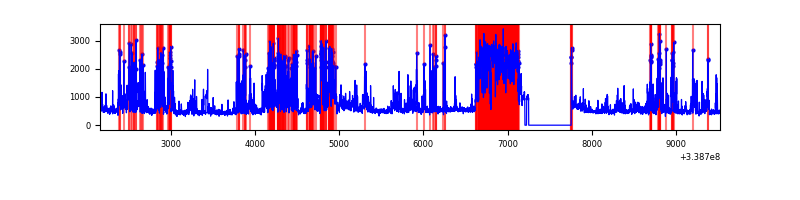 |
| B | 7361 | 6836 | 0 | 0 | 0.00% | 0.00% | 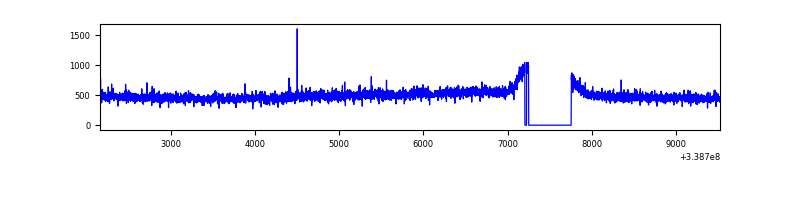 |
| C | 7362 | 6838 | 0 | 0 | 0.00% | 0.00% | 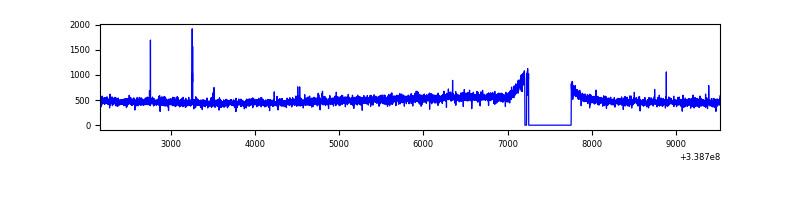 |
| D | 7362 | 6839 | 901 | 901 | 12.24% | 13.17% | 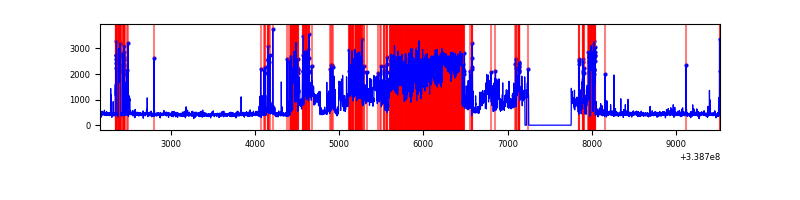 |
Top three noisy pixels from each quadrant. If the there are fewer than three noisy pixels in the level2.evt file, extra rows are filled as -1
| Pixel properties | Quadrant properties | ||||||
|---|---|---|---|---|---|---|---|
| Quadrant | DetID | PixID | Counts | Sigma | Mean | Median | Sigma |
| A | 6 | 16 | 1459626 | 8742.52 | 818 | 803 | 166.9 |
| A | 14 | 235 | 1207124 | 7229.31 | 818 | 803 | 166.9 |
| A | 15 | 174 | 22716 | 131.32 | 818 | 803 | 166.9 |
| B | 0 | 219 | 29524 | 173.51 | 856 | 835 | 165.3 |
| B | 12 | 111 | 19805 | 114.73 | 856 | 835 | 165.3 |
| B | 11 | 111 | 17700 | 102.0 | 856 | 835 | 165.3 |
| C | 14 | 238 | 131418 | 668.7 | 824 | 833 | 195.3 |
| C | 15 | 208 | 12220 | 58.31 | 824 | 833 | 195.3 |
| C | 5 | 218 | 8788 | 40.74 | 824 | 833 | 195.3 |
| D | 5 | 222 | 2901106 | 15475.38 | 776 | 758 | 187.4 |
| D | 11 | 176 | 380958 | 2028.63 | 776 | 758 | 187.4 |
| D | 1 | 52 | 128256 | 680.29 | 776 | 758 | 187.4 |
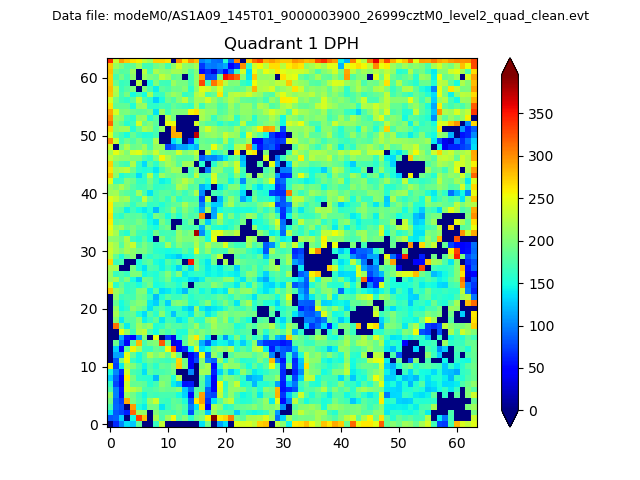
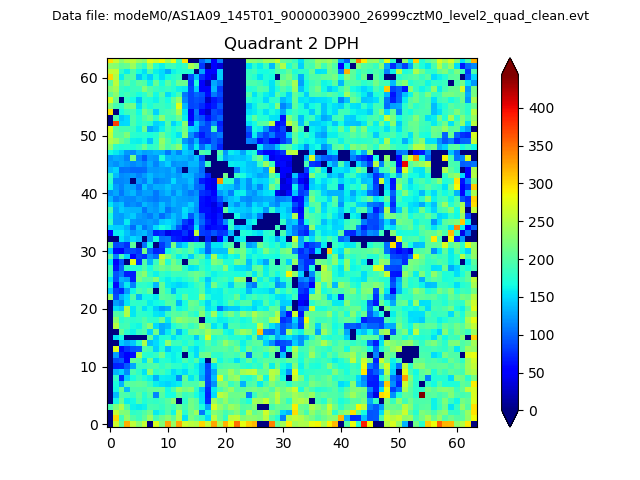
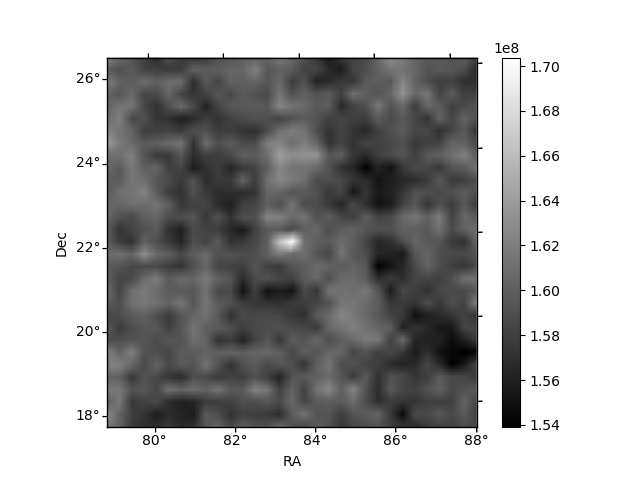
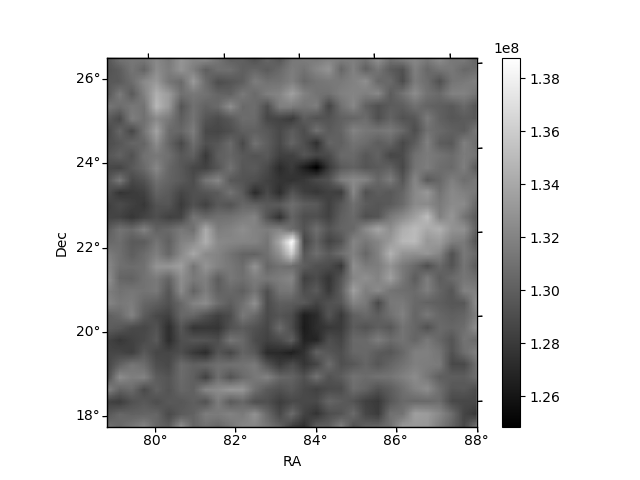
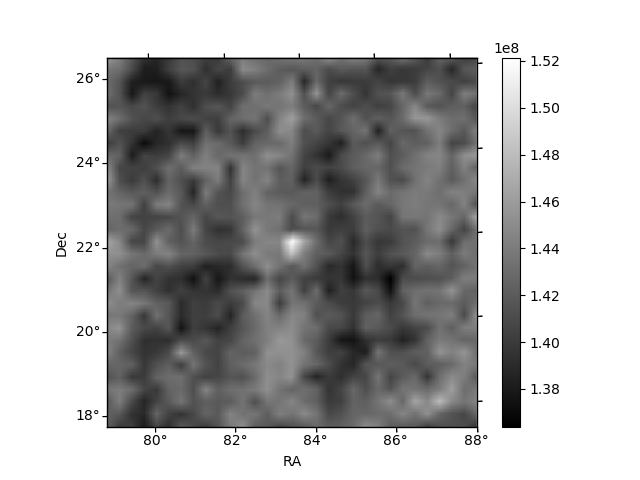
Histogram calculated using DETX and DETY for each event in the final _common_clean file
| Quadrant A |  |
 |
Quadrant B |
|---|---|---|---|
| Quadrant D | 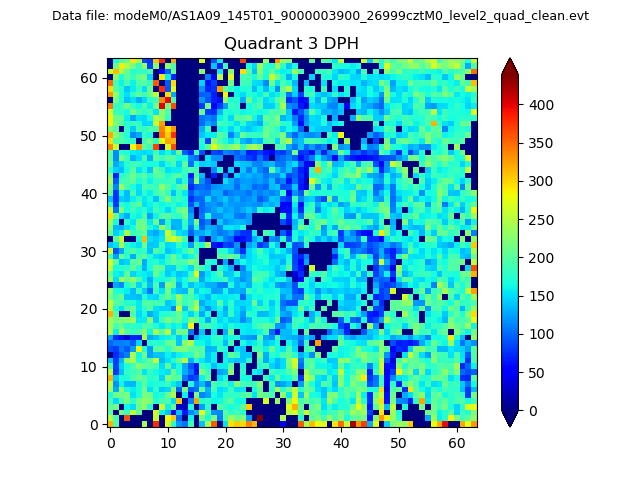 |
 |
Quadrant C |
| Plot type | Count rate plots | Images |
|---|---|---|
| Comparison with Poisson distribution Blue bars denote a histogram of data divided into 1 sec bins. Red curve is a Poisson curve with rate = median count rate of data. |
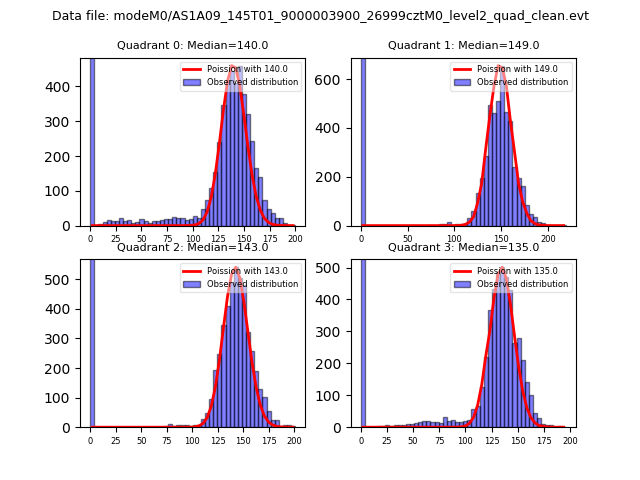 |
 |
| Quadrant-wise count rates Data is divided into 100 sec bins |
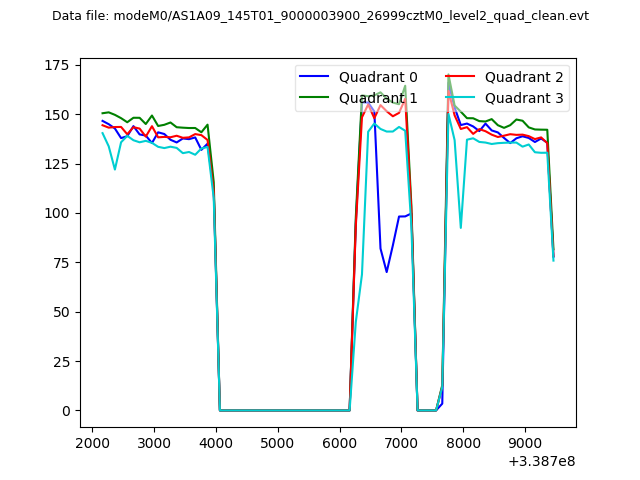 |
|
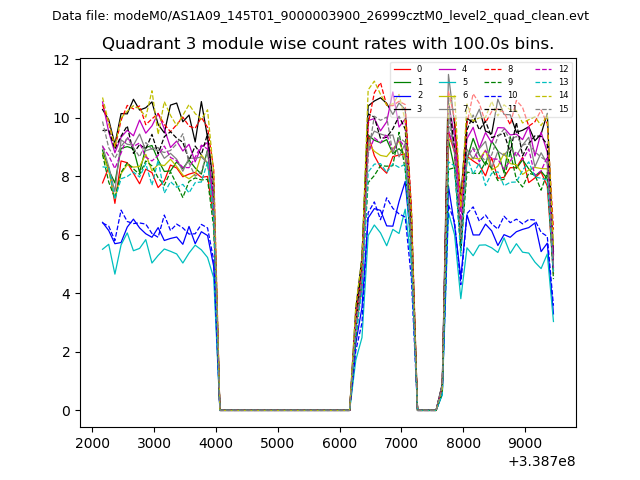
| Module-wise count rates for Quadrant A Data is divided into 100 sec bins |
 |
 |
| Module-wise count rates for Quadrant B Data is divided into 100 sec bins |
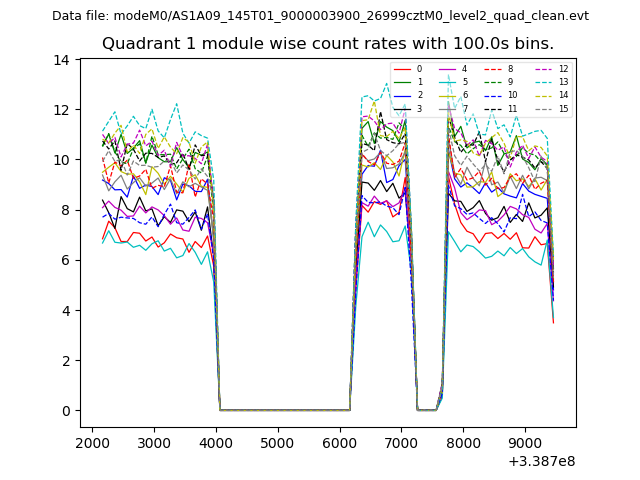 |
 |
| Module-wise count rates for Quadrant C Data is divided into 100 sec bins |
 |
 |
| Module-wise count rates for Quadrant D Data is divided into 100 sec bins |
 |
 |
| Parameter | Plot |
|---|---|
| CZT HV Monitor | 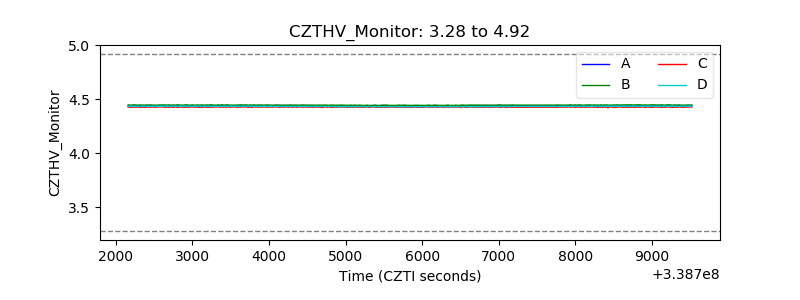 |
| D_VDD | 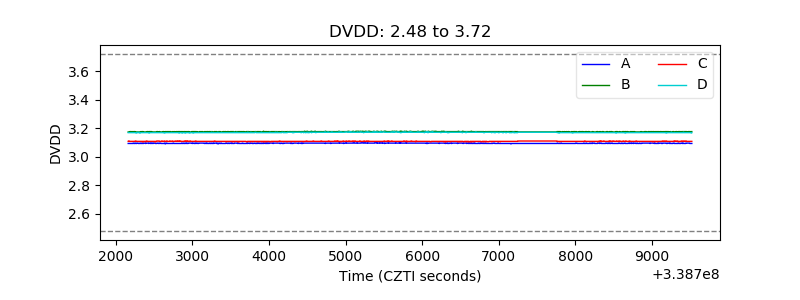 |
| Temperature 1 | 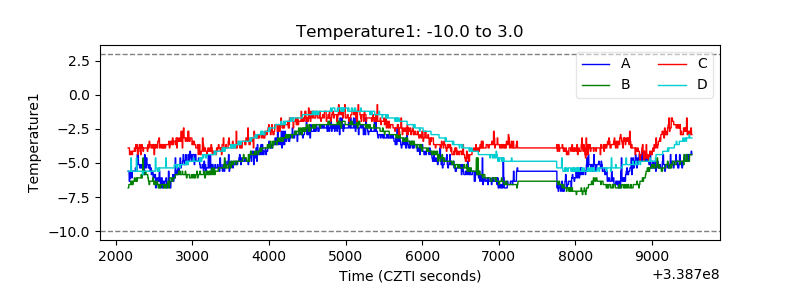 |
| Veto HV Monitor | 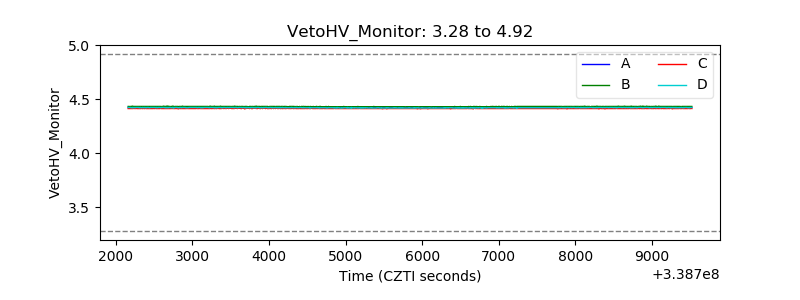 |
| Veto LLD | 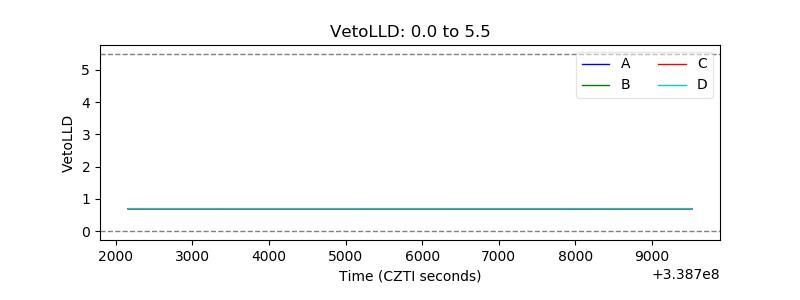 |
| Alpha Counter | 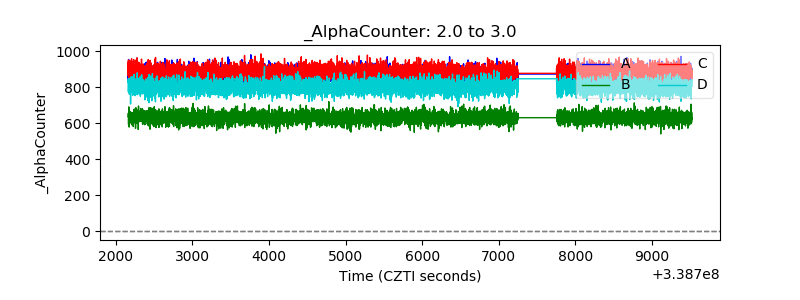 |
| _CPM_Rate | 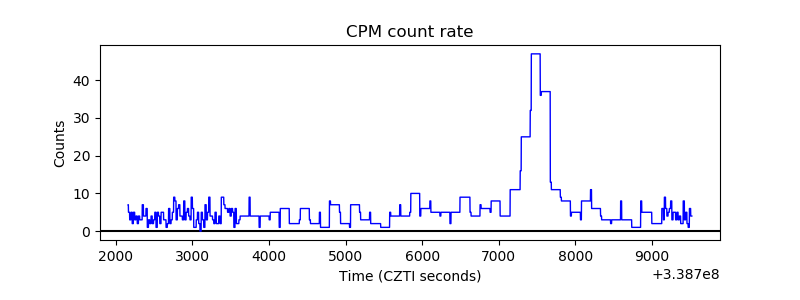 |
| CZT Counter | 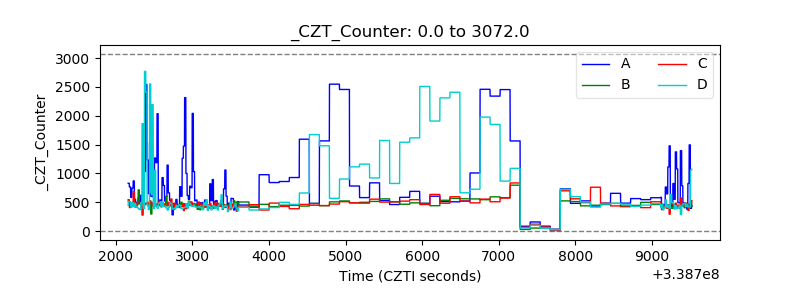 |
| +2.5 Volts monitor |  |
| +5 Volts monitor | 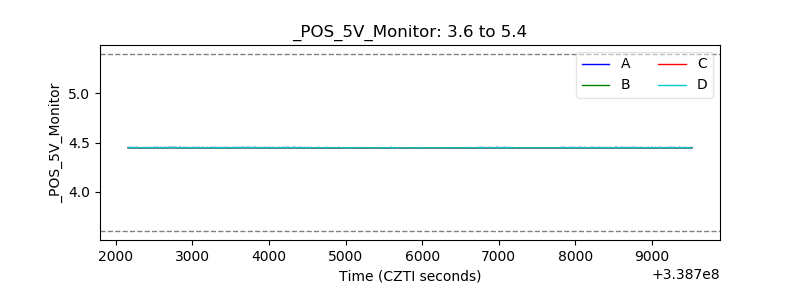 |
| _ROLL_ROT | 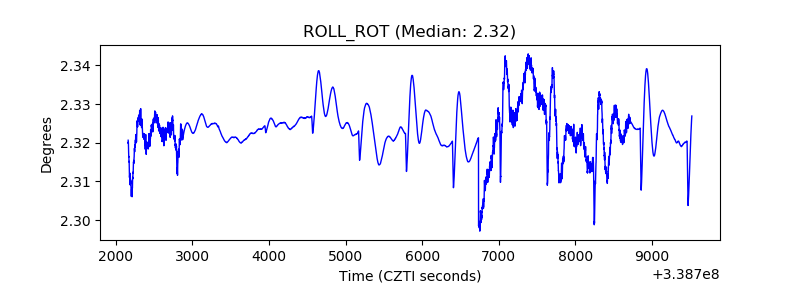 |
| _Roll_DEC | 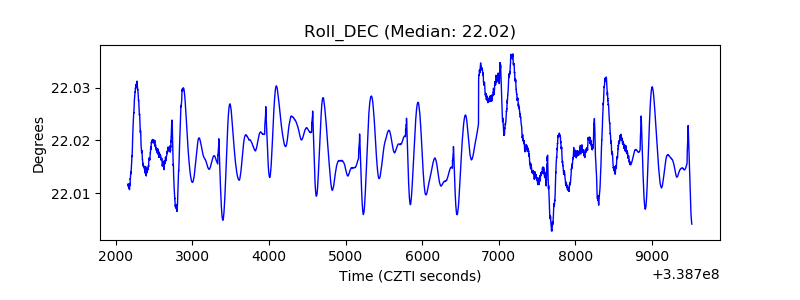 |
| _Roll_RA | 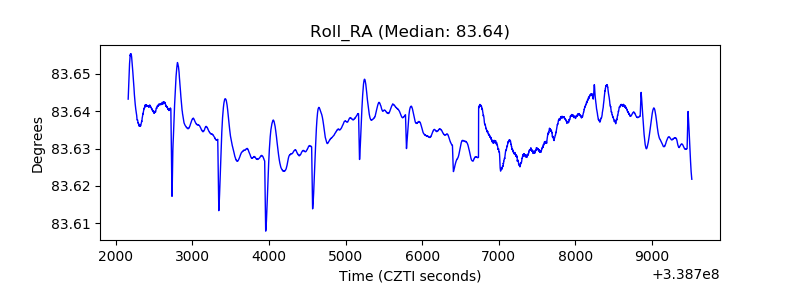 |
| Veto Counter | 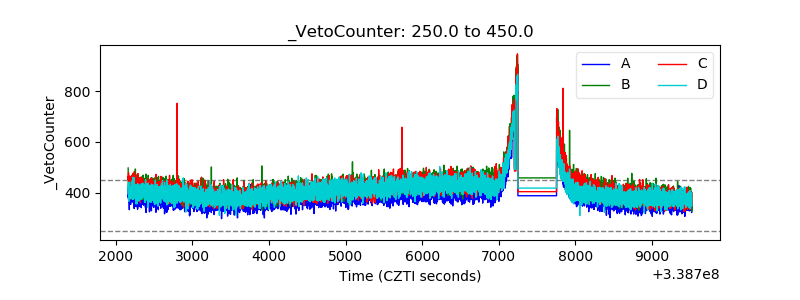 |