| Param | Original file | Final file |
|---|---|---|
| Filename | modeM0/AS1A09_145T01_9000003900_27000cztM0_level2.evt | modeM0/AS1A09_145T01_9000003900_27000cztM0_level2_quad_clean.evt |
| Size (bytes) | 649,039,680 | 100,365,120 |
| Size | 619.0 MB | 95.7 MB |
| Events in quadrant A | 8,485,733 | 576,470 |
| Events in quadrant B | 3,392,667 | 684,749 |
| Events in quadrant C | 3,398,636 | 659,045 |
| Events in quadrant D | 3,910,241 | 636,423 |
| Mode M0 | |||
|---|---|---|---|
| Quadrant | BADHDUFLAG | Total packets | Discarded packets |
| A | 0 | 29857 | 0 |
| B | 0 | 14321 | 0 |
| C | 0 | 14362 | 0 |
| D | 0 | 16313 | 0 |
| Mode M9 | |||
|---|---|---|---|
| Quadrant | BADHDUFLAG | Total packets | Discarded packets |
| A | 0 | 1 | 0 |
| B | 0 | 1 | 0 |
| C | 0 | 1 | 0 |
| D | 0 | 1 | 0 |
| Quadrant | Total seconds | Saturated seconds | Saturation percentage |
|---|---|---|---|
| A | 6919 | 1990 | 28.761382% |
| B | 6920 | 197 | 2.846821% |
| C | 6920 | 201 | 2.904624% |
| D | 6920 | 201 | 2.904624% |
Noise dominated data is calculated using 1-second bins in cleaned event files. If a bin has >2000 counts, and if more than 50% of those come from <1% of pixels, then it is considered to be noise-dominated and hence unusable.
| Quadrant | # 1 sec bins | Bins with >0 counts | Bins with >2000 counts | High rate bins dominated by noise | Noise dominated (total time) | Noise dominated (detector-on time) | Marked lightcurve |
|---|---|---|---|---|---|---|---|
| A | 7069 | 6919 | 1592 | 1592 | 22.52% | 23.01% | 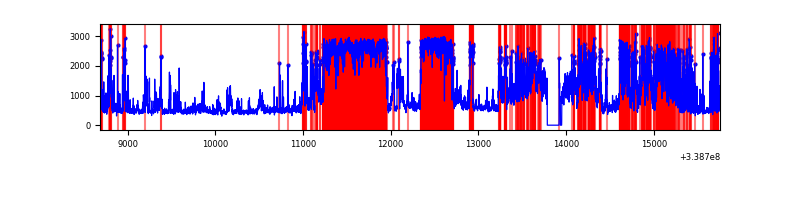 |
| B | 7070 | 6921 | 0 | 0 | 0.00% | 0.00% | 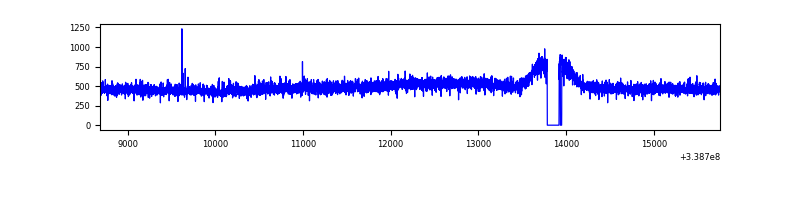 |
| C | 7070 | 6920 | 0 | 0 | 0.00% | 0.00% | 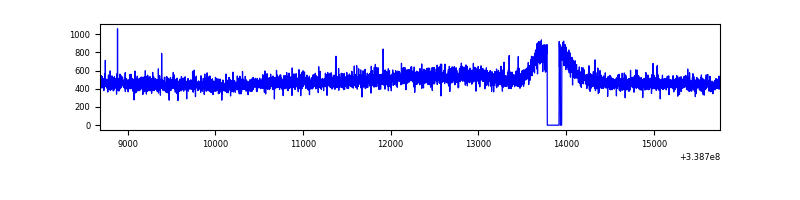 |
| D | 7070 | 6920 | 62 | 62 | 0.88% | 0.90% | 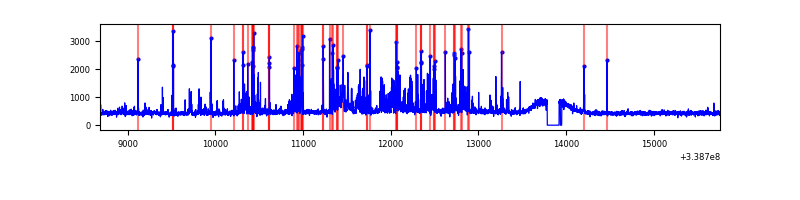 |
Top three noisy pixels from each quadrant. If the there are fewer than three noisy pixels in the level2.evt file, extra rows are filled as -1
| Pixel properties | Quadrant properties | ||||||
|---|---|---|---|---|---|---|---|
| Quadrant | DetID | PixID | Counts | Sigma | Mean | Median | Sigma |
| A | 6 | 16 | 4436045 | 28874.81 | 747 | 732 | 153.6 |
| A | 14 | 235 | 1146991 | 7462.39 | 747 | 732 | 153.6 |
| A | 12 | 16 | 11914 | 72.8 | 747 | 732 | 153.6 |
| B | 12 | 111 | 20470 | 117.12 | 864 | 844 | 167.6 |
| B | 11 | 111 | 18102 | 102.99 | 864 | 844 | 167.6 |
| B | 14 | 111 | 16389 | 92.76 | 864 | 844 | 167.6 |
| C | 14 | 238 | 135252 | 684.52 | 835 | 840 | 196.4 |
| C | 13 | 61 | 5810 | 25.31 | 835 | 840 | 196.4 |
| C | 5 | 218 | 4283 | 17.53 | 835 | 840 | 196.4 |
| D | 5 | 222 | 347106 | 1707.58 | 843 | 818 | 202.8 |
| D | 2 | 250 | 132140 | 647.56 | 843 | 818 | 202.8 |
| D | 12 | 233 | 101947 | 498.68 | 843 | 818 | 202.8 |
Histogram calculated using DETX and DETY for each event in the final _common_clean file
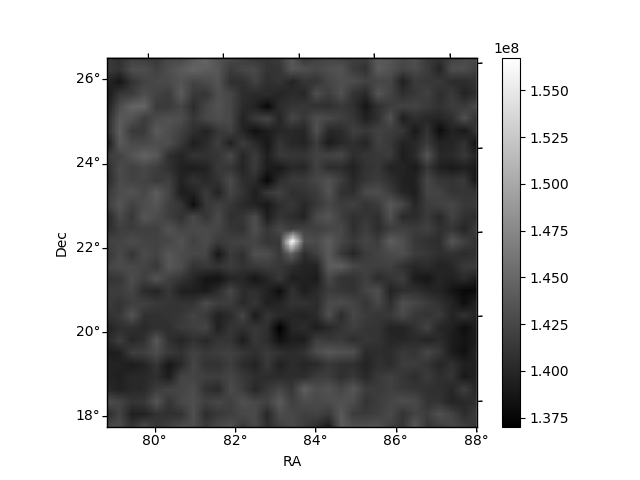
| Quadrant A |  |
 |
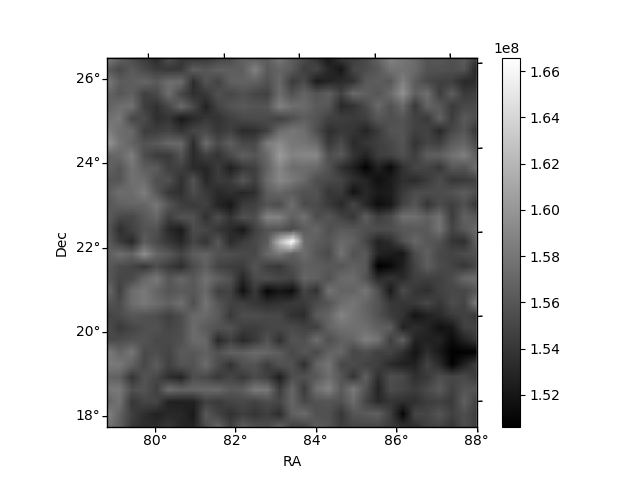
Quadrant B |
|---|---|---|---|
| Quadrant D |  |
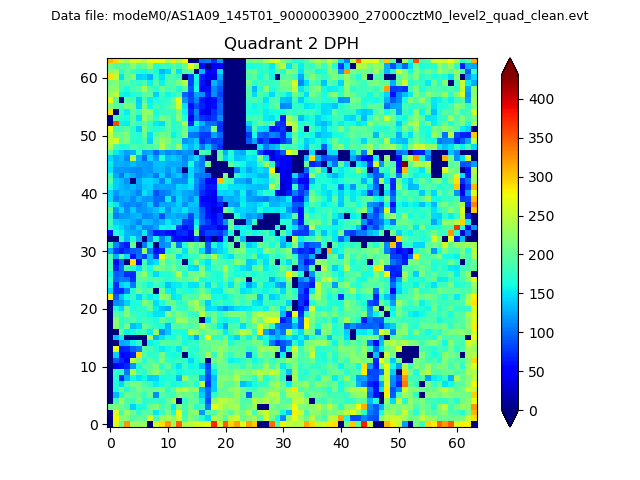 |
Quadrant C |
| Plot type | Count rate plots | Images |
|---|---|---|
| Comparison with Poisson distribution Blue bars denote a histogram of data divided into 1 sec bins. Red curve is a Poisson curve with rate = median count rate of data. |
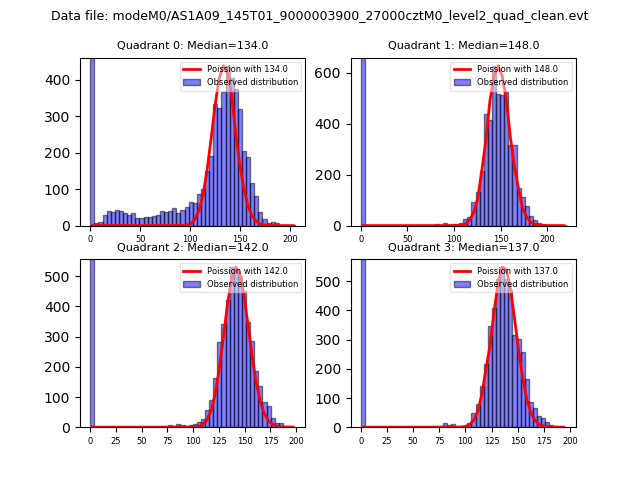 |
 |
| Quadrant-wise count rates Data is divided into 100 sec bins |
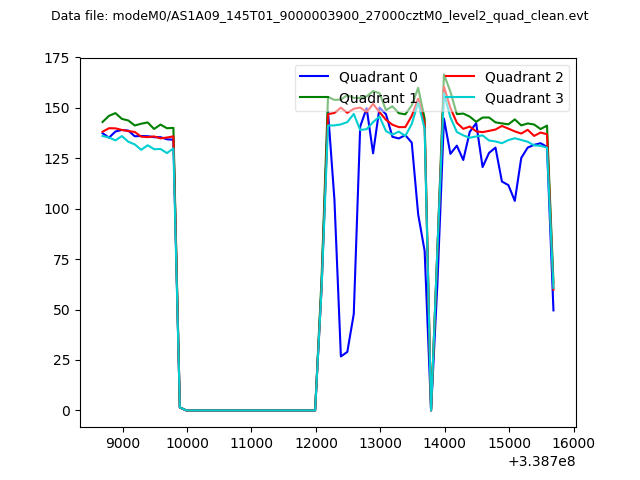 |
|
| Module-wise count rates for Quadrant A Data is divided into 100 sec bins |
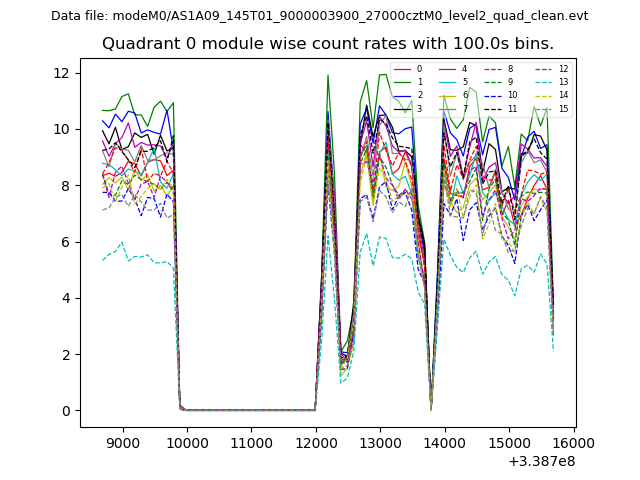 |
 |
| Module-wise count rates for Quadrant B Data is divided into 100 sec bins |
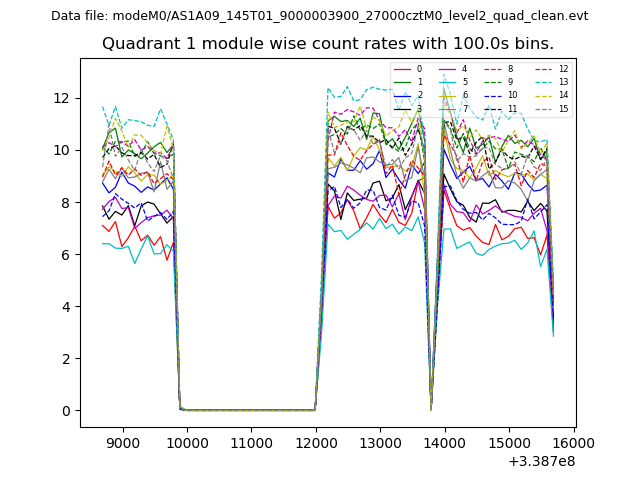 |
 |
| Module-wise count rates for Quadrant C Data is divided into 100 sec bins |
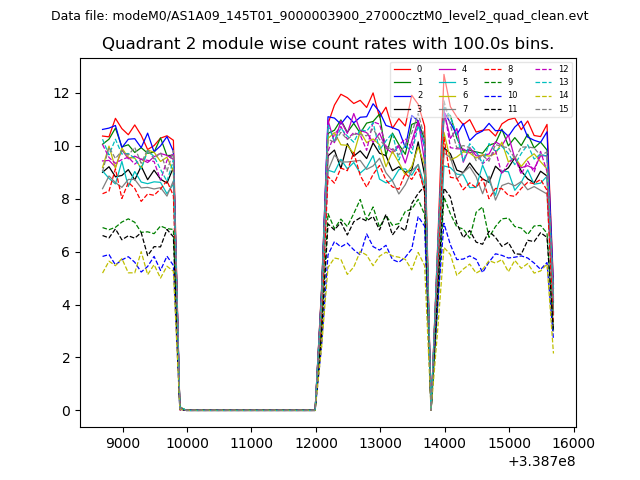 |
 |
| Module-wise count rates for Quadrant D Data is divided into 100 sec bins |
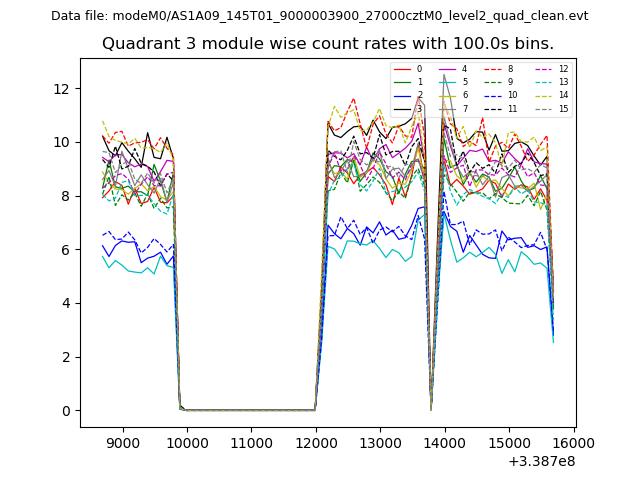 |
 |
| Parameter | Plot |
|---|---|
| CZT HV Monitor | 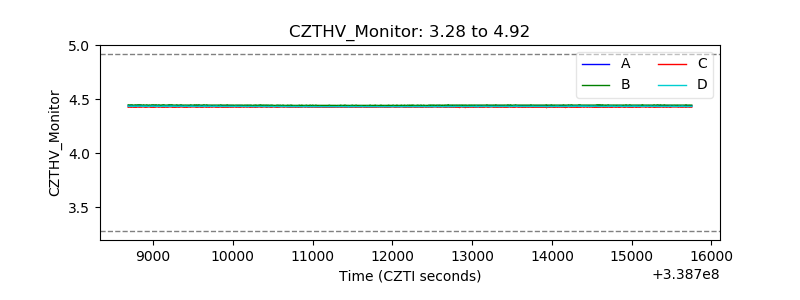 |
| D_VDD | 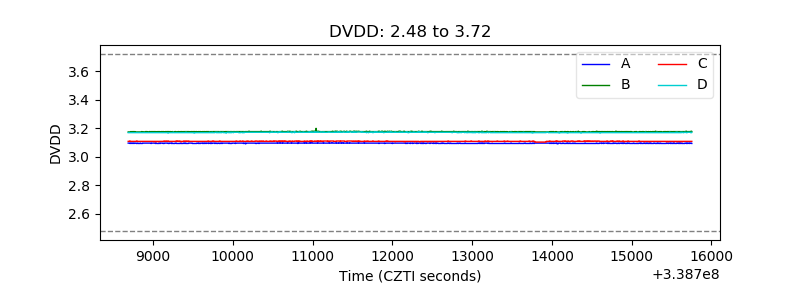 |
| Temperature 1 | 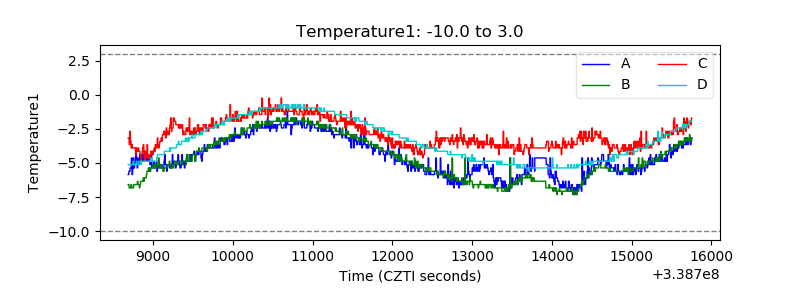 |
| Veto HV Monitor | 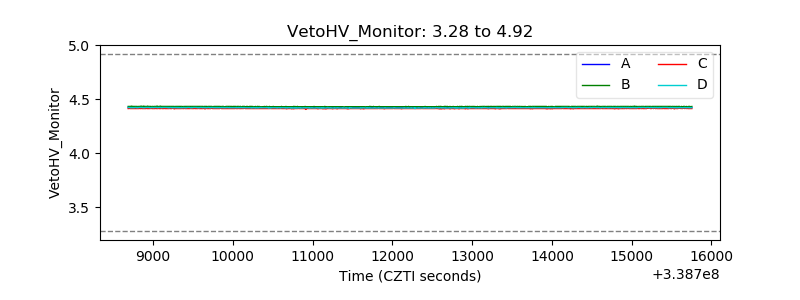 |
| Veto LLD | 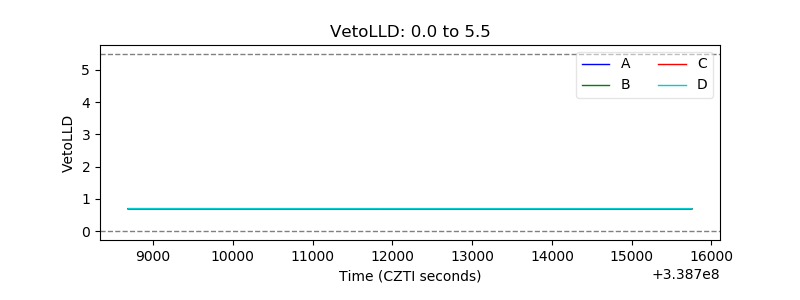 |
| Alpha Counter | 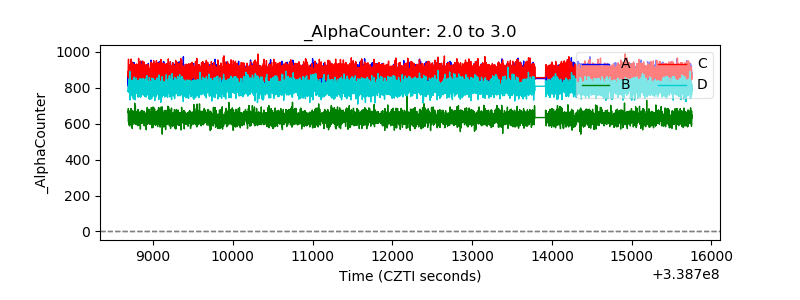 |
| _CPM_Rate | 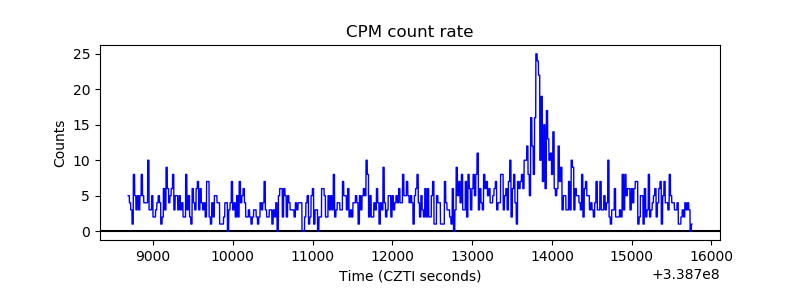 |
| CZT Counter | 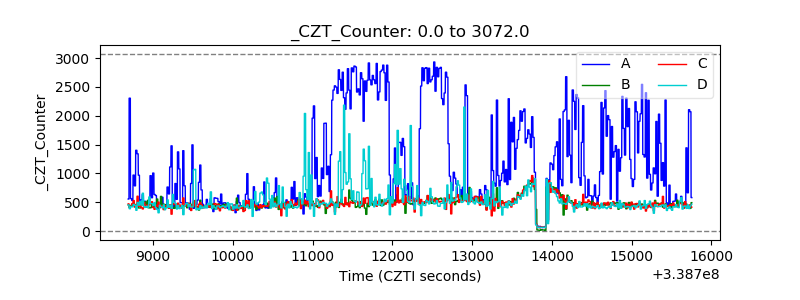 |
| +2.5 Volts monitor |  |
| +5 Volts monitor | 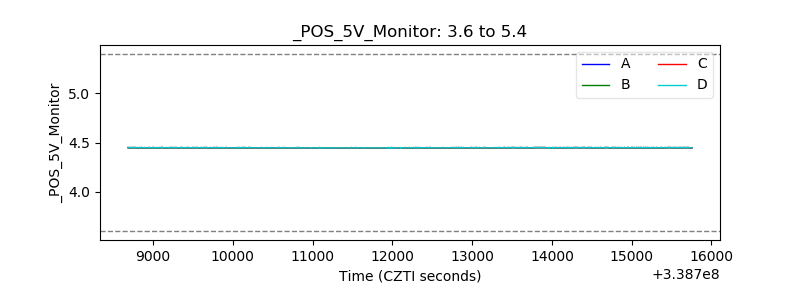 |
| _ROLL_ROT | 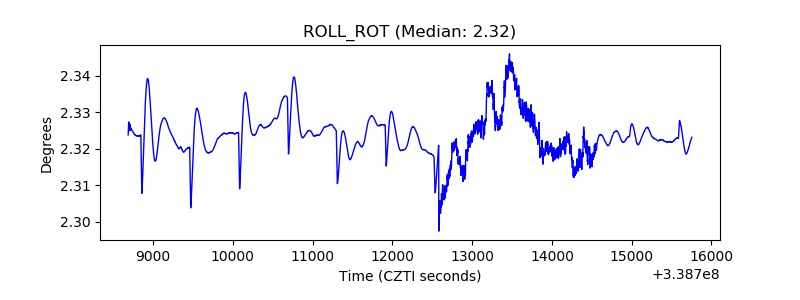 |
| _Roll_DEC | 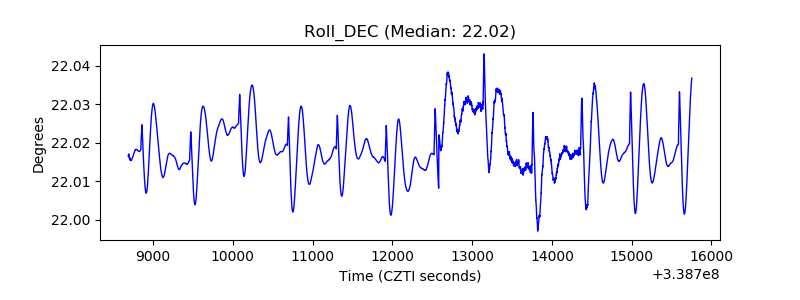 |
| _Roll_RA | 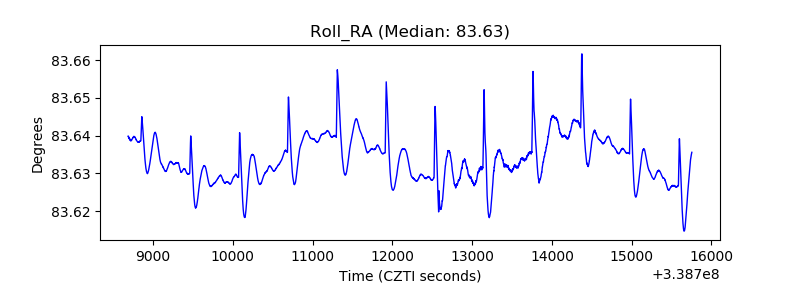 |
| Veto Counter | 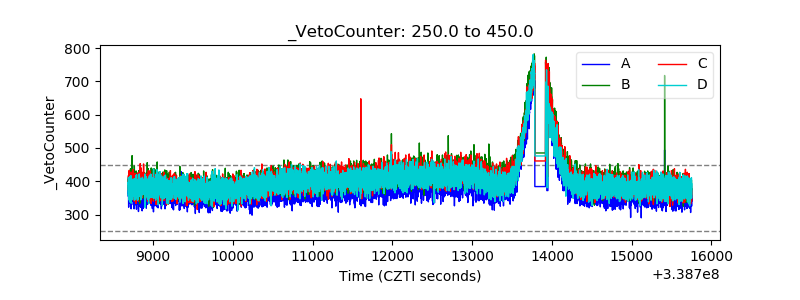 |