| Param | Original file | Final file |
|---|---|---|
| Filename | modeM0/AS1A09_145T01_9000003900_27004cztM0_level2.evt | modeM0/AS1A09_145T01_9000003900_27004cztM0_level2_quad_clean.evt |
| Size (bytes) | 1,725,246,720 | 208,592,640 |
| Size | 1.6 GB | 198.9 MB |
| Events in quadrant A | 20,540,704 | 1,141,463 |
| Events in quadrant B | 8,911,790 | 1,376,442 |
| Events in quadrant C | 8,583,732 | 1,319,227 |
| Events in quadrant D | 13,032,872 | 1,271,108 |
| Mode M0 | |||
|---|---|---|---|
| Quadrant | BADHDUFLAG | Total packets | Discarded packets |
| A | 0 | 72951 | 0 |
| B | 0 | 36883 | 0 |
| C | 0 | 35847 | 0 |
| D | 0 | 50308 | 0 |
| Mode M9 | |||
|---|---|---|---|
| Quadrant | BADHDUFLAG | Total packets | Discarded packets |
| A | 0 | 19 | 0 |
| B | 0 | 19 | 0 |
| C | 0 | 19 | 0 |
| D | 0 | 19 | 0 |
| Quadrant | Total seconds | Saturated seconds | Saturation percentage |
|---|---|---|---|
| A | 17521 | 4342 | 24.781691% |
| B | 17522 | 217 | 1.238443% |
| C | 17522 | 231 | 1.318343% |
| D | 17522 | 1227 | 7.002625% |
Noise dominated data is calculated using 1-second bins in cleaned event files. If a bin has >2000 counts, and if more than 50% of those come from <1% of pixels, then it is considered to be noise-dominated and hence unusable.
| Quadrant | # 1 sec bins | Bins with >0 counts | Bins with >2000 counts | High rate bins dominated by noise | Noise dominated (total time) | Noise dominated (detector-on time) | Marked lightcurve |
|---|---|---|---|---|---|---|---|
| A | 19441 | 17521 | 3229 | 3229 | 16.61% | 18.43% | 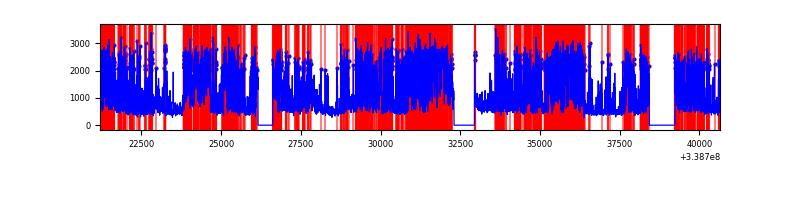 |
| B | 19442 | 17522 | 26 | 26 | 0.13% | 0.15% | 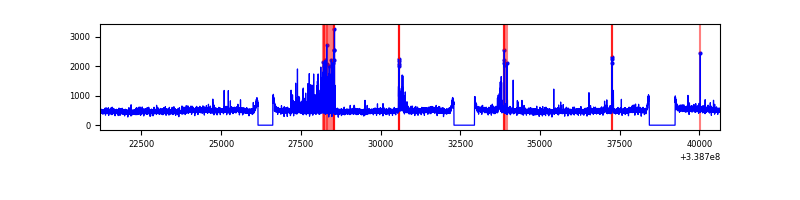 |
| C | 19442 | 17522 | 0 | 0 | 0.00% | 0.00% | 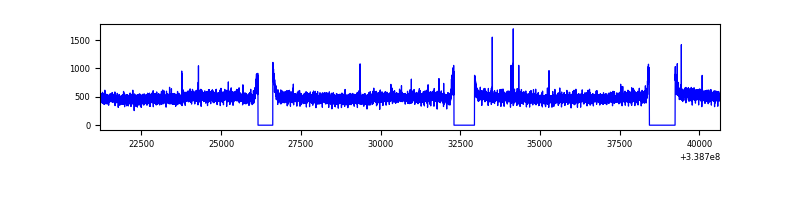 |
| D | 19442 | 17522 | 1050 | 1050 | 5.40% | 5.99% | 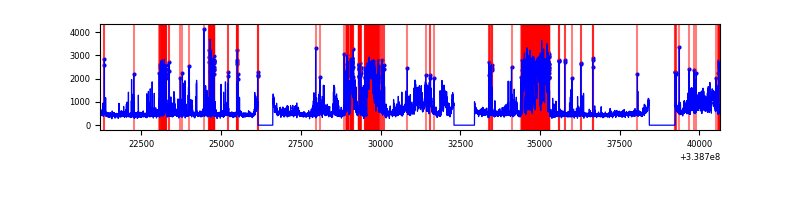 |
Top three noisy pixels from each quadrant. If the there are fewer than three noisy pixels in the level2.evt file, extra rows are filled as -1
| Pixel properties | Quadrant properties | ||||||
|---|---|---|---|---|---|---|---|
| Quadrant | DetID | PixID | Counts | Sigma | Mean | Median | Sigma |
| A | 14 | 235 | 9351476 | 23449.39 | 1982 | 1947 | 398.7 |
| A | 6 | 16 | 2687635 | 6735.93 | 1982 | 1947 | 398.7 |
| A | 12 | 16 | 704360 | 1761.71 | 1982 | 1947 | 398.7 |
| B | 0 | 189 | 194437 | 458.73 | 2182 | 2128 | 419.2 |
| B | 3 | 64 | 131697 | 309.07 | 2182 | 2128 | 419.2 |
| B | 12 | 111 | 51289 | 117.27 | 2182 | 2128 | 419.2 |
| C | 14 | 238 | 335059 | 669.88 | 2111 | 2131 | 497.0 |
| C | 15 | 208 | 22122 | 40.22 | 2111 | 2131 | 497.0 |
| C | 13 | 61 | 14525 | 24.94 | 2111 | 2131 | 497.0 |
| D | 11 | 176 | 2614272 | 5270.29 | 2074 | 2020 | 495.7 |
| D | 12 | 233 | 1320039 | 2659.14 | 2074 | 2020 | 495.7 |
| D | 2 | 250 | 675909 | 1359.59 | 2074 | 2020 | 495.7 |
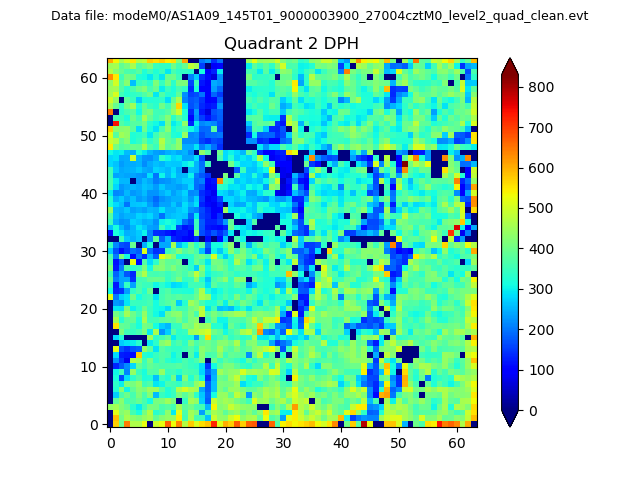
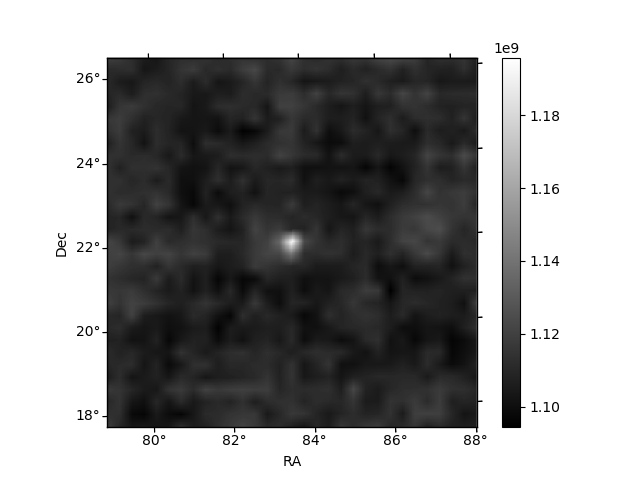
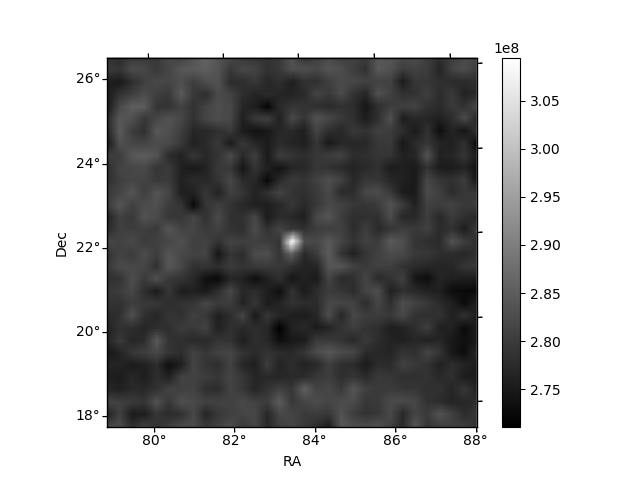
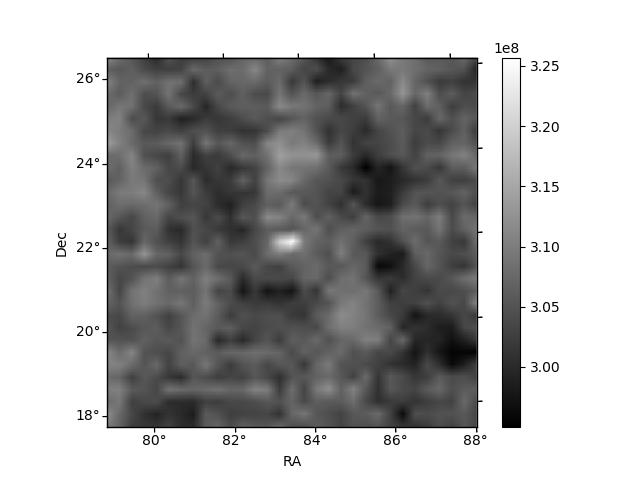
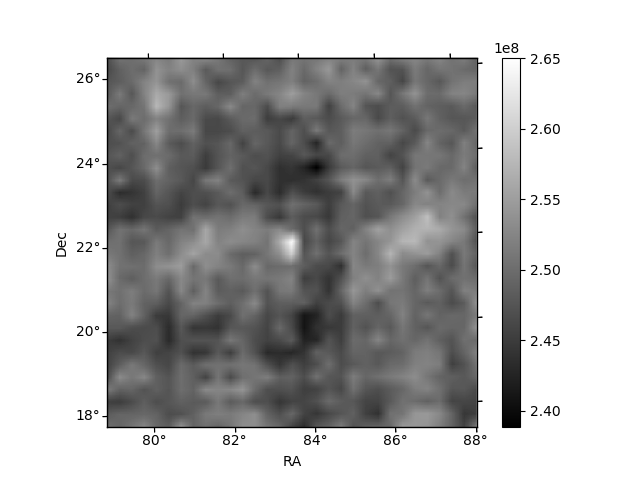
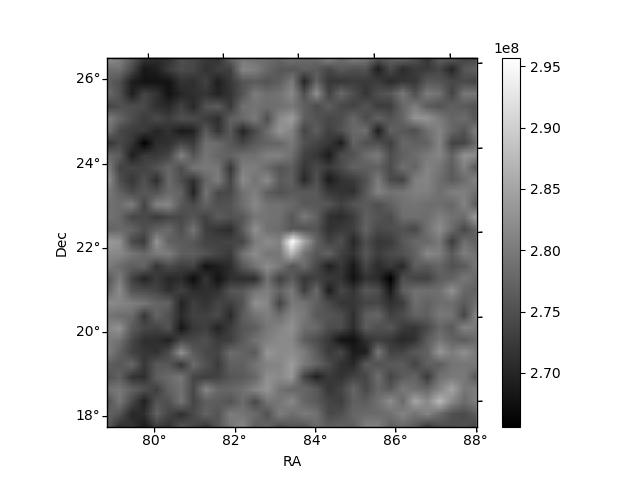
Histogram calculated using DETX and DETY for each event in the final _common_clean file
| Quadrant A | 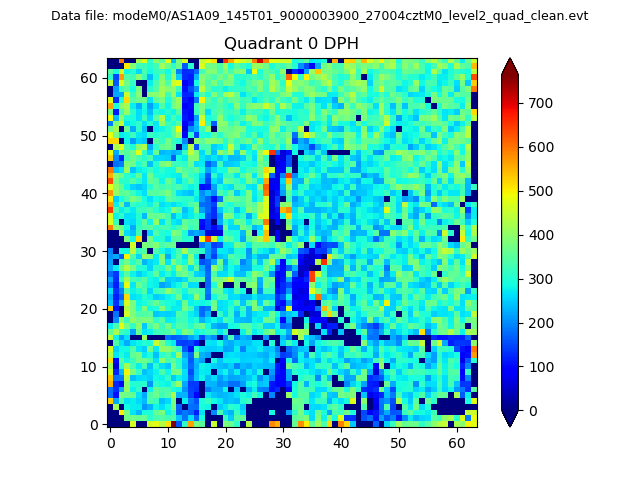 |
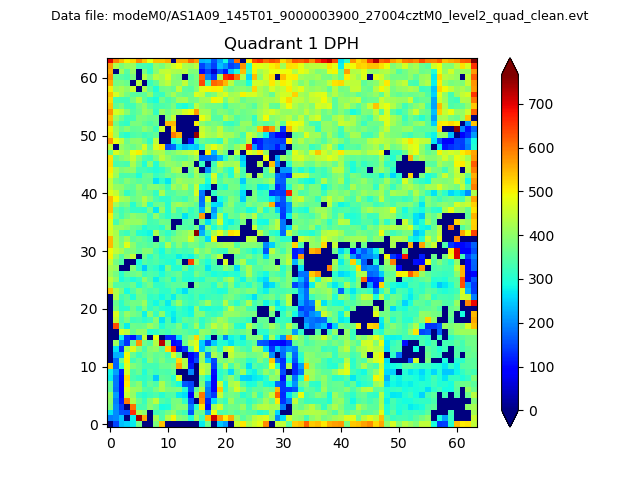 |
Quadrant B |
|---|---|---|---|
| Quadrant D | 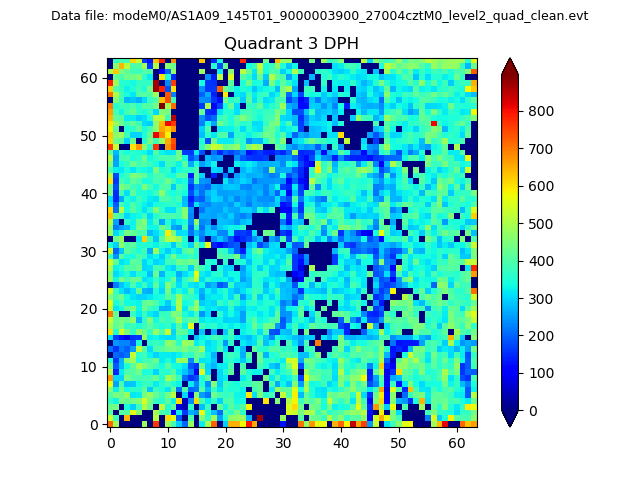 |
 |
Quadrant C |
| Plot type | Count rate plots | Images |
|---|---|---|
| Comparison with Poisson distribution Blue bars denote a histogram of data divided into 1 sec bins. Red curve is a Poisson curve with rate = median count rate of data. |
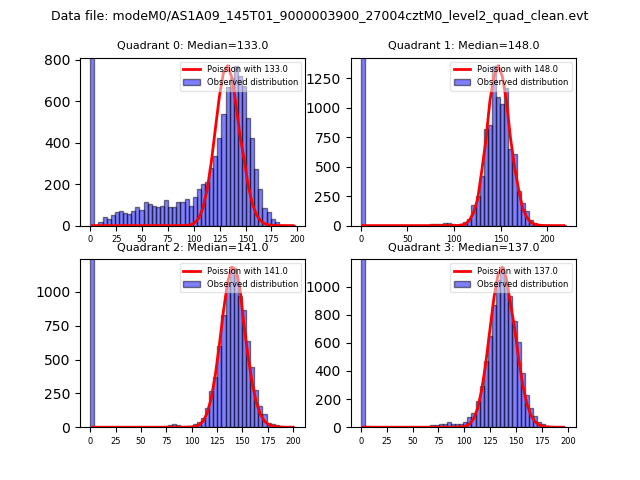 |
 |
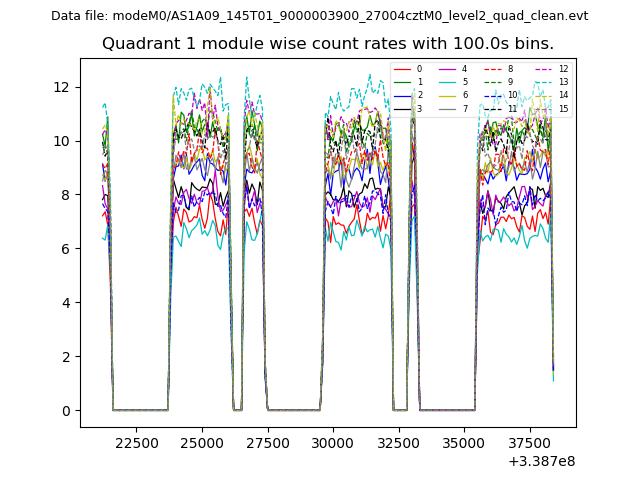
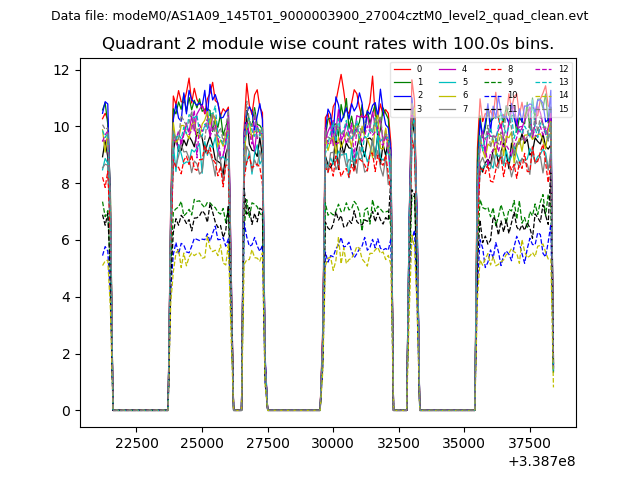
| Quadrant-wise count rates Data is divided into 100 sec bins |
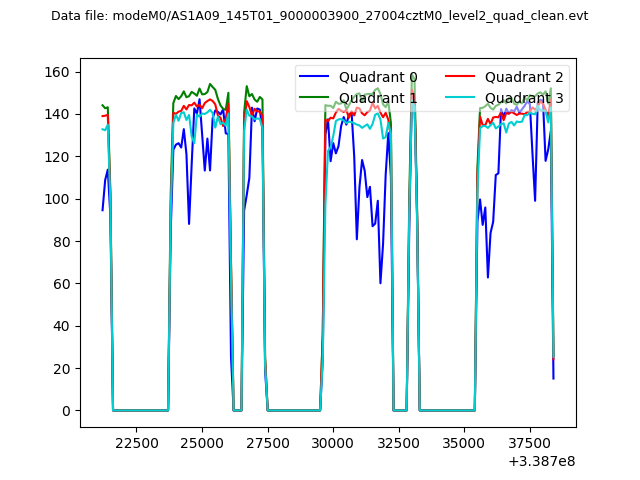 |
|
| Module-wise count rates for Quadrant A Data is divided into 100 sec bins |
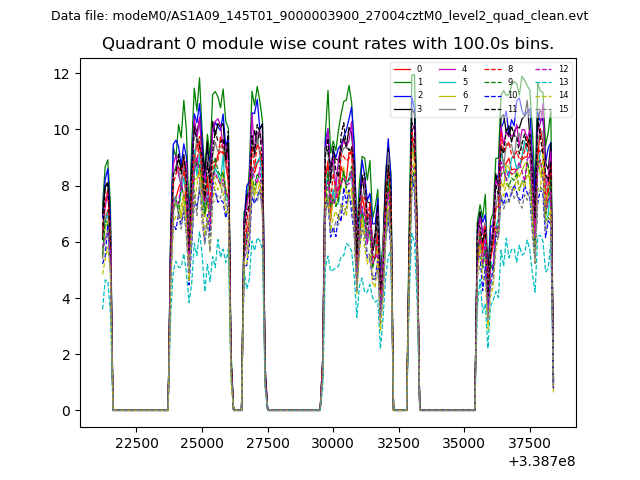 |
 |
| Module-wise count rates for Quadrant B Data is divided into 100 sec bins |
 |
 |
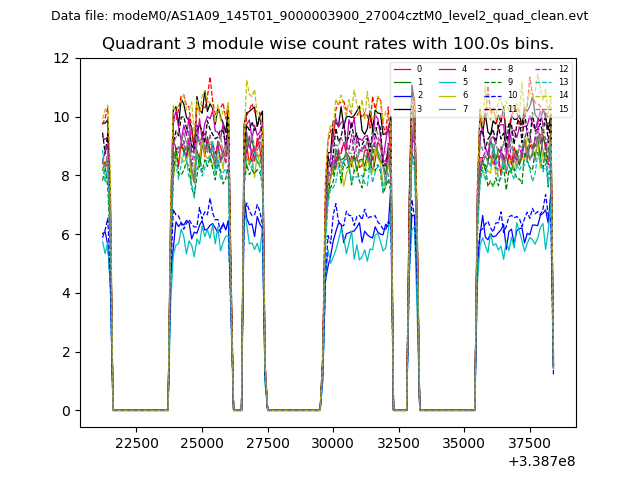
| Module-wise count rates for Quadrant C Data is divided into 100 sec bins |
 |
 |
| Module-wise count rates for Quadrant D Data is divided into 100 sec bins |
 |
 |
| Parameter | Plot |
|---|---|
| CZT HV Monitor | 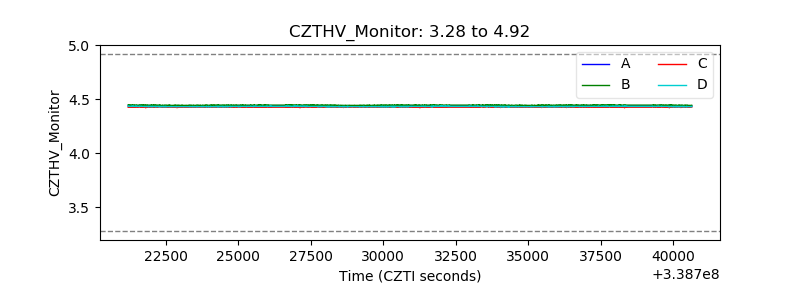 |
| D_VDD |  |
| Temperature 1 | 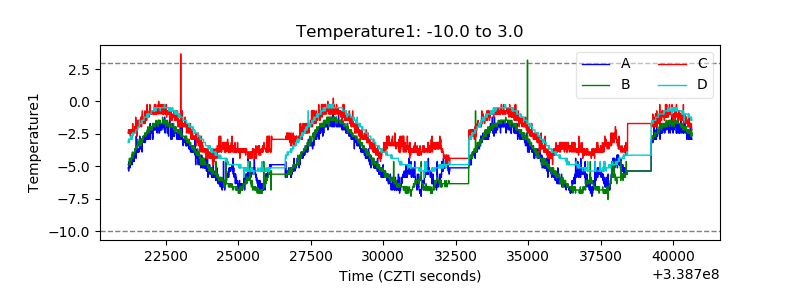 |
| Veto HV Monitor | 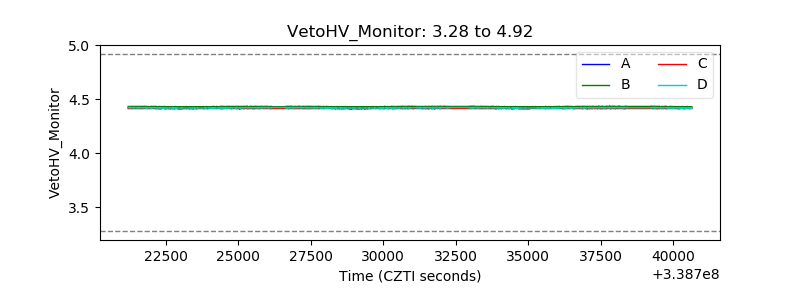 |
| Veto LLD | 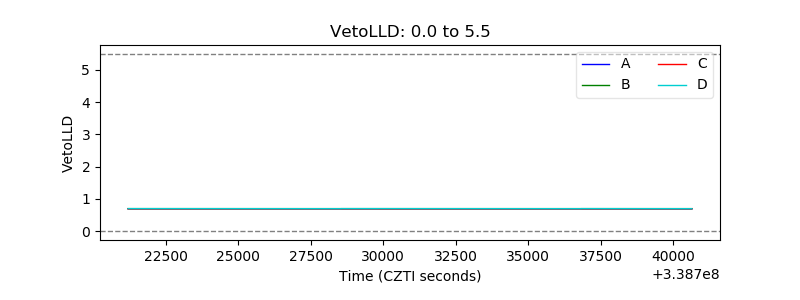 |
| Alpha Counter | 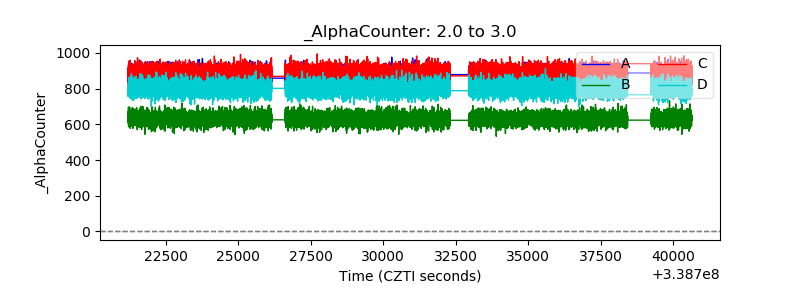 |
| _CPM_Rate | 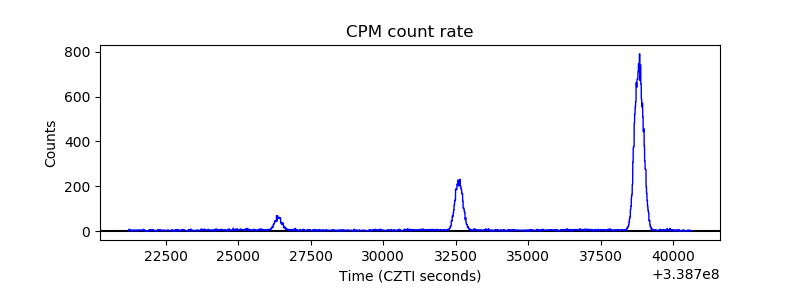 |
| CZT Counter | 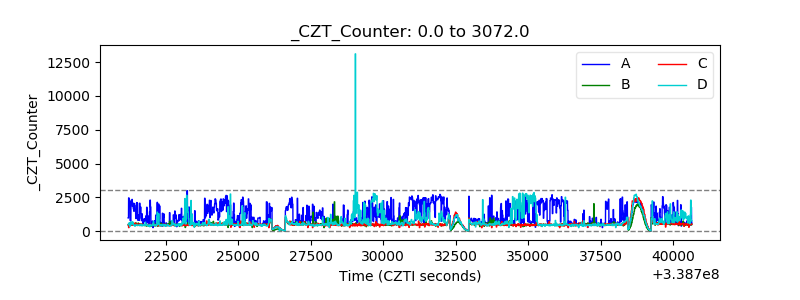 |
| +2.5 Volts monitor |  |
| +5 Volts monitor |  |
| _ROLL_ROT | 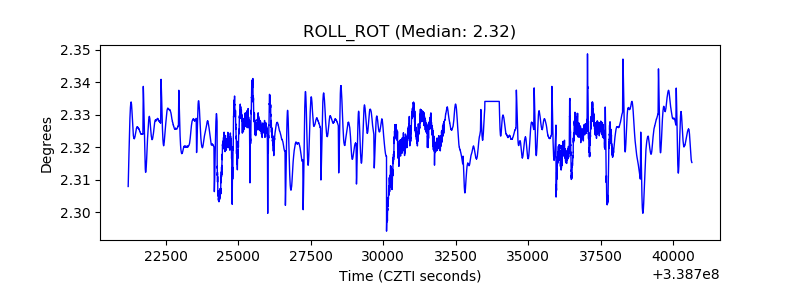 |
| _Roll_DEC | 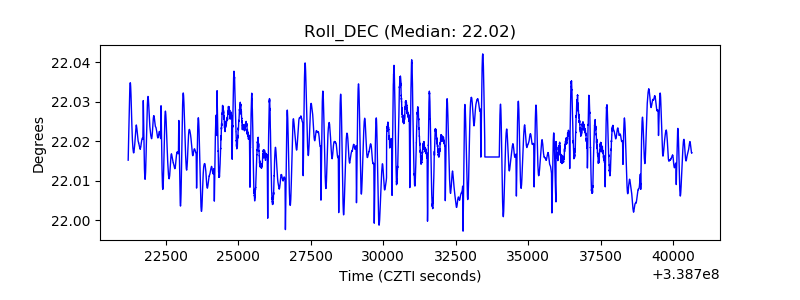 |
| _Roll_RA | 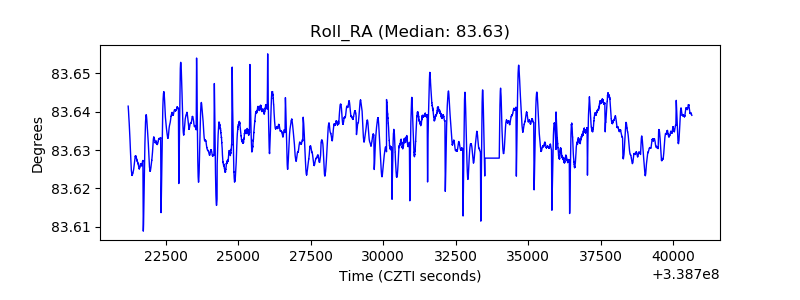 |
| Veto Counter | 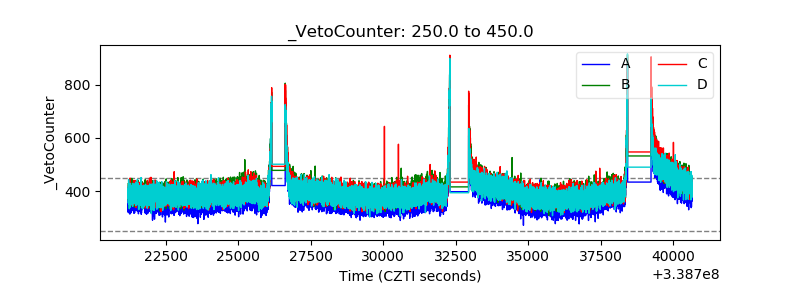 |