| Param | Original file | Final file |
|---|---|---|
| Filename | modeM0/AS1A09_145T01_9000003900_27005cztM0_level2.evt | modeM0/AS1A09_145T01_9000003900_27005cztM0_level2_quad_clean.evt |
| Size (bytes) | 696,720,960 | 70,274,880 |
| Size | 664.4 MB | 67.0 MB |
| Events in quadrant A | 9,284,399 | 320,129 |
| Events in quadrant B | 3,699,078 | 464,745 |
| Events in quadrant C | 3,437,695 | 448,684 |
| Events in quadrant D | 4,231,711 | 432,327 |
| Mode M0 | |||
|---|---|---|---|
| Quadrant | BADHDUFLAG | Total packets | Discarded packets |
| A | 0 | 32150 | 0 |
| B | 0 | 14990 | 0 |
| C | 0 | 14176 | 0 |
| D | 0 | 16866 | 0 |
| Mode M9 | |||
|---|---|---|---|
| Quadrant | BADHDUFLAG | Total packets | Discarded packets |
| A | 0 | 13 | 0 |
| B | 0 | 14 | 0 |
| C | 0 | 14 | 0 |
| D | 0 | 14 | 0 |
| Quadrant | Total seconds | Saturated seconds | Saturation percentage |
|---|---|---|---|
| A | 6613 | 2291 | 34.643883% |
| B | 6613 | 145 | 2.192651% |
| C | 6613 | 89 | 1.345834% |
| D | 6613 | 139 | 2.101920% |
Noise dominated data is calculated using 1-second bins in cleaned event files. If a bin has >2000 counts, and if more than 50% of those come from <1% of pixels, then it is considered to be noise-dominated and hence unusable.
| Quadrant | # 1 sec bins | Bins with >0 counts | Bins with >2000 counts | High rate bins dominated by noise | Noise dominated (total time) | Noise dominated (detector-on time) | Marked lightcurve |
|---|---|---|---|---|---|---|---|
| A | 7612 | 6612 | 1933 | 1933 | 25.39% | 29.23% | 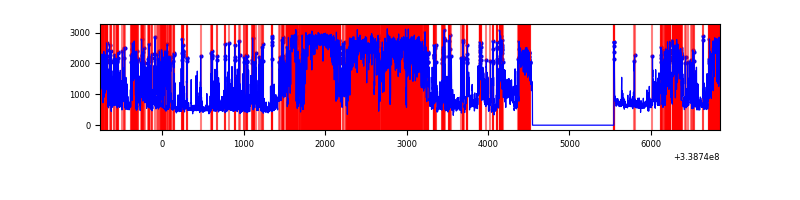 |
| B | 7613 | 6613 | 78 | 78 | 1.02% | 1.18% | 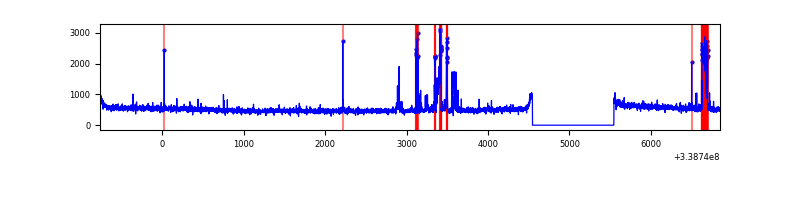 |
| C | 7613 | 6613 | 0 | 0 | 0.00% | 0.00% | 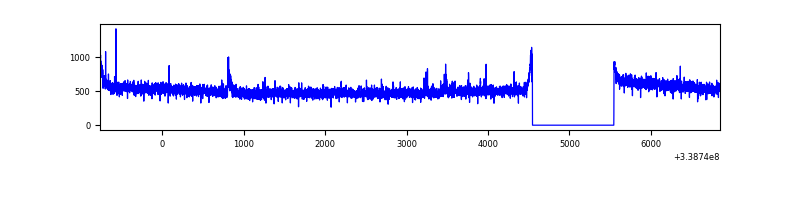 |
| D | 7613 | 6613 | 94 | 94 | 1.23% | 1.42% | 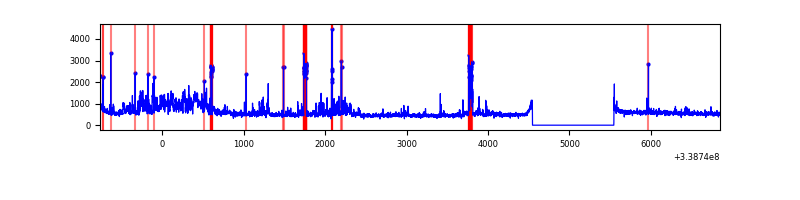 |
Top three noisy pixels from each quadrant. If the there are fewer than three noisy pixels in the level2.evt file, extra rows are filled as -1
| Pixel properties | Quadrant properties | ||||||
|---|---|---|---|---|---|---|---|
| Quadrant | DetID | PixID | Counts | Sigma | Mean | Median | Sigma |
| A | 6 | 16 | 3856554 | 26068.82 | 737 | 723 | 147.9 |
| A | 14 | 235 | 2549131 | 17229.49 | 737 | 723 | 147.9 |
| A | 8 | 192 | 29746 | 196.22 | 737 | 723 | 147.9 |
| B | 15 | 222 | 180875 | 1091.95 | 857 | 835 | 164.9 |
| B | 0 | 189 | 143246 | 863.73 | 857 | 835 | 164.9 |
| B | 12 | 111 | 19509 | 113.26 | 857 | 835 | 164.9 |
| C | 14 | 238 | 134050 | 678.07 | 836 | 842 | 196.5 |
| C | 3 | 233 | 37988 | 189.08 | 836 | 842 | 196.5 |
| C | 14 | 225 | 6767 | 30.16 | 836 | 842 | 196.5 |
| D | 11 | 176 | 668100 | 3337.73 | 835 | 811 | 199.9 |
| D | 1 | 239 | 245843 | 1225.63 | 835 | 811 | 199.9 |
| D | 2 | 250 | 95948 | 475.87 | 835 | 811 | 199.9 |
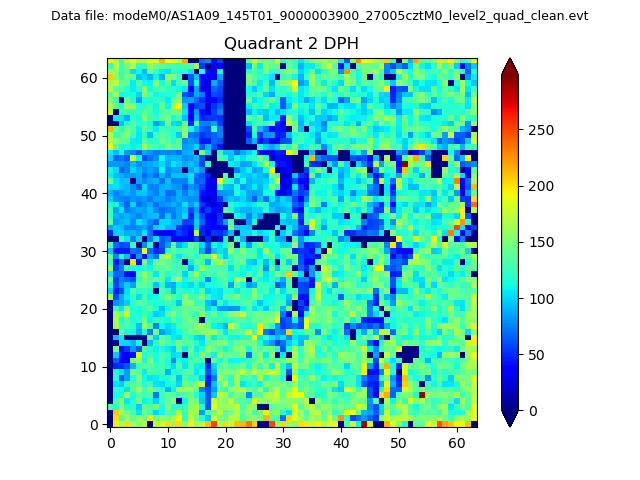
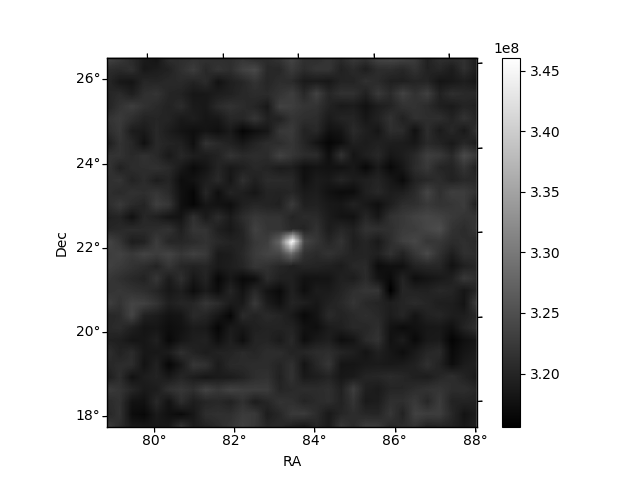
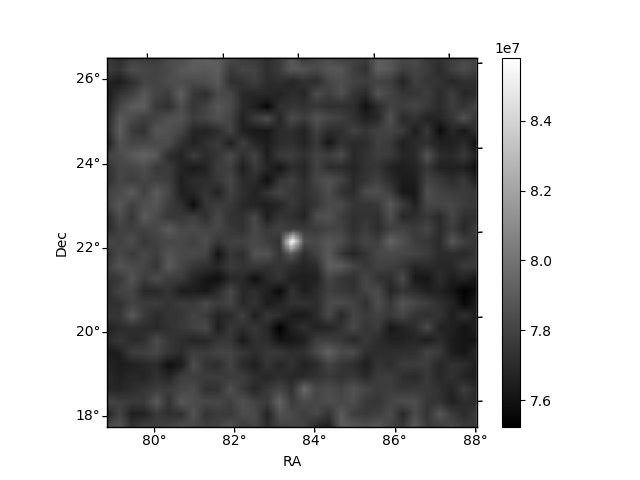
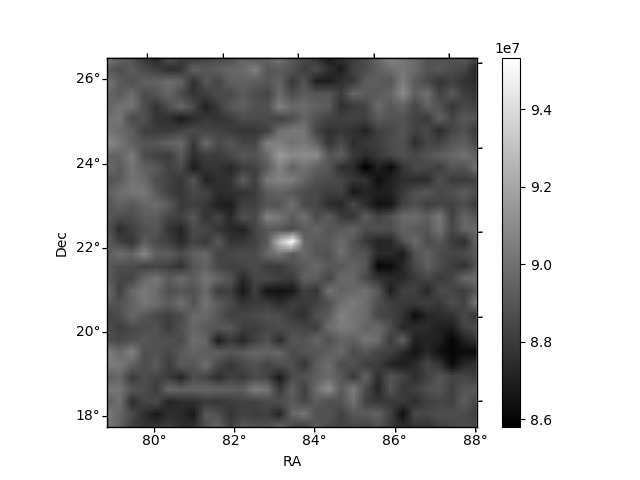
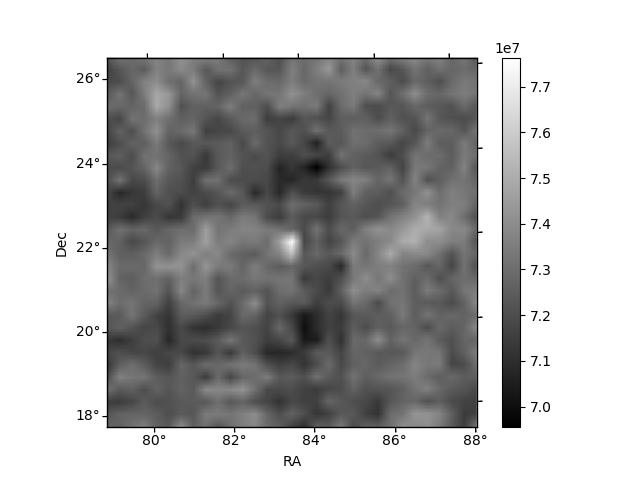
Histogram calculated using DETX and DETY for each event in the final _common_clean file
| Quadrant A | 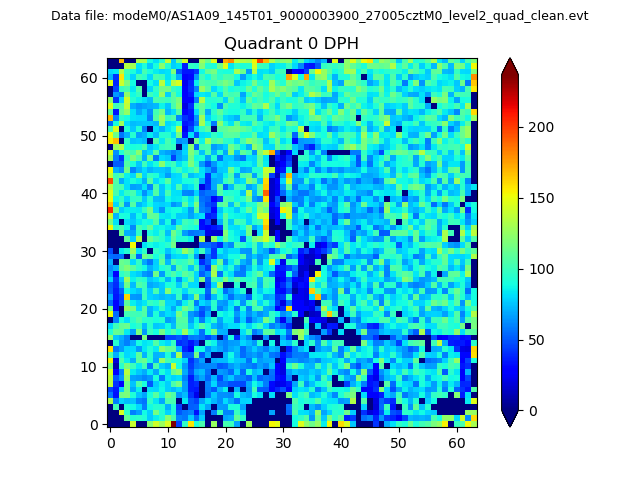 |
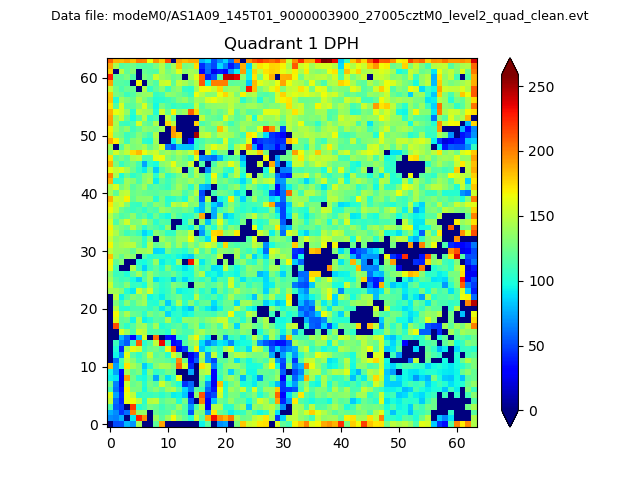 |
Quadrant B |
|---|---|---|---|
| Quadrant D | 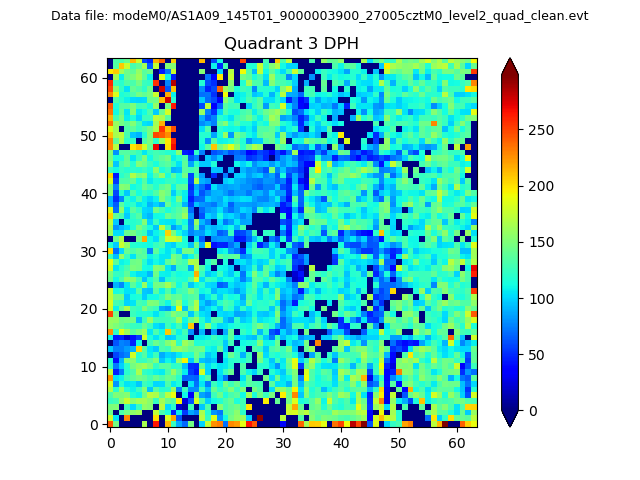 |
 |
Quadrant C |
| Plot type | Count rate plots | Images |
|---|---|---|
| Comparison with Poisson distribution Blue bars denote a histogram of data divided into 1 sec bins. Red curve is a Poisson curve with rate = median count rate of data. |
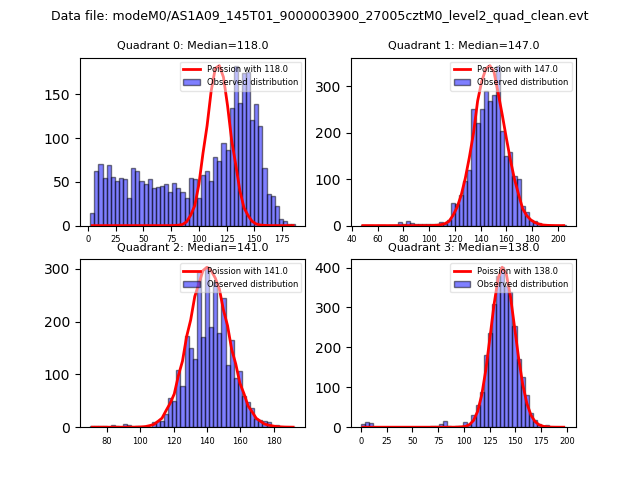 |
 |
| Quadrant-wise count rates Data is divided into 100 sec bins |
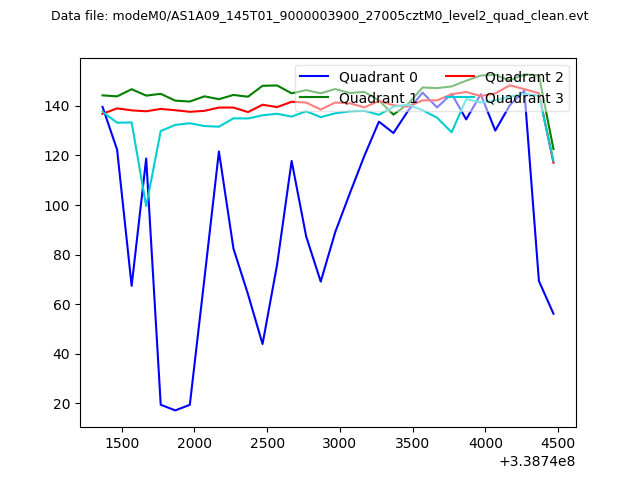 |
|
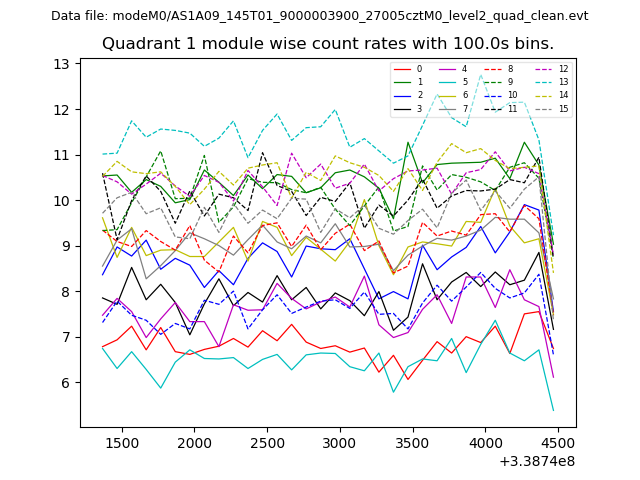
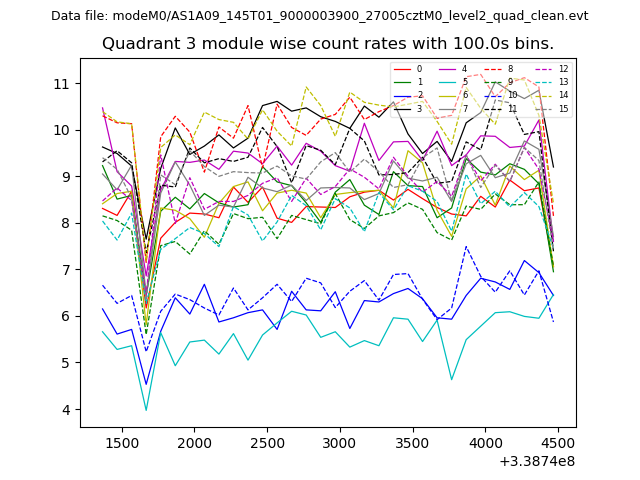
| Module-wise count rates for Quadrant A Data is divided into 100 sec bins |
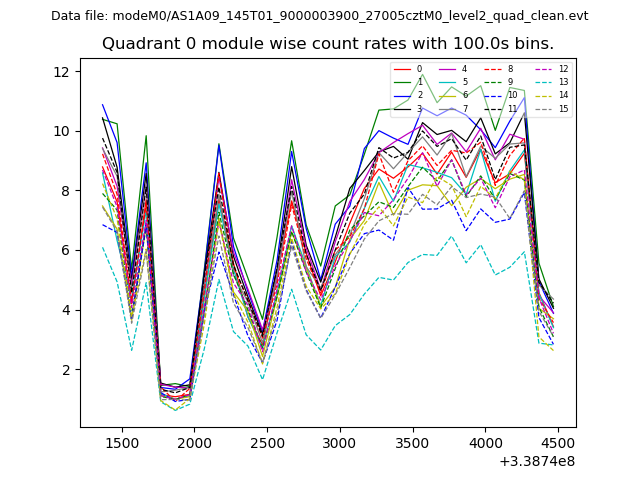 |
 |
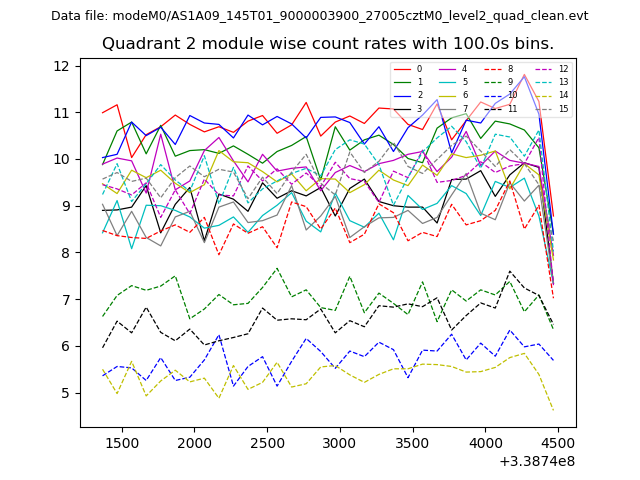
| Module-wise count rates for Quadrant B Data is divided into 100 sec bins |
 |
 |
| Module-wise count rates for Quadrant C Data is divided into 100 sec bins |
 |
 |
| Module-wise count rates for Quadrant D Data is divided into 100 sec bins |
 |
 |
| Parameter | Plot |
|---|---|
| CZT HV Monitor | 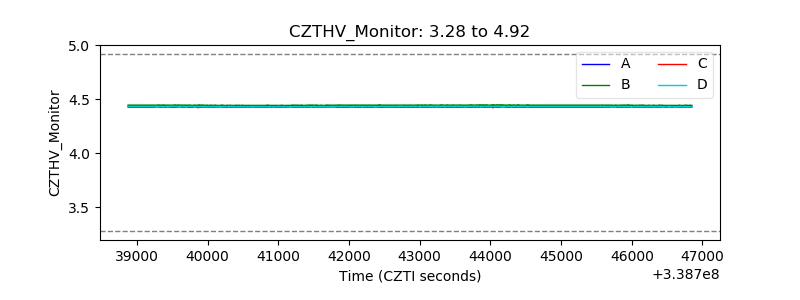 |
| D_VDD | 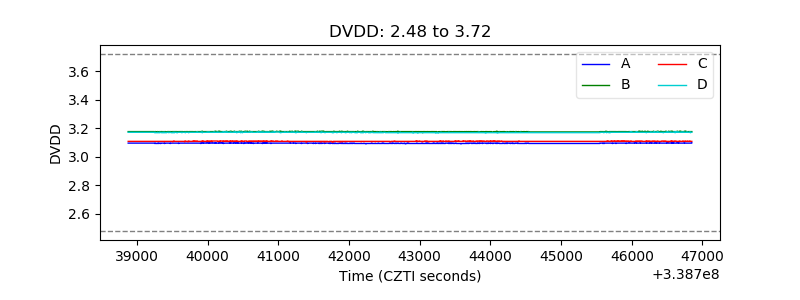 |
| Temperature 1 | 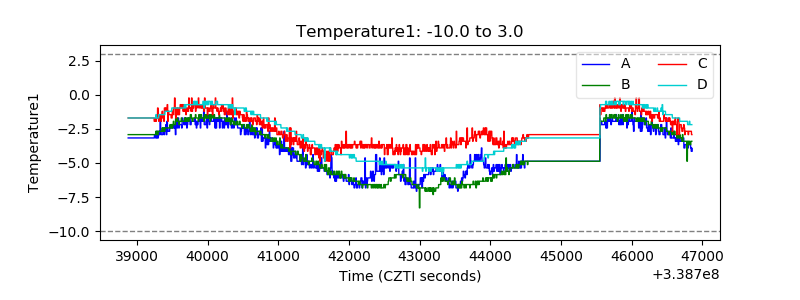 |
| Veto HV Monitor | 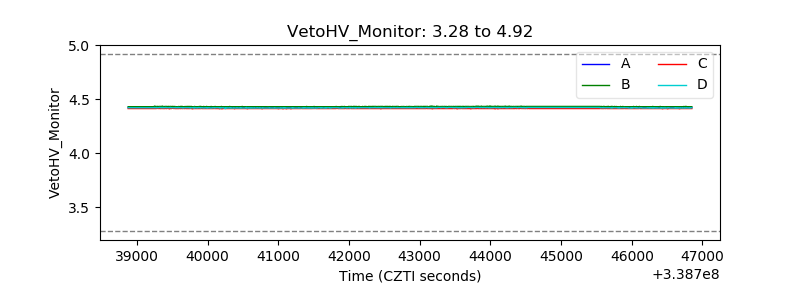 |
| Veto LLD | 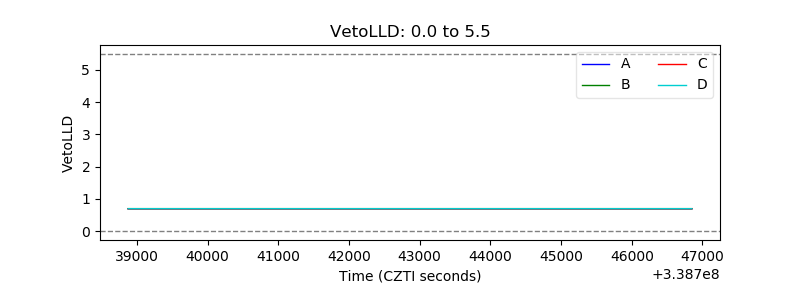 |
| Alpha Counter | 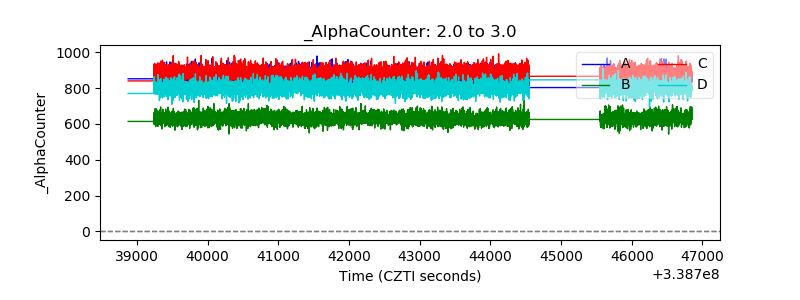 |
| _CPM_Rate | 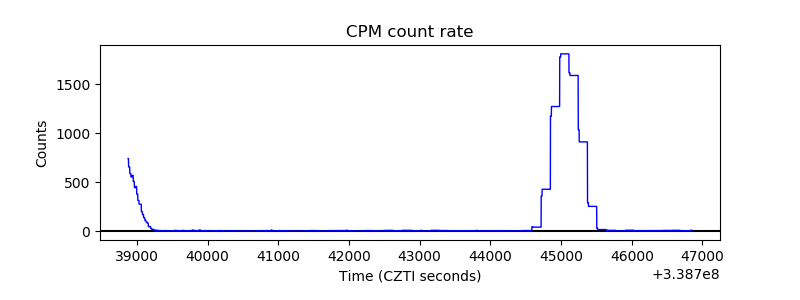 |
| CZT Counter | 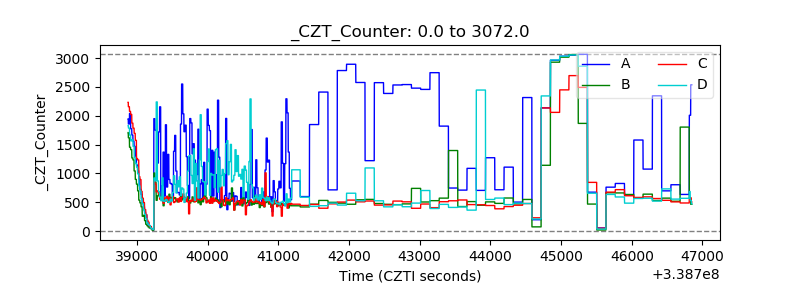 |
| +2.5 Volts monitor |  |
| +5 Volts monitor | 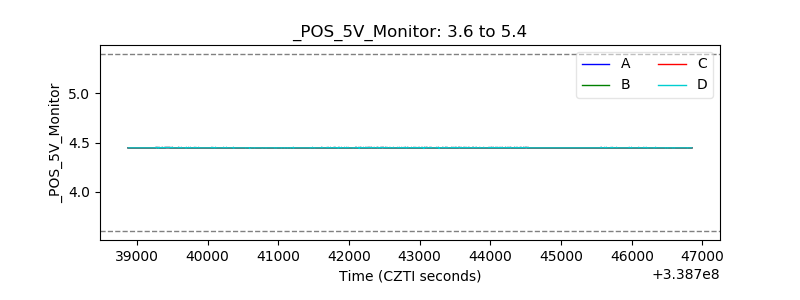 |
| _ROLL_ROT | 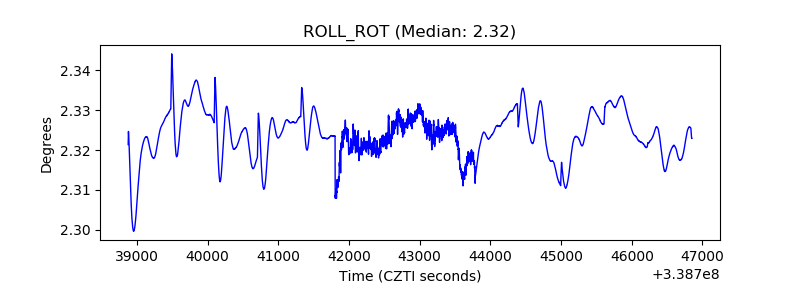 |
| _Roll_DEC | 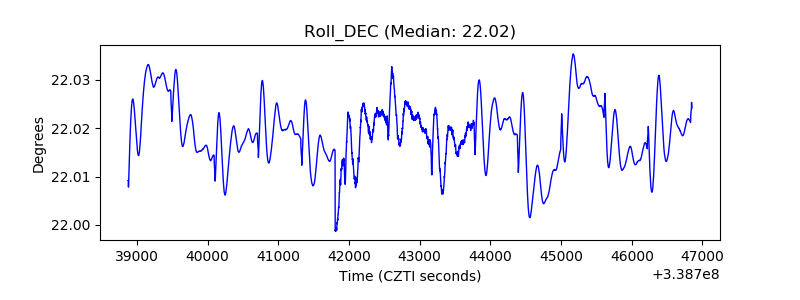 |
| _Roll_RA | 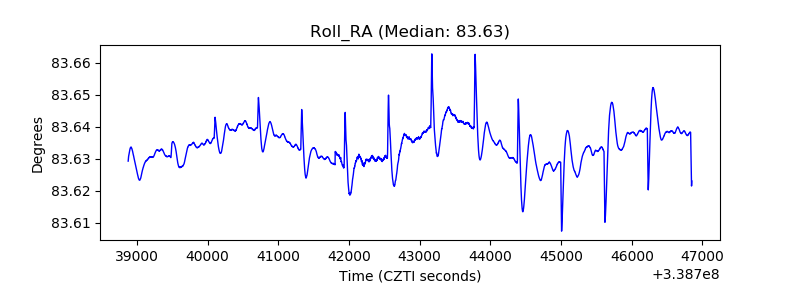 |
| Veto Counter | 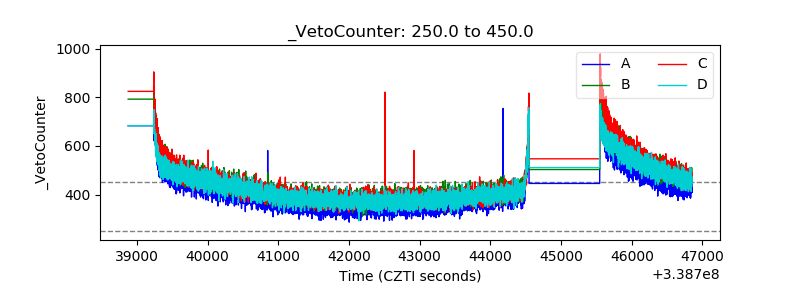 |