| Param | Original file | Final file |
|---|---|---|
| Filename | modeM0/AS1A09_145T01_9000003900_27007cztM0_level2.evt | modeM0/AS1A09_145T01_9000003900_27007cztM0_level2_quad_clean.evt |
| Size (bytes) | 680,042,880 | 79,920,000 |
| Size | 648.5 MB | 76.2 MB |
| Events in quadrant A | 8,098,808 | 437,758 |
| Events in quadrant B | 3,414,152 | 539,506 |
| Events in quadrant C | 3,266,132 | 519,379 |
| Events in quadrant D | 5,399,131 | 492,847 |
| Mode M0 | |||
|---|---|---|---|
| Quadrant | BADHDUFLAG | Total packets | Discarded packets |
| A | 0 | 28439 | 0 |
| B | 0 | 14005 | 0 |
| C | 0 | 13499 | 0 |
| D | 0 | 20032 | 0 |
| Mode M9 | |||
|---|---|---|---|
| Quadrant | BADHDUFLAG | Total packets | Discarded packets |
| A | 0 | 11 | 0 |
| B | 0 | 11 | 0 |
| C | 0 | 11 | 0 |
| D | 0 | 11 | 0 |
| Quadrant | Total seconds | Saturated seconds | Saturation percentage |
|---|---|---|---|
| A | 6157 | 1844 | 29.949651% |
| B | 6157 | 113 | 1.835309% |
| C | 6157 | 98 | 1.591684% |
| D | 6156 | 1104 | 17.933723% |
Noise dominated data is calculated using 1-second bins in cleaned event files. If a bin has >2000 counts, and if more than 50% of those come from <1% of pixels, then it is considered to be noise-dominated and hence unusable.
| Quadrant | # 1 sec bins | Bins with >0 counts | Bins with >2000 counts | High rate bins dominated by noise | Noise dominated (total time) | Noise dominated (detector-on time) | Marked lightcurve |
|---|---|---|---|---|---|---|---|
| A | 7292 | 6157 | 1441 | 1441 | 19.76% | 23.40% | 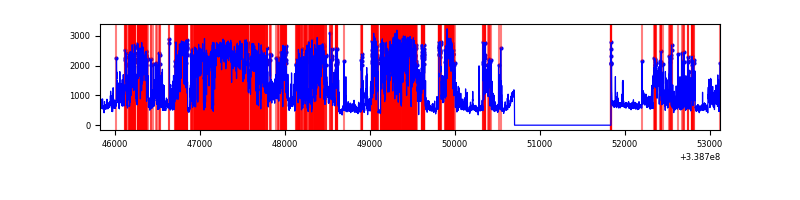 |
| B | 7292 | 6157 | 51 | 51 | 0.70% | 0.83% | 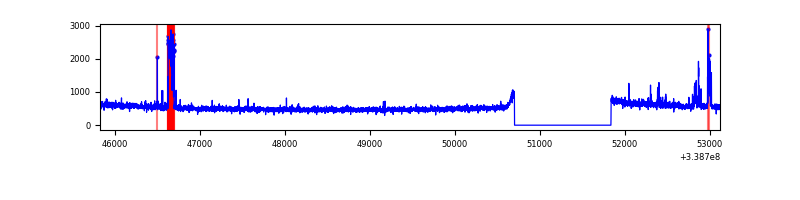 |
| C | 7292 | 6157 | 0 | 0 | 0.00% | 0.00% | 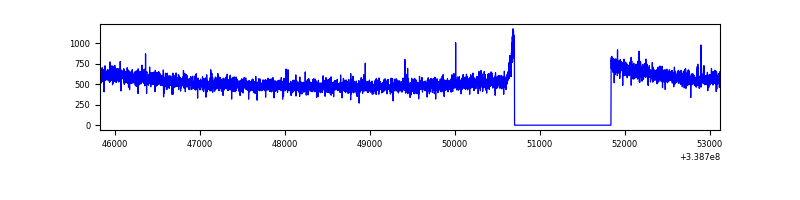 |
| D | 7290 | 6155 | 1027 | 1027 | 14.09% | 16.69% | 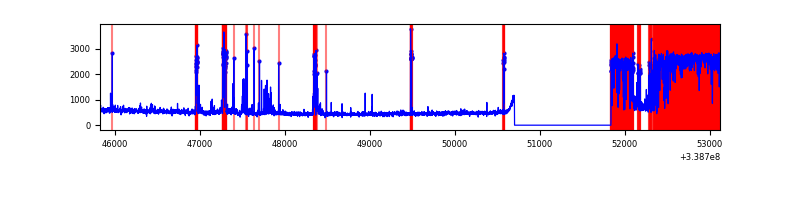 |
Top three noisy pixels from each quadrant. If the there are fewer than three noisy pixels in the level2.evt file, extra rows are filled as -1
| Pixel properties | Quadrant properties | ||||||
|---|---|---|---|---|---|---|---|
| Quadrant | DetID | PixID | Counts | Sigma | Mean | Median | Sigma |
| A | 6 | 16 | 3329171 | 22708.01 | 728 | 715 | 146.6 |
| A | 14 | 235 | 1946342 | 13273.82 | 728 | 715 | 146.6 |
| A | 8 | 192 | 14438 | 93.62 | 728 | 715 | 146.6 |
| B | 0 | 189 | 195807 | 1245.05 | 819 | 802 | 156.6 |
| B | 12 | 111 | 17988 | 109.73 | 819 | 802 | 156.6 |
| B | 11 | 111 | 16328 | 99.13 | 819 | 802 | 156.6 |
| C | 14 | 238 | 131037 | 699.96 | 800 | 810 | 186.0 |
| C | 3 | 233 | 10144 | 50.17 | 800 | 810 | 186.0 |
| C | 15 | 208 | 5794 | 26.79 | 800 | 810 | 186.0 |
| D | 12 | 233 | 2227282 | 13109.18 | 707 | 690 | 169.8 |
| D | 1 | 239 | 283078 | 1662.57 | 707 | 690 | 169.8 |
| D | 11 | 176 | 133673 | 782.94 | 707 | 690 | 169.8 |
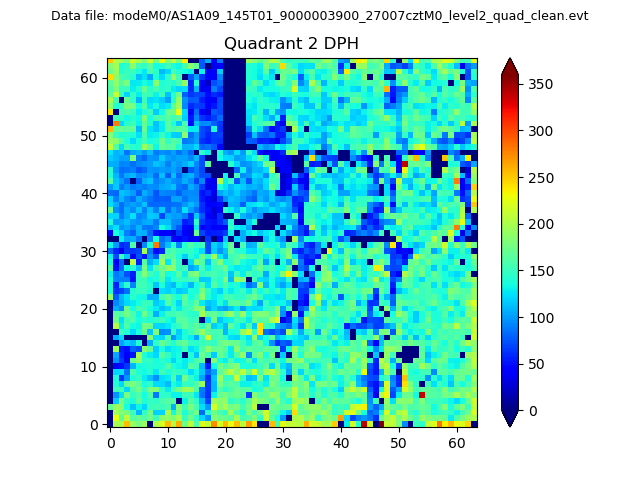
Histogram calculated using DETX and DETY for each event in the final _common_clean file
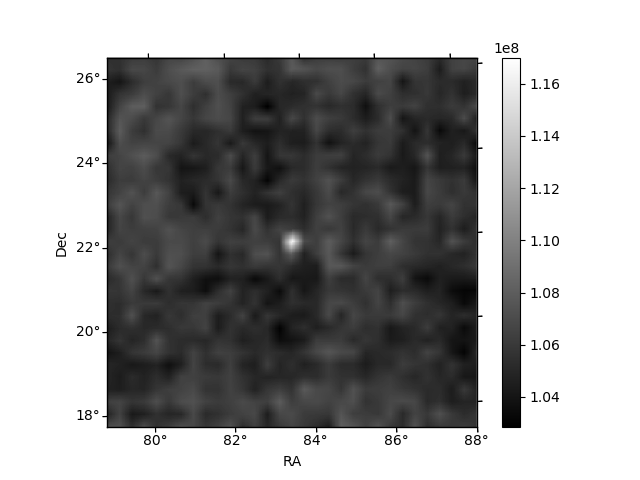
| Quadrant A |  |
 |
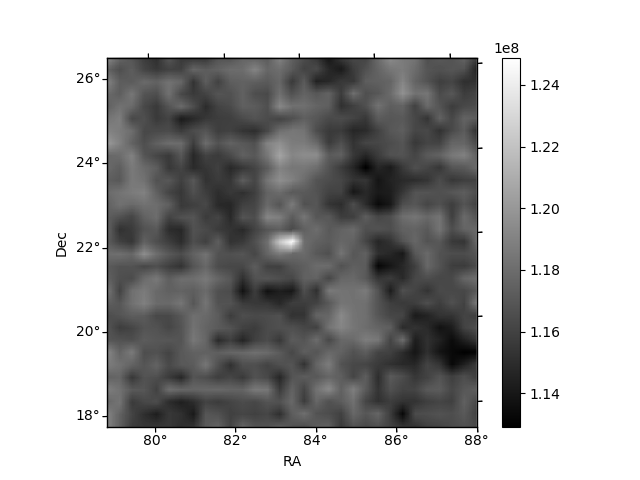
Quadrant B |
|---|---|---|---|
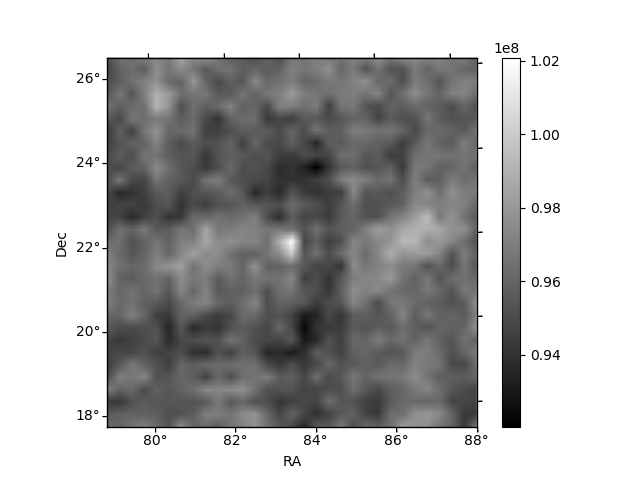
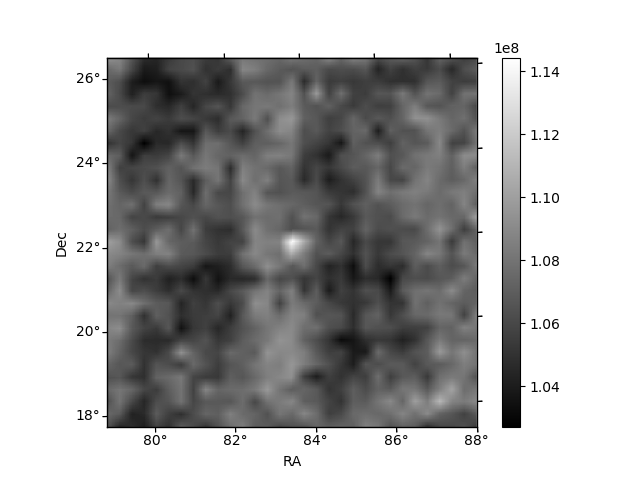
| Quadrant D |  |
 |
Quadrant C |
| Plot type | Count rate plots | Images |
|---|---|---|
| Comparison with Poisson distribution Blue bars denote a histogram of data divided into 1 sec bins. Red curve is a Poisson curve with rate = median count rate of data. |
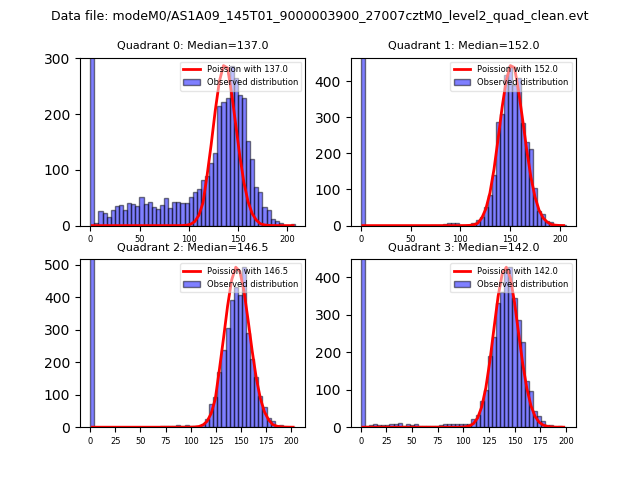 |
 |
| Quadrant-wise count rates Data is divided into 100 sec bins |
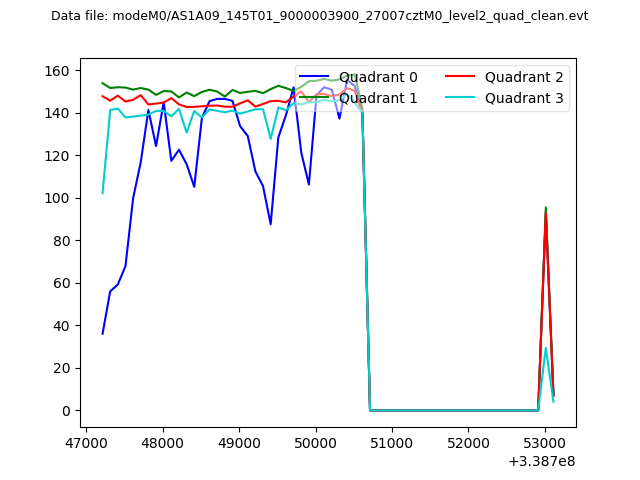 |
|
| Module-wise count rates for Quadrant A Data is divided into 100 sec bins |
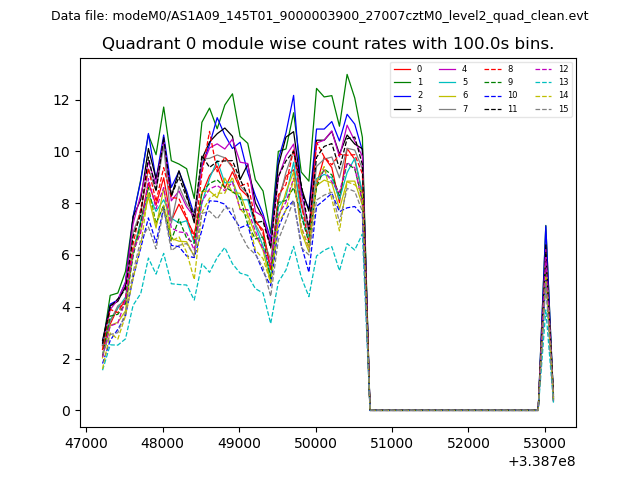 |
 |
| Module-wise count rates for Quadrant B Data is divided into 100 sec bins |
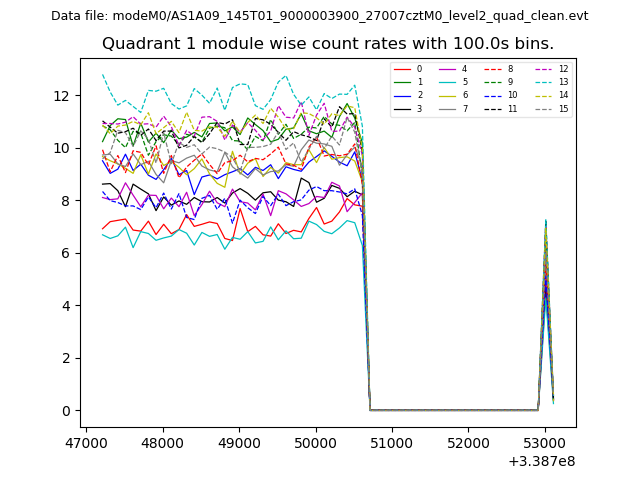 |
 |
| Module-wise count rates for Quadrant C Data is divided into 100 sec bins |
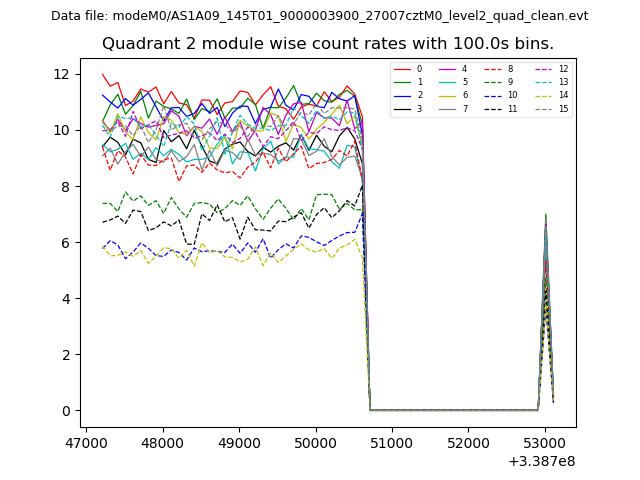 |
 |
| Module-wise count rates for Quadrant D Data is divided into 100 sec bins |
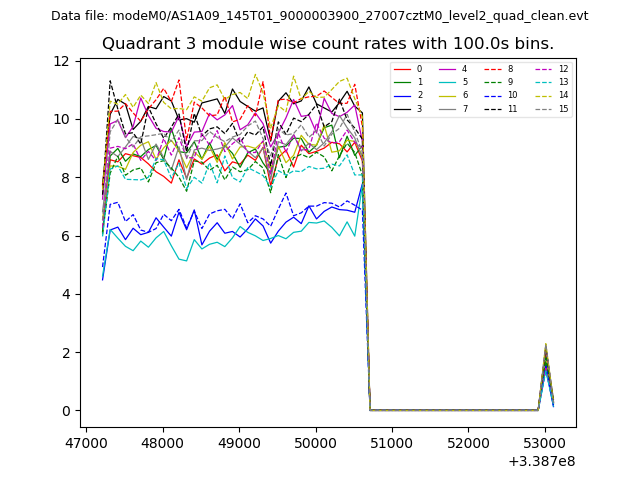 |
 |
| Parameter | Plot |
|---|---|
| CZT HV Monitor | 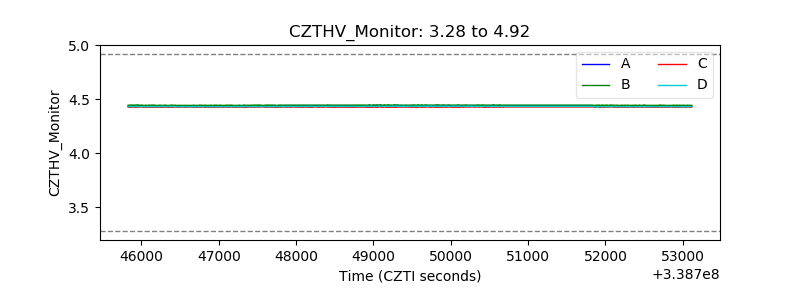 |
| D_VDD | 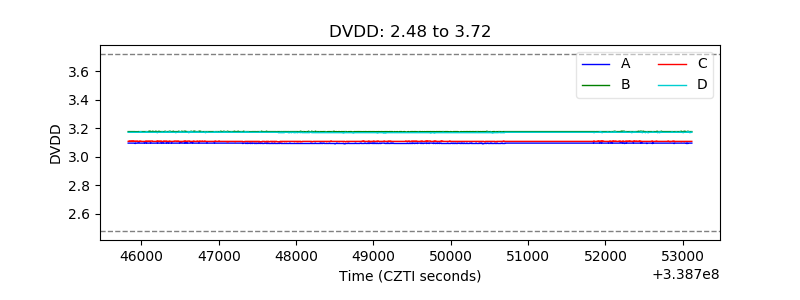 |
| Temperature 1 | 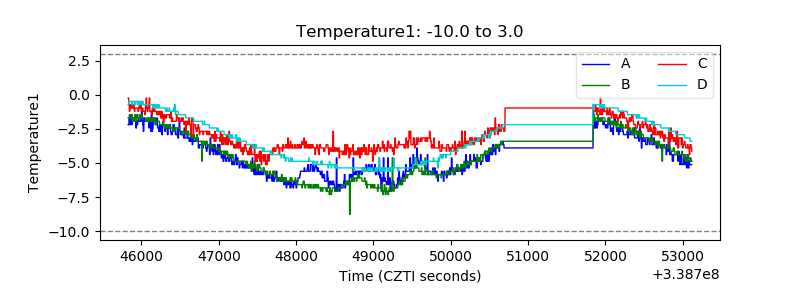 |
| Veto HV Monitor | 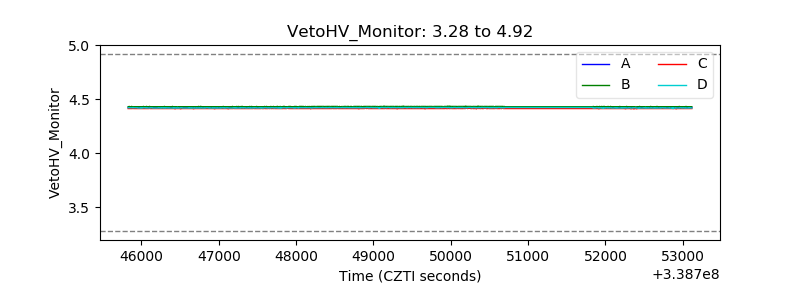 |
| Veto LLD |  |
| Alpha Counter | 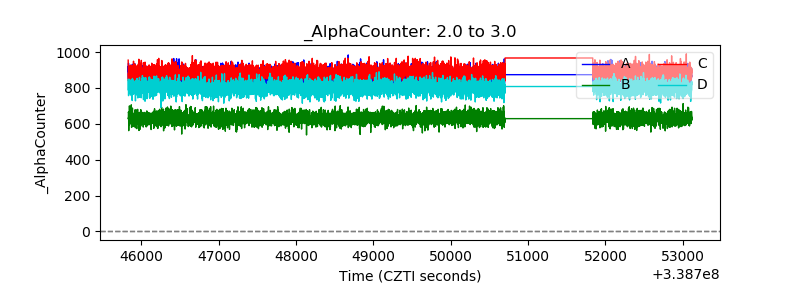 |
| _CPM_Rate | 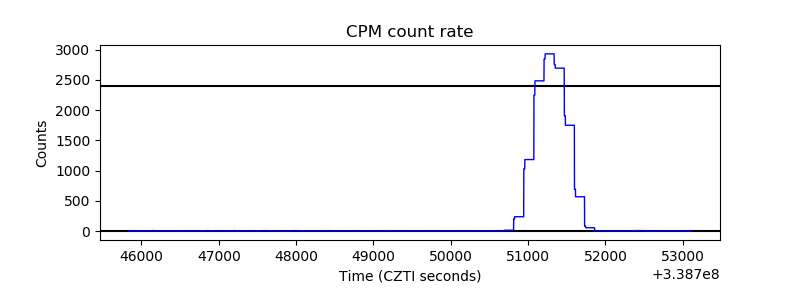 |
| CZT Counter | 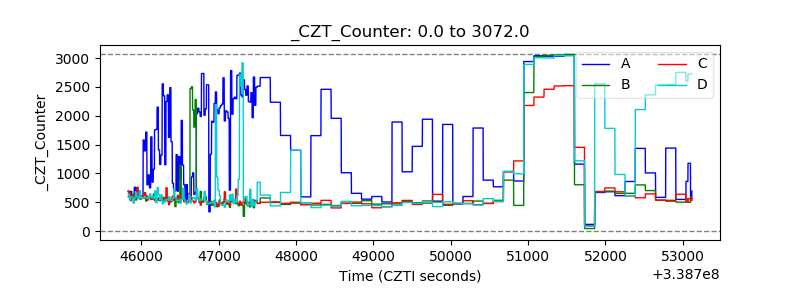 |
| +2.5 Volts monitor |  |
| +5 Volts monitor | 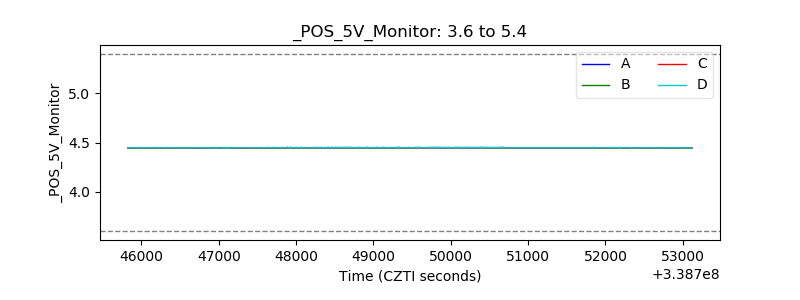 |
| _ROLL_ROT | 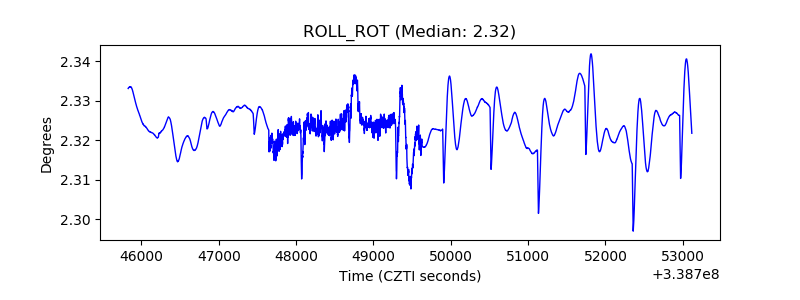 |
| _Roll_DEC | 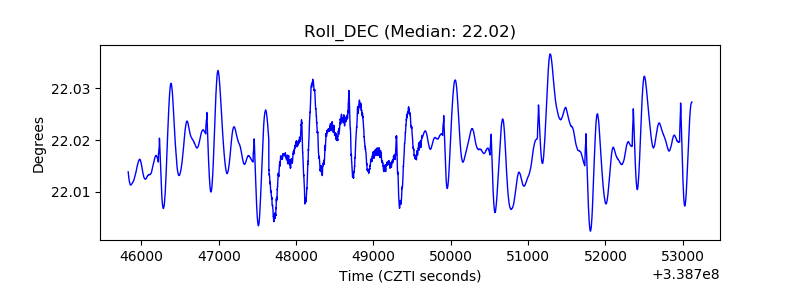 |
| _Roll_RA | 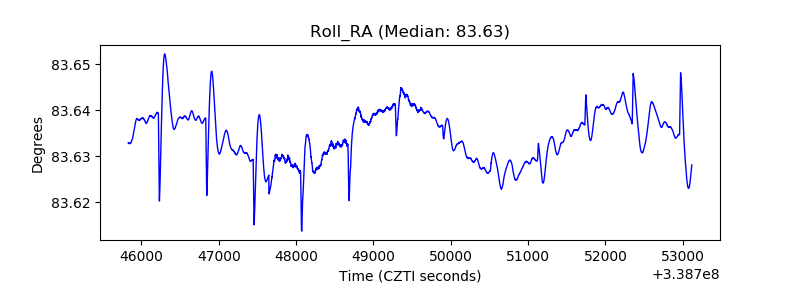 |
| Veto Counter | 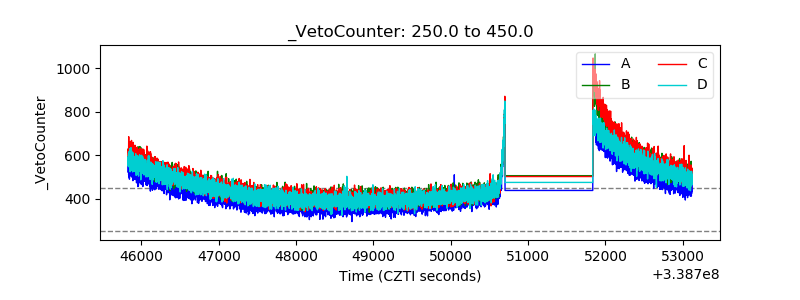 |