| Param | Original file | Final file |
|---|---|---|
| Filename | modeM0/AS1A09_145T01_9000003900_27009cztM0_level2.evt | modeM0/AS1A09_145T01_9000003900_27009cztM0_level2_quad_clean.evt |
| Size (bytes) | 565,073,280 | 109,249,920 |
| Size | 538.9 MB | 104.2 MB |
| Events in quadrant A | 5,310,759 | 708,164 |
| Events in quadrant B | 3,497,150 | 753,463 |
| Events in quadrant C | 3,515,668 | 726,812 |
| Events in quadrant D | 4,370,408 | 687,968 |
| Mode M0 | |||
|---|---|---|---|
| Quadrant | BADHDUFLAG | Total packets | Discarded packets |
| A | 0 | 20002 | 0 |
| B | 0 | 14400 | 0 |
| C | 0 | 14431 | 0 |
| D | 0 | 17053 | 0 |
| Mode M9 | |||
|---|---|---|---|
| Quadrant | BADHDUFLAG | Total packets | Discarded packets |
| A | 0 | 20 | 0 |
| B | 0 | 21 | 0 |
| C | 0 | 21 | 0 |
| D | 0 | 21 | 0 |
| Quadrant | Total seconds | Saturated seconds | Saturation percentage |
|---|---|---|---|
| A | 6194 | 496 | 8.007749% |
| B | 6194 | 71 | 1.146271% |
| C | 6194 | 122 | 1.969648% |
| D | 6194 | 291 | 4.698095% |
Noise dominated data is calculated using 1-second bins in cleaned event files. If a bin has >2000 counts, and if more than 50% of those come from <1% of pixels, then it is considered to be noise-dominated and hence unusable.
| Quadrant | # 1 sec bins | Bins with >0 counts | Bins with >2000 counts | High rate bins dominated by noise | Noise dominated (total time) | Noise dominated (detector-on time) | Marked lightcurve |
|---|---|---|---|---|---|---|---|
| A | 7499 | 6194 | 334 | 334 | 4.45% | 5.39% | 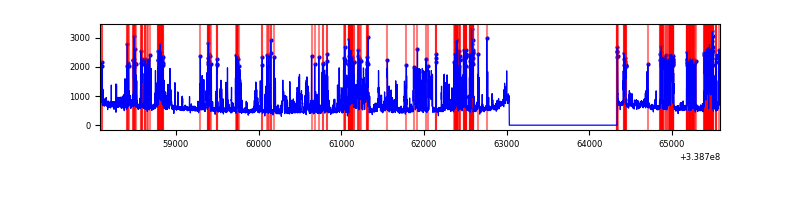 |
| B | 7499 | 6194 | 2 | 2 | 0.03% | 0.03% | 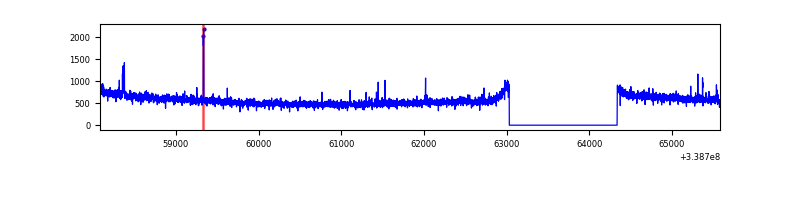 |
| C | 7499 | 6194 | 0 | 0 | 0.00% | 0.00% | 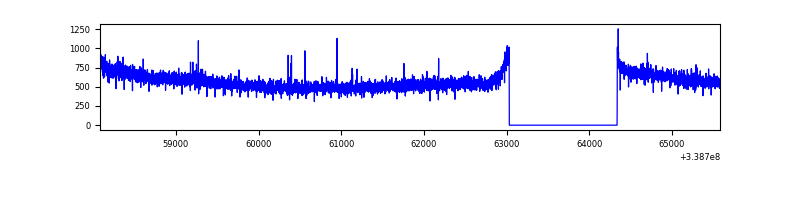 |
| D | 7499 | 6194 | 232 | 232 | 3.09% | 3.75% | 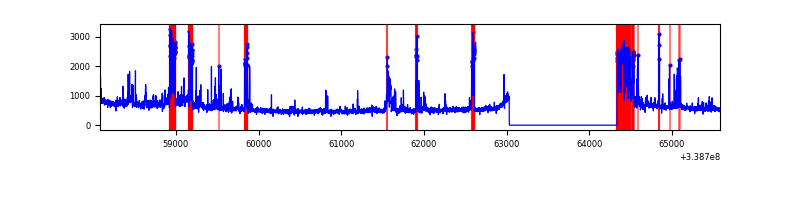 |
Top three noisy pixels from each quadrant. If the there are fewer than three noisy pixels in the level2.evt file, extra rows are filled as -1
| Pixel properties | Quadrant properties | ||||||
|---|---|---|---|---|---|---|---|
| Quadrant | DetID | PixID | Counts | Sigma | Mean | Median | Sigma |
| A | 14 | 235 | 1281819 | 7520.44 | 855 | 844 | 170.3 |
| A | 6 | 16 | 712246 | 4176.55 | 855 | 844 | 170.3 |
| A | 8 | 192 | 18434 | 103.27 | 855 | 844 | 170.3 |
| B | 0 | 189 | 23710 | 139.71 | 880 | 862 | 163.5 |
| B | 0 | 219 | 20538 | 120.31 | 880 | 862 | 163.5 |
| B | 3 | 64 | 20119 | 117.75 | 880 | 862 | 163.5 |
| C | 14 | 238 | 140823 | 699.52 | 862 | 873 | 200.1 |
| C | 2 | 16 | 7080 | 31.02 | 862 | 873 | 200.1 |
| C | 15 | 208 | 6047 | 25.86 | 862 | 873 | 200.1 |
| D | 12 | 233 | 385748 | 1944.43 | 839 | 821 | 198.0 |
| D | 11 | 176 | 344450 | 1735.82 | 839 | 821 | 198.0 |
| D | 1 | 239 | 246543 | 1241.25 | 839 | 821 | 198.0 |
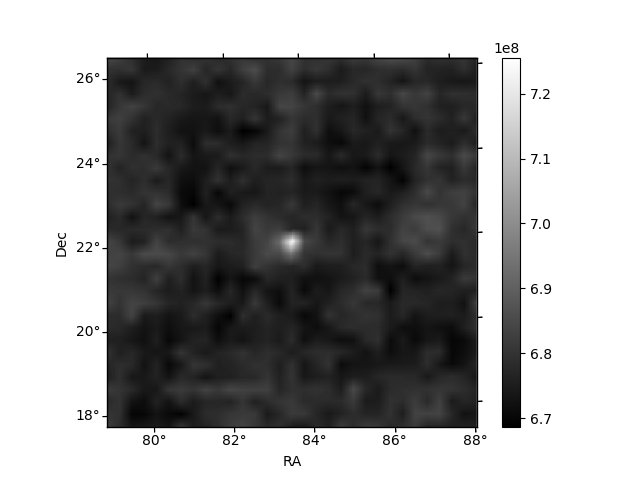
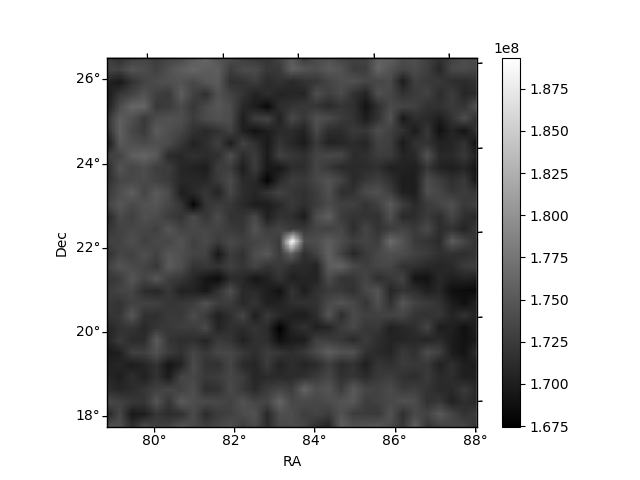
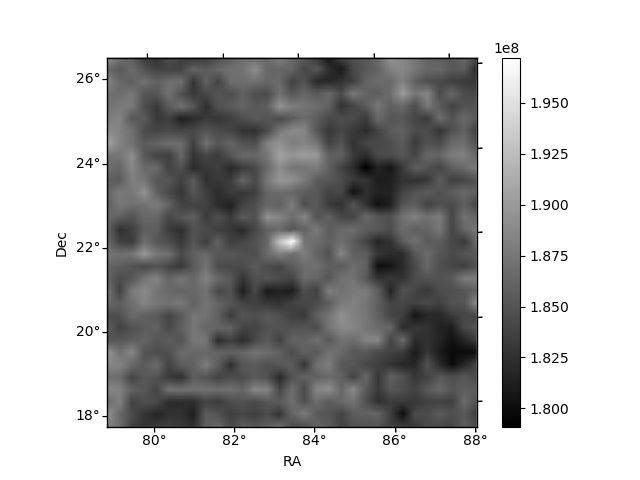
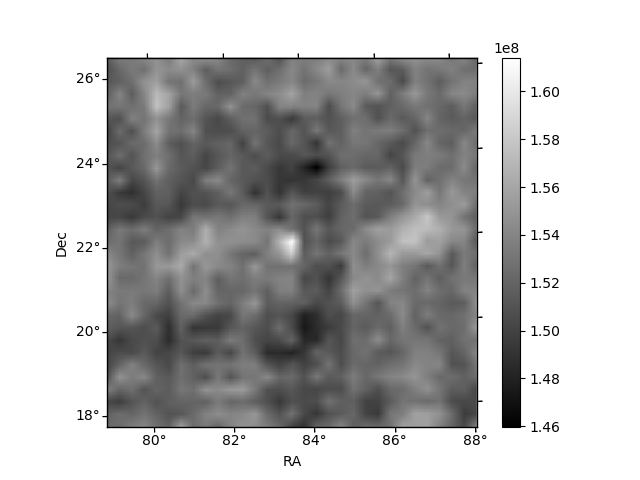
Histogram calculated using DETX and DETY for each event in the final _common_clean file
| Quadrant A | 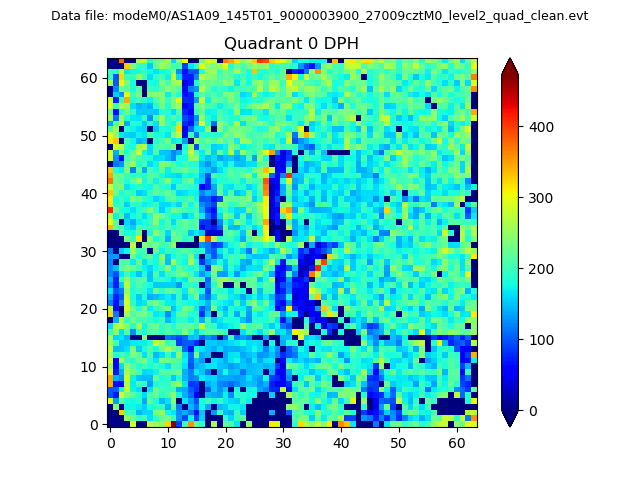 |
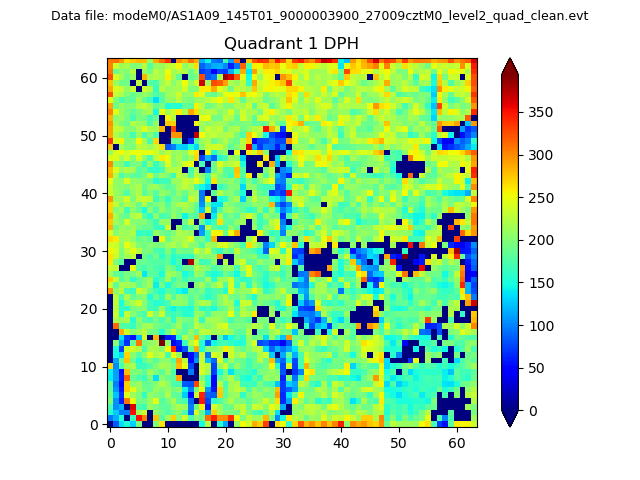 |
Quadrant B |
|---|---|---|---|
| Quadrant D | 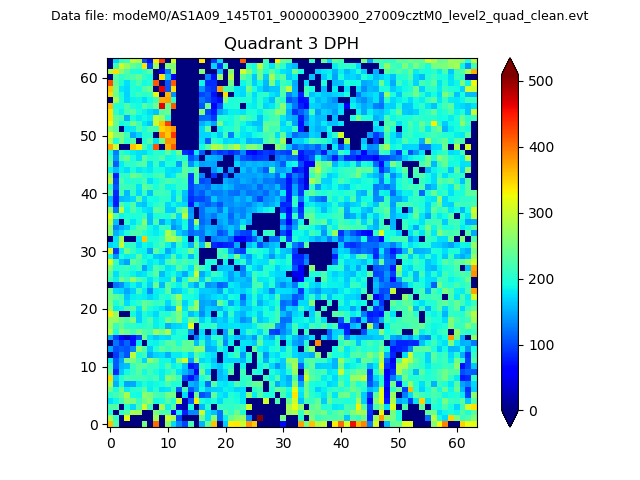 |
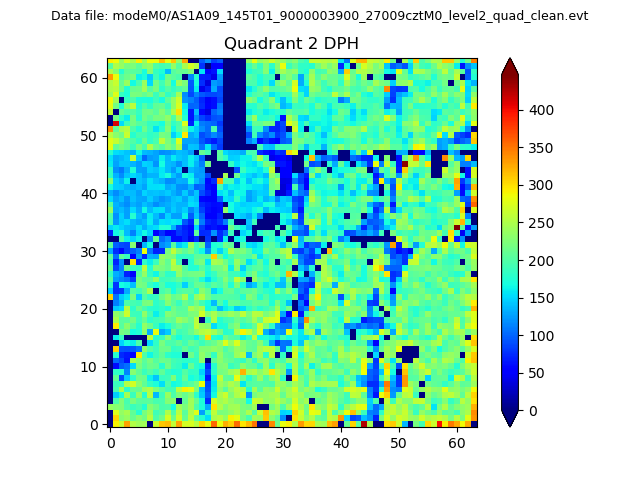 |
Quadrant C |
| Plot type | Count rate plots | Images |
|---|---|---|
| Comparison with Poisson distribution Blue bars denote a histogram of data divided into 1 sec bins. Red curve is a Poisson curve with rate = median count rate of data. |
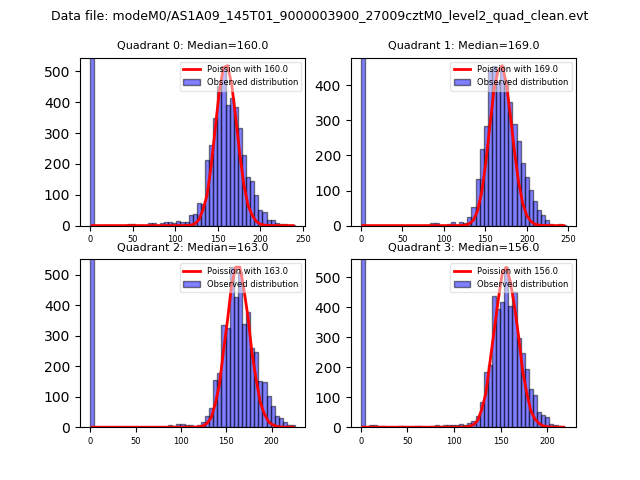 |
 |
| Quadrant-wise count rates Data is divided into 100 sec bins |
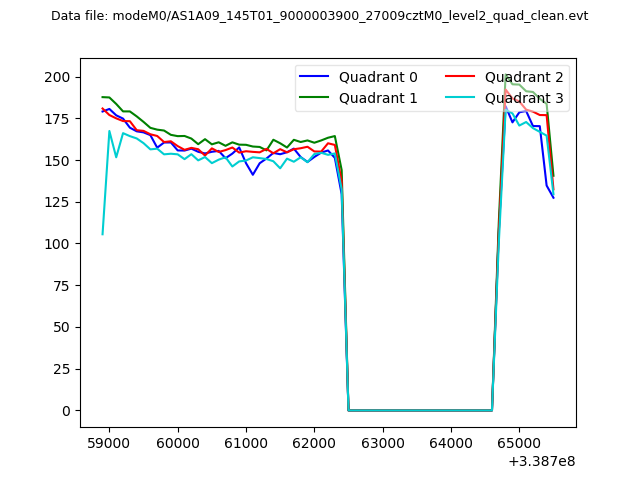 |
|
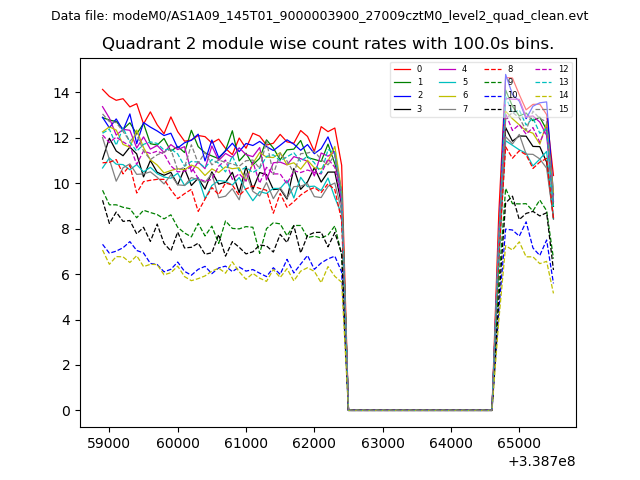
| Module-wise count rates for Quadrant A Data is divided into 100 sec bins |
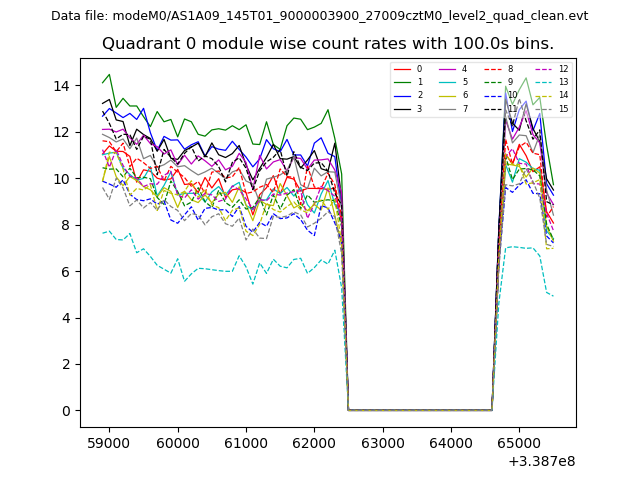 |
 |
| Module-wise count rates for Quadrant B Data is divided into 100 sec bins |
 |
 |
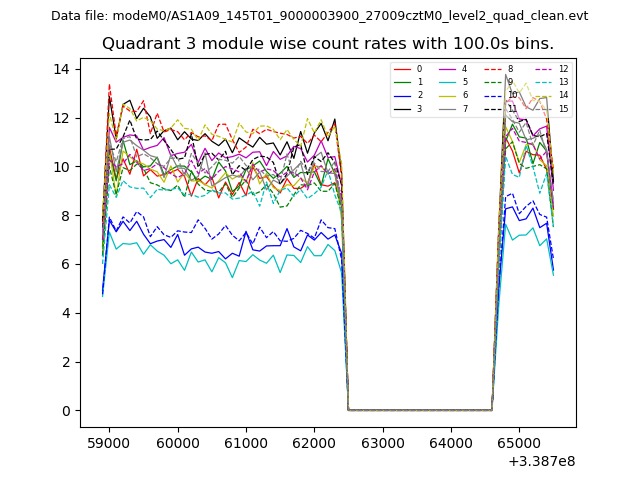
| Module-wise count rates for Quadrant C Data is divided into 100 sec bins |
 |
 |
| Module-wise count rates for Quadrant D Data is divided into 100 sec bins |
 |
 |
| Parameter | Plot |
|---|---|
| CZT HV Monitor | 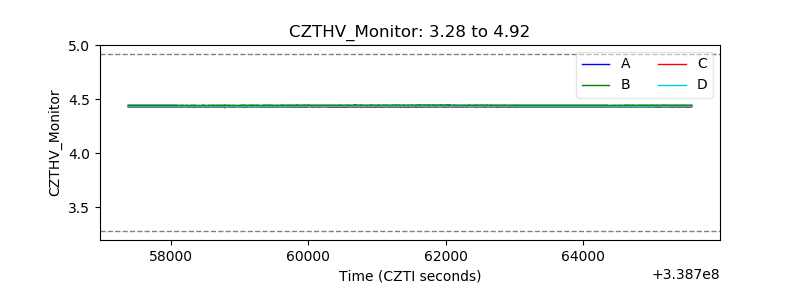 |
| D_VDD |  |
| Temperature 1 | 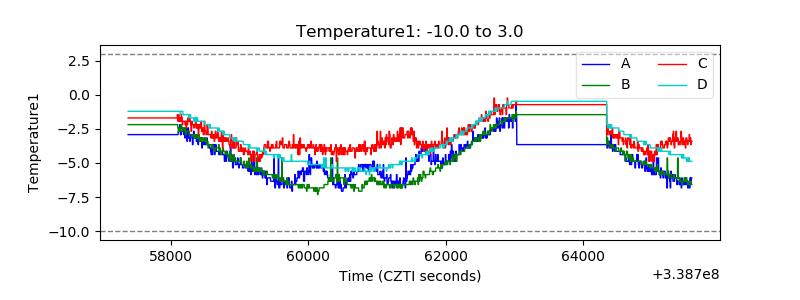 |
| Veto HV Monitor | 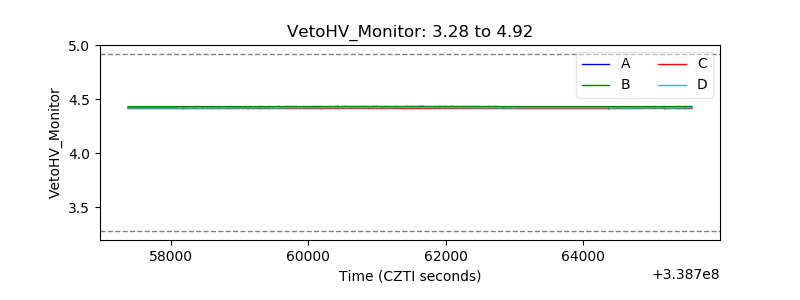 |
| Veto LLD | 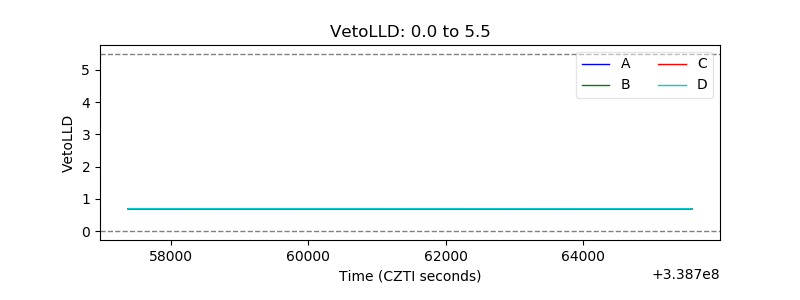 |
| Alpha Counter | 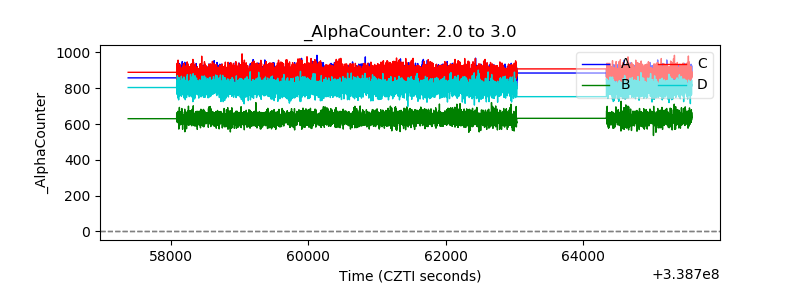 |
| _CPM_Rate | 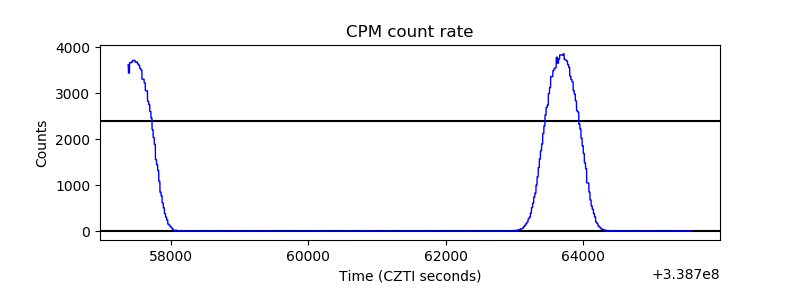 |
| CZT Counter | 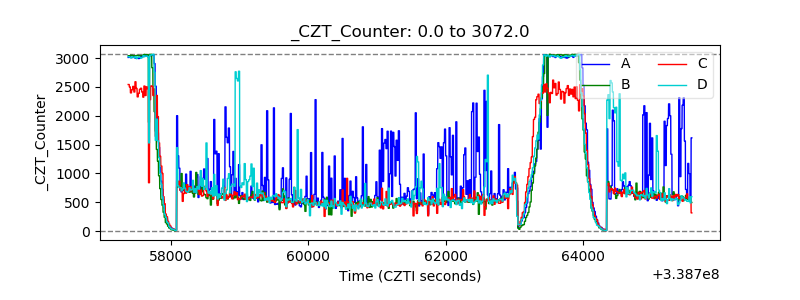 |
| +2.5 Volts monitor |  |
| +5 Volts monitor |  |
| _ROLL_ROT | 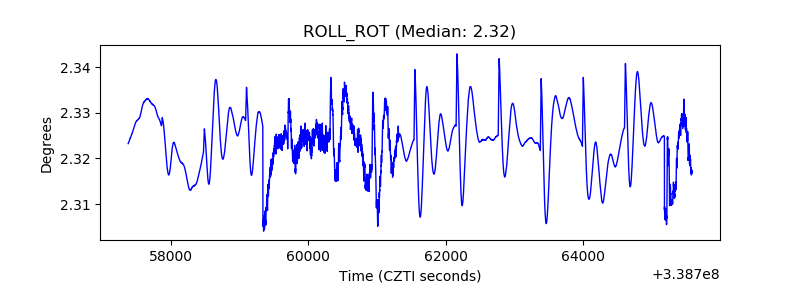 |
| _Roll_DEC | 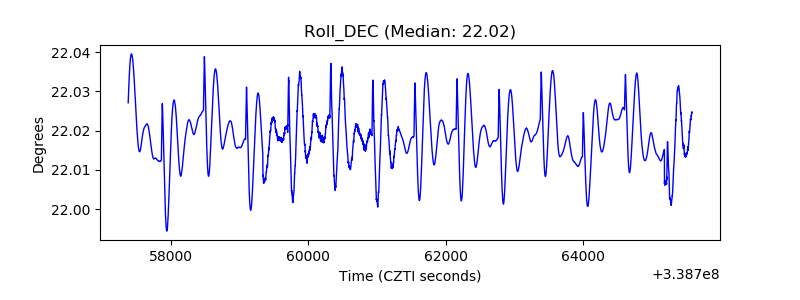 |
| _Roll_RA | 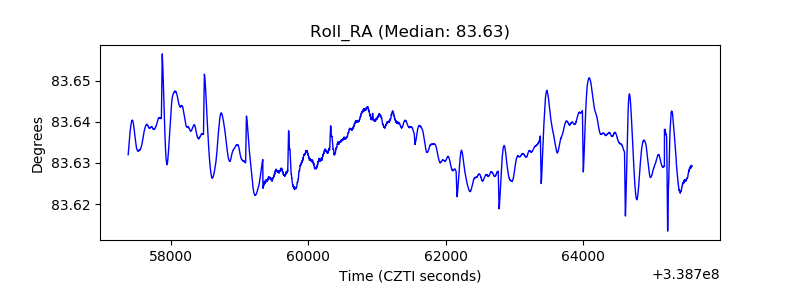 |
| Veto Counter |  |