| Param | Original file | Final file |
|---|---|---|
| Filename | modeM0/AS1A09_145T01_9000003900_27010cztM0_level2.evt | modeM0/AS1A09_145T01_9000003900_27010cztM0_level2_quad_clean.evt |
| Size (bytes) | 551,203,200 | 119,131,200 |
| Size | 525.7 MB | 113.6 MB |
| Events in quadrant A | 5,820,720 | 765,010 |
| Events in quadrant B | 3,686,881 | 846,028 |
| Events in quadrant C | 3,310,837 | 808,744 |
| Events in quadrant D | 3,470,983 | 771,612 |
| Mode M0 | |||
|---|---|---|---|
| Quadrant | BADHDUFLAG | Total packets | Discarded packets |
| A | 0 | 21432 | 0 |
| B | 0 | 14922 | 0 |
| C | 0 | 13585 | 0 |
| D | 0 | 14186 | 0 |
| Mode M9 | |||
|---|---|---|---|
| Quadrant | BADHDUFLAG | Total packets | Discarded packets |
| A | 0 | 14 | 0 |
| B | 0 | 14 | 0 |
| C | 0 | 14 | 0 |
| D | 0 | 14 | 0 |
| Quadrant | Total seconds | Saturated seconds | Saturation percentage |
|---|---|---|---|
| A | 5969 | 737 | 12.347127% |
| B | 5969 | 117 | 1.960127% |
| C | 5970 | 83 | 1.390285% |
| D | 5970 | 68 | 1.139028% |
Noise dominated data is calculated using 1-second bins in cleaned event files. If a bin has >2000 counts, and if more than 50% of those come from <1% of pixels, then it is considered to be noise-dominated and hence unusable.
| Quadrant | # 1 sec bins | Bins with >0 counts | Bins with >2000 counts | High rate bins dominated by noise | Noise dominated (total time) | Noise dominated (detector-on time) | Marked lightcurve |
|---|---|---|---|---|---|---|---|
| A | 7339 | 5970 | 596 | 596 | 8.12% | 9.98% | 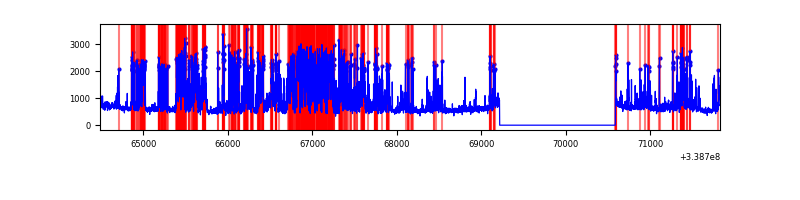 |
| B | 7339 | 5969 | 35 | 35 | 0.48% | 0.59% | 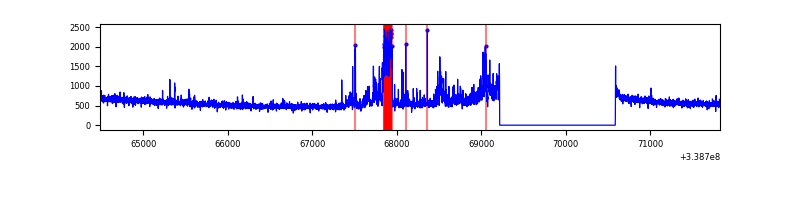 |
| C | 7340 | 5971 | 1 | 1 | 0.01% | 0.02% | 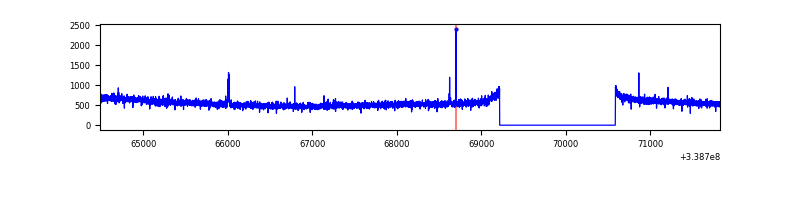 |
| D | 7340 | 5971 | 46 | 46 | 0.63% | 0.77% | 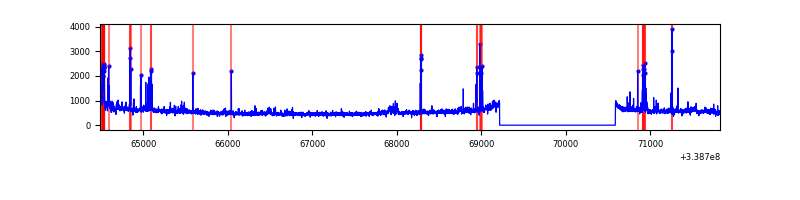 |
Top three noisy pixels from each quadrant. If the there are fewer than three noisy pixels in the level2.evt file, extra rows are filled as -1
| Pixel properties | Quadrant properties | ||||||
|---|---|---|---|---|---|---|---|
| Quadrant | DetID | PixID | Counts | Sigma | Mean | Median | Sigma |
| A | 14 | 235 | 2309035 | 14577.84 | 794 | 782 | 158.3 |
| A | 6 | 16 | 436084 | 2749.16 | 794 | 782 | 158.3 |
| A | 8 | 192 | 13627 | 81.12 | 794 | 782 | 158.3 |
| B | 0 | 189 | 386370 | 2473.3 | 833 | 816 | 155.9 |
| B | 0 | 219 | 30369 | 189.58 | 833 | 816 | 155.9 |
| B | 3 | 64 | 20981 | 129.36 | 833 | 816 | 155.9 |
| C | 14 | 238 | 132082 | 694.65 | 810 | 822 | 189.0 |
| C | 15 | 208 | 17531 | 88.43 | 810 | 822 | 189.0 |
| C | 13 | 61 | 5548 | 25.01 | 810 | 822 | 189.0 |
| D | 11 | 176 | 157889 | 831.67 | 799 | 784 | 188.9 |
| D | 2 | 250 | 142470 | 750.04 | 799 | 784 | 188.9 |
| D | 12 | 233 | 80494 | 421.96 | 799 | 784 | 188.9 |
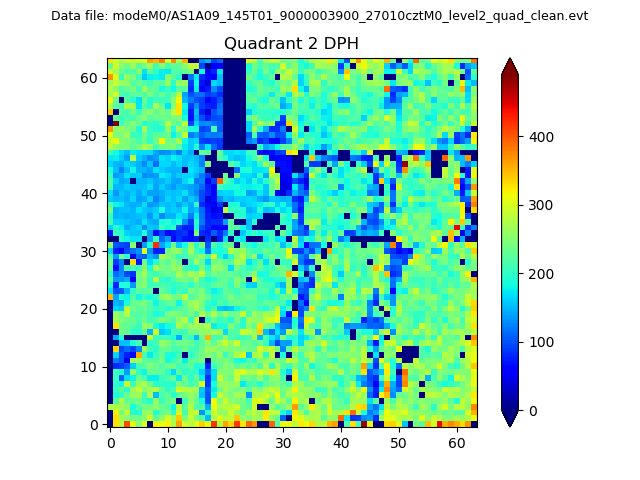
Histogram calculated using DETX and DETY for each event in the final _common_clean file
| Quadrant A | 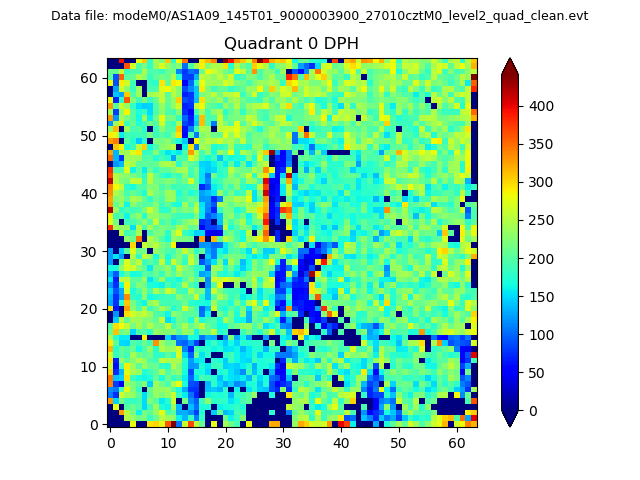 |
 |
Quadrant B |
|---|---|---|---|
| Quadrant D | 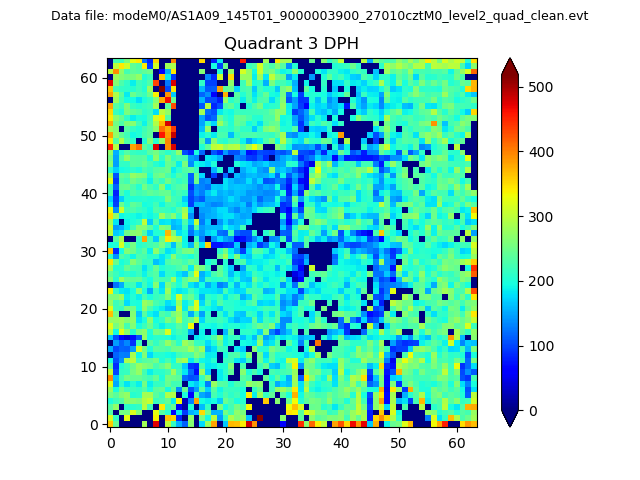 |
 |
Quadrant C |
| Plot type | Count rate plots | Images |
|---|---|---|
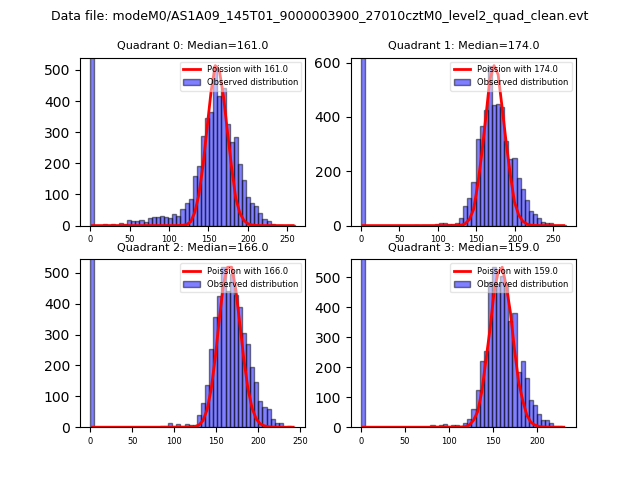
| Comparison with Poisson distribution Blue bars denote a histogram of data divided into 1 sec bins. Red curve is a Poisson curve with rate = median count rate of data. |
 |
 |
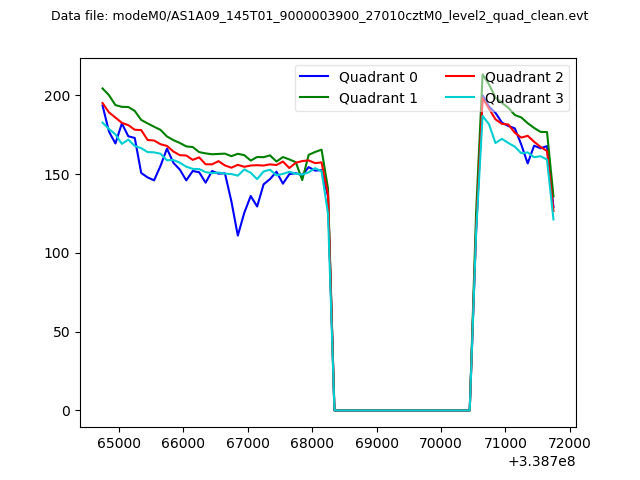
| Quadrant-wise count rates Data is divided into 100 sec bins |
 |
|
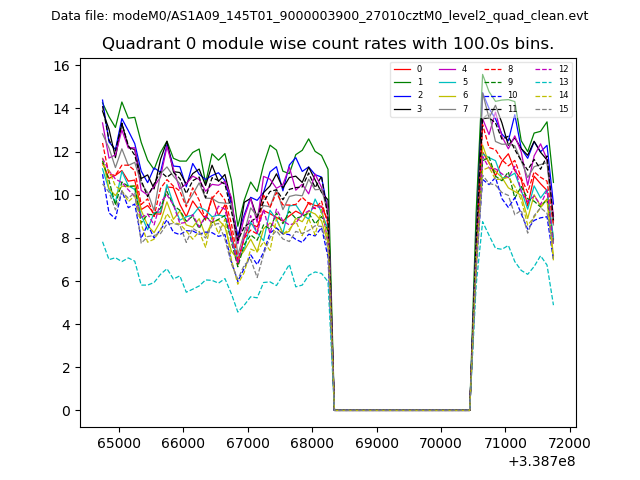
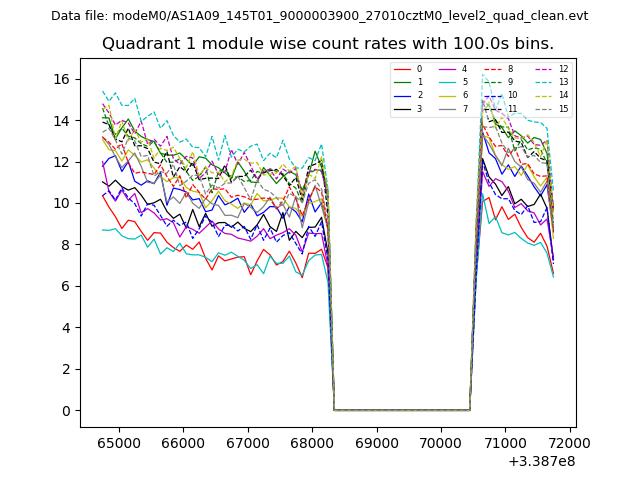
| Module-wise count rates for Quadrant A Data is divided into 100 sec bins |
 |
 |
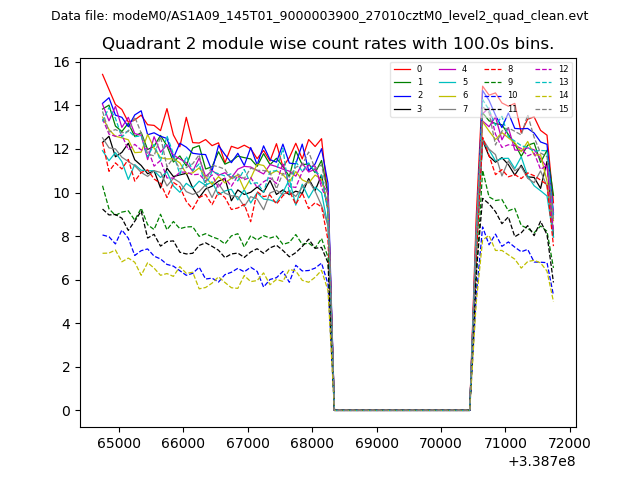
| Module-wise count rates for Quadrant B Data is divided into 100 sec bins |
 |
 |
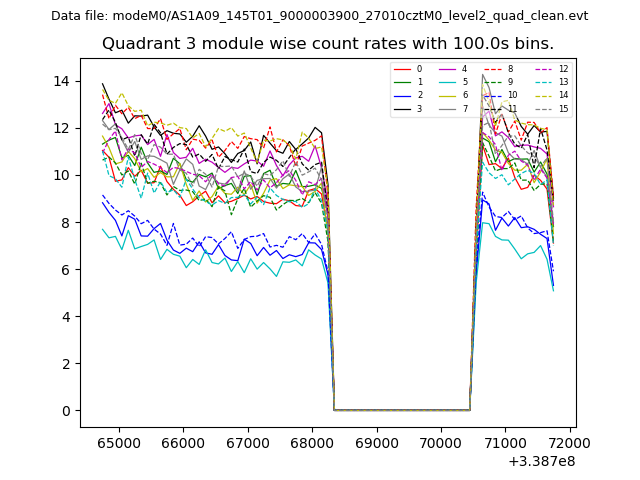
| Module-wise count rates for Quadrant C Data is divided into 100 sec bins |
 |
 |
| Module-wise count rates for Quadrant D Data is divided into 100 sec bins |
 |
 |
| Parameter | Plot |
|---|---|
| CZT HV Monitor | 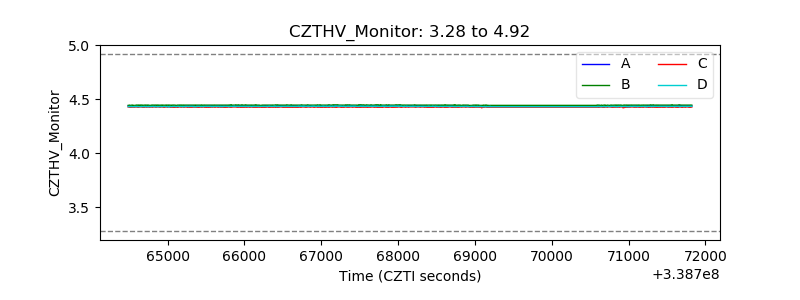 |
| D_VDD | 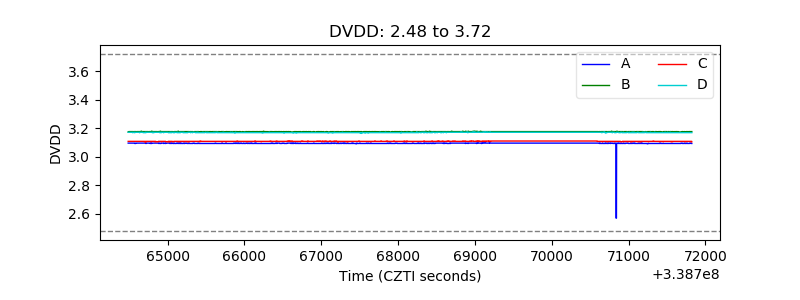 |
| Temperature 1 | 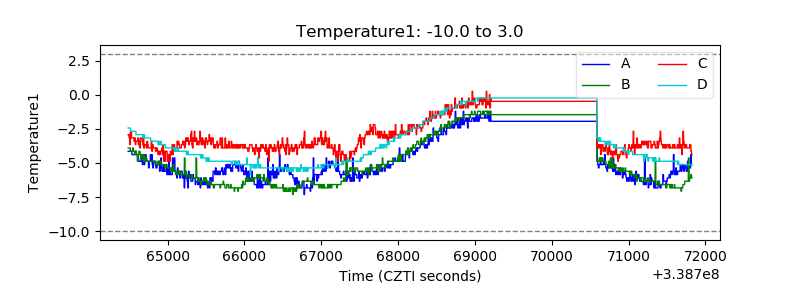 |
| Veto HV Monitor |  |
| Veto LLD |  |
| Alpha Counter | 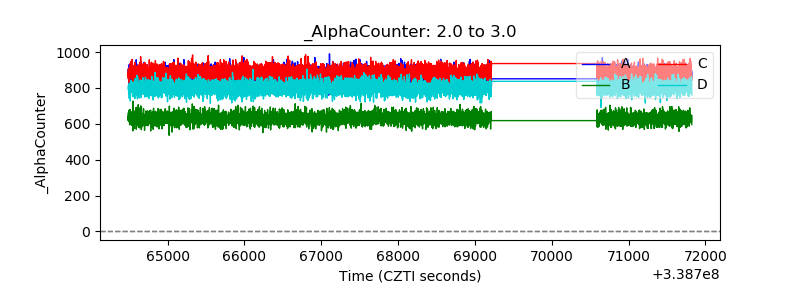 |
| _CPM_Rate | 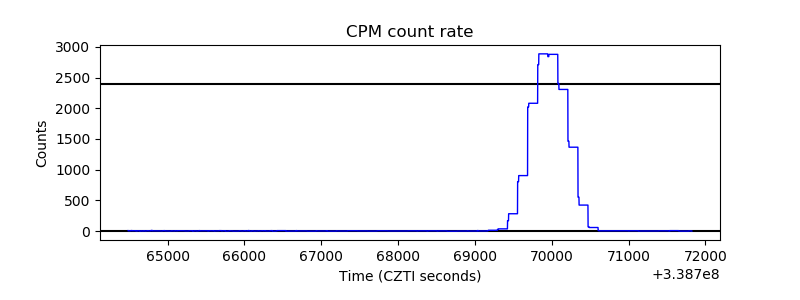 |
| CZT Counter | 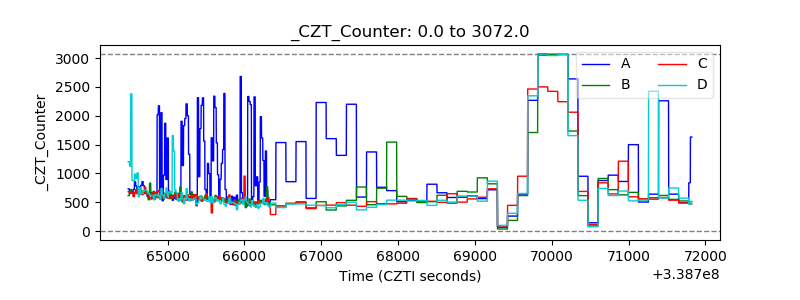 |
| +2.5 Volts monitor | 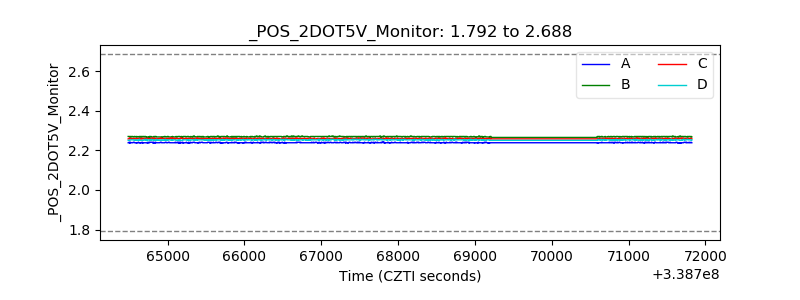 |
| +5 Volts monitor | 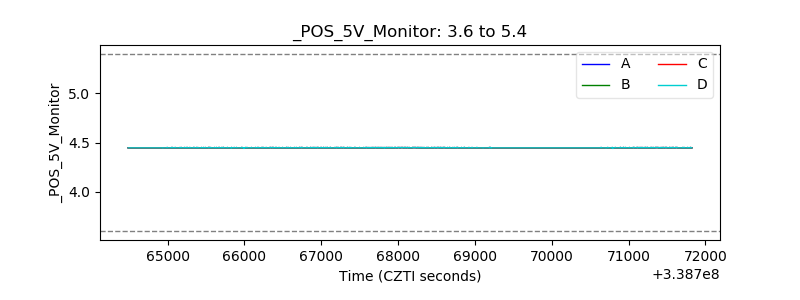 |
| _ROLL_ROT | 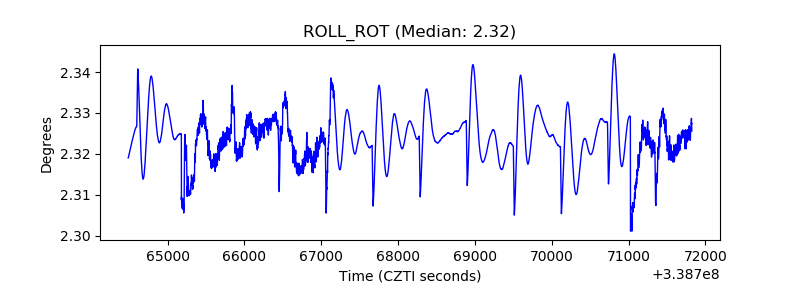 |
| _Roll_DEC | 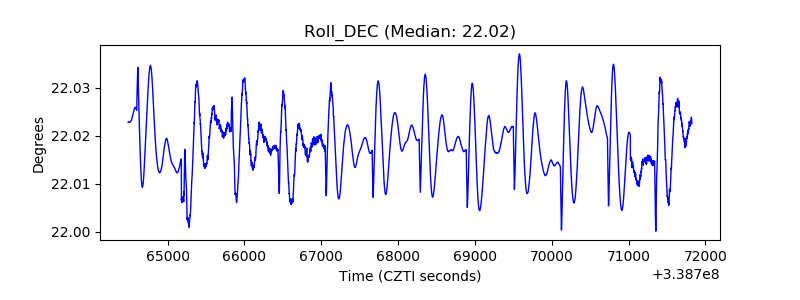 |
| _Roll_RA |  |
| Veto Counter | 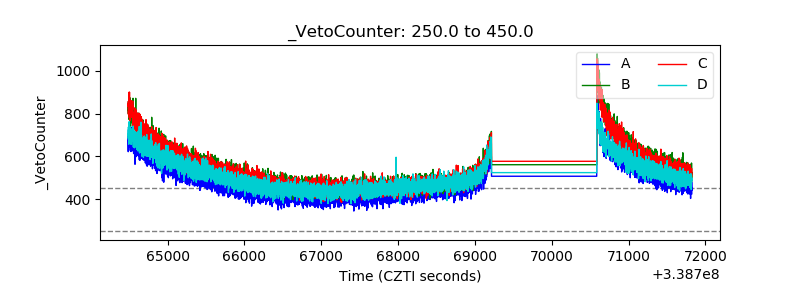 |