| Param | Original file | Final file |
|---|---|---|
| Filename | modeM0/AS1A09_145T01_9000003900_27013cztM0_level2.evt | modeM0/AS1A09_145T01_9000003900_27013cztM0_level2_quad_clean.evt |
| Size (bytes) | 611,890,560 | 104,284,800 |
| Size | 583.5 MB | 99.5 MB |
| Events in quadrant A | 6,778,748 | 631,380 |
| Events in quadrant B | 3,570,518 | 711,578 |
| Events in quadrant C | 3,479,789 | 681,233 |
| Events in quadrant D | 4,229,214 | 647,689 |
| Mode M0 | |||
|---|---|---|---|
| Quadrant | BADHDUFLAG | Total packets | Discarded packets |
| A | 0 | 24685 | 0 |
| B | 0 | 14846 | 0 |
| C | 0 | 14615 | 0 |
| D | 0 | 17259 | 0 |
| Mode M9 | |||
|---|---|---|---|
| Quadrant | BADHDUFLAG | Total packets | Discarded packets |
| A | 0 | 7 | 0 |
| B | 0 | 7 | 0 |
| C | 0 | 7 | 0 |
| D | 0 | 7 | 0 |
| Quadrant | Total seconds | Saturated seconds | Saturation percentage |
|---|---|---|---|
| A | 6981 | 1128 | 16.158144% |
| B | 6982 | 128 | 1.833286% |
| C | 6982 | 125 | 1.790318% |
| D | 6981 | 272 | 3.896290% |
Noise dominated data is calculated using 1-second bins in cleaned event files. If a bin has >2000 counts, and if more than 50% of those come from <1% of pixels, then it is considered to be noise-dominated and hence unusable.
| Quadrant | # 1 sec bins | Bins with >0 counts | Bins with >2000 counts | High rate bins dominated by noise | Noise dominated (total time) | Noise dominated (detector-on time) | Marked lightcurve |
|---|---|---|---|---|---|---|---|
| A | 7676 | 6982 | 988 | 988 | 12.87% | 14.15% | 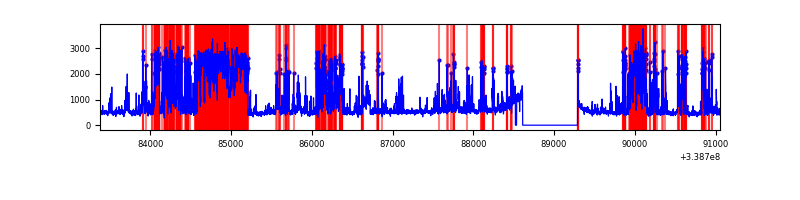 |
| B | 7677 | 6983 | 19 | 19 | 0.25% | 0.27% | 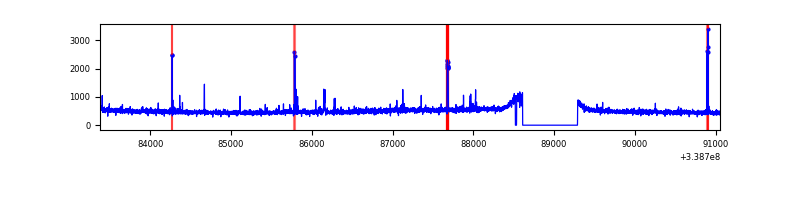 |
| C | 7677 | 6983 | 0 | 0 | 0.00% | 0.00% | 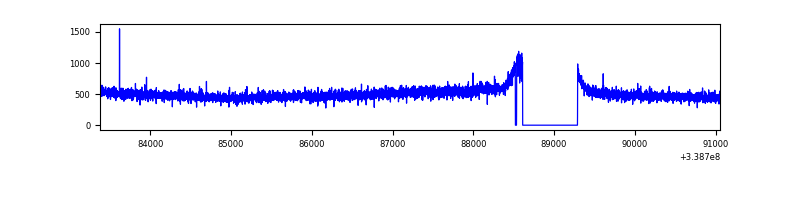 |
| D | 7676 | 6982 | 235 | 235 | 3.06% | 3.37% | 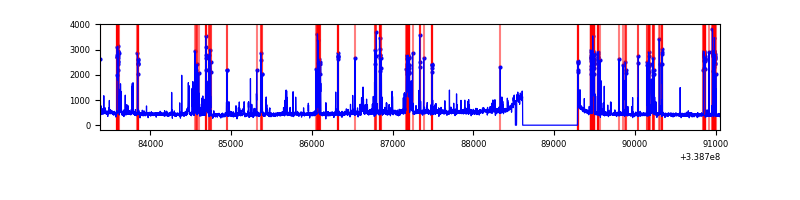 |
Top three noisy pixels from each quadrant. If the there are fewer than three noisy pixels in the level2.evt file, extra rows are filled as -1
| Pixel properties | Quadrant properties | ||||||
|---|---|---|---|---|---|---|---|
| Quadrant | DetID | PixID | Counts | Sigma | Mean | Median | Sigma |
| A | 6 | 16 | 2348934 | 13759.85 | 839 | 825 | 170.6 |
| A | 14 | 235 | 1182159 | 6922.58 | 839 | 825 | 170.6 |
| A | 8 | 192 | 14427 | 79.71 | 839 | 825 | 170.6 |
| B | 0 | 189 | 65211 | 377.39 | 883 | 864 | 170.5 |
| B | 0 | 219 | 21548 | 121.31 | 883 | 864 | 170.5 |
| B | 10 | 245 | 20307 | 114.03 | 883 | 864 | 170.5 |
| C | 14 | 238 | 135498 | 667.35 | 850 | 858 | 201.8 |
| C | 5 | 218 | 12719 | 58.79 | 850 | 858 | 201.8 |
| C | 14 | 225 | 6598 | 28.45 | 850 | 858 | 201.8 |
| D | 1 | 52 | 770716 | 3803.91 | 842 | 823 | 202.4 |
| D | 11 | 176 | 215699 | 1061.67 | 842 | 823 | 202.4 |
| D | 2 | 250 | 43121 | 208.99 | 842 | 823 | 202.4 |
Histogram calculated using DETX and DETY for each event in the final _common_clean file
| Quadrant A | 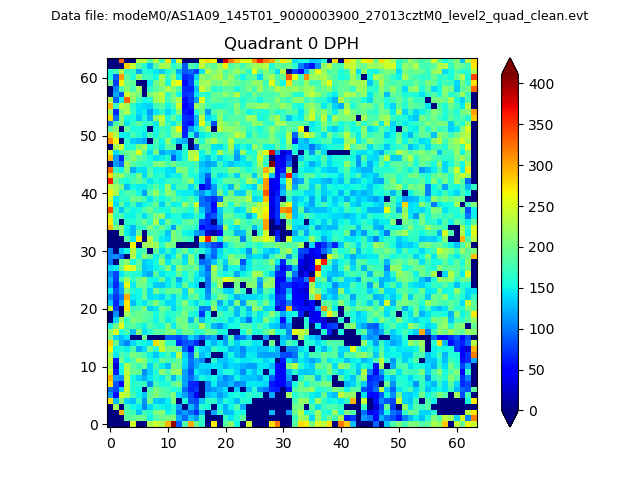 |
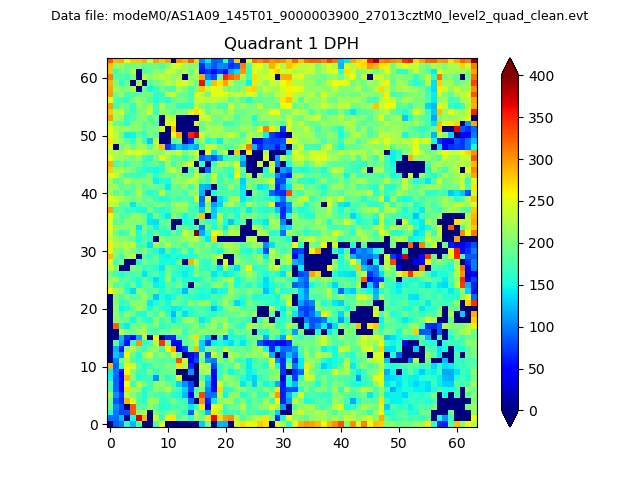 |
Quadrant B |
|---|---|---|---|
| Quadrant D |  |
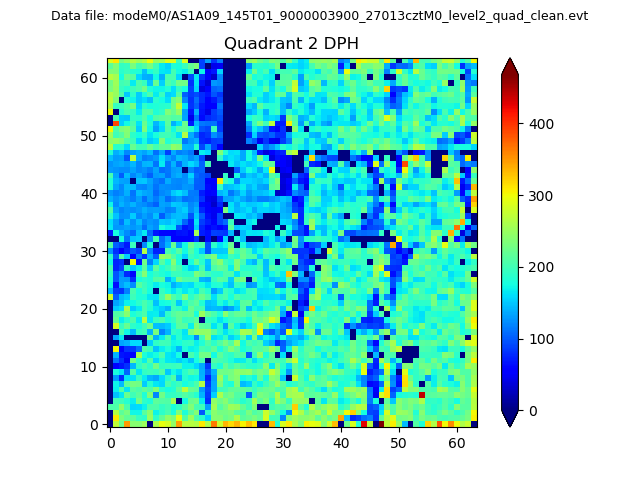 |
Quadrant C |
| Plot type | Count rate plots | Images |
|---|---|---|
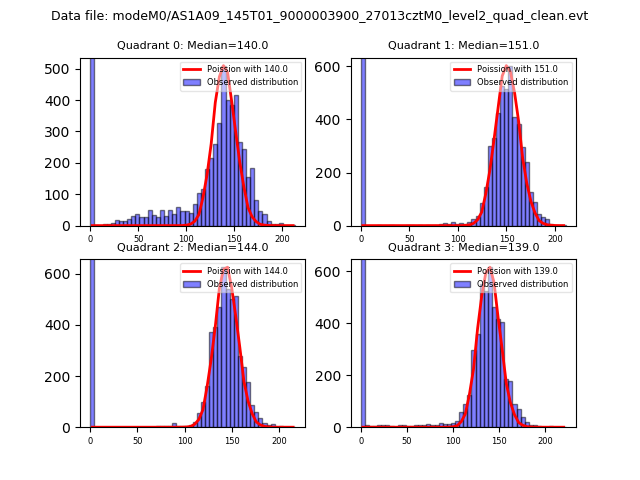
| Comparison with Poisson distribution Blue bars denote a histogram of data divided into 1 sec bins. Red curve is a Poisson curve with rate = median count rate of data. |
 |
 |
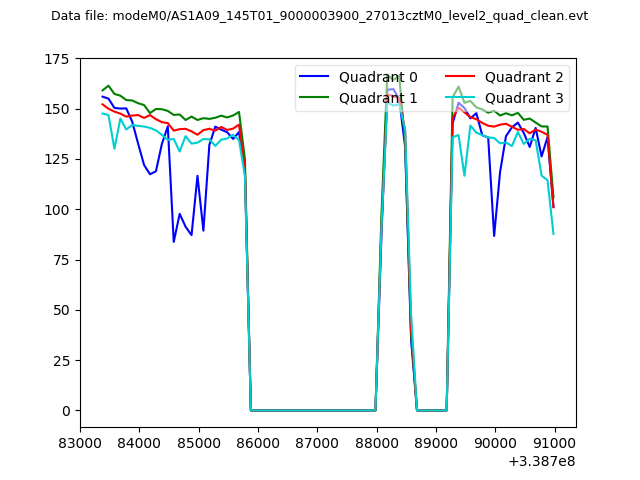
| Quadrant-wise count rates Data is divided into 100 sec bins |
 |
|
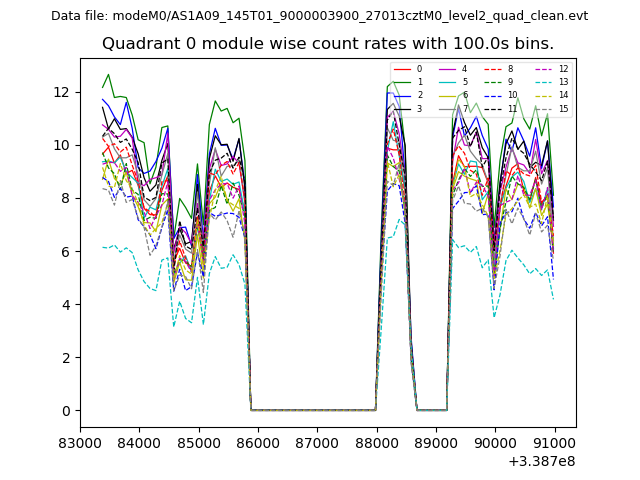
| Module-wise count rates for Quadrant A Data is divided into 100 sec bins |
 |
 |
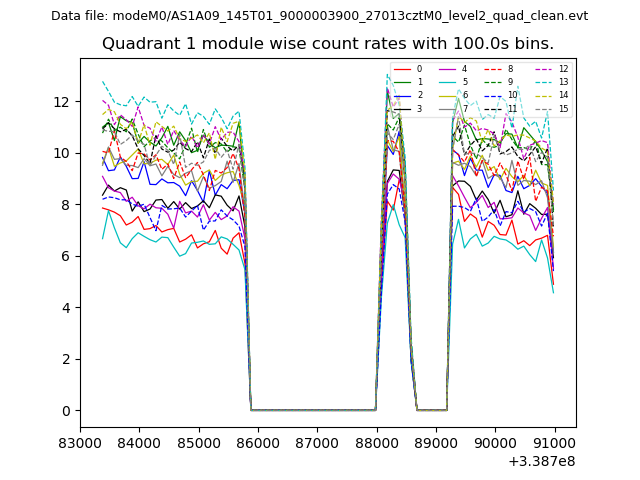
| Module-wise count rates for Quadrant B Data is divided into 100 sec bins |
 |
 |
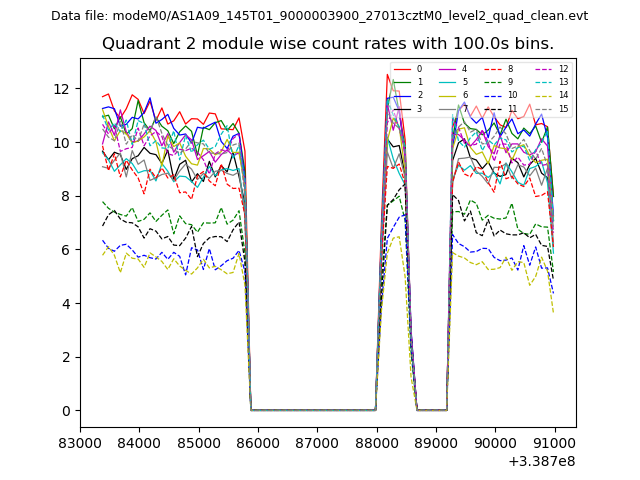
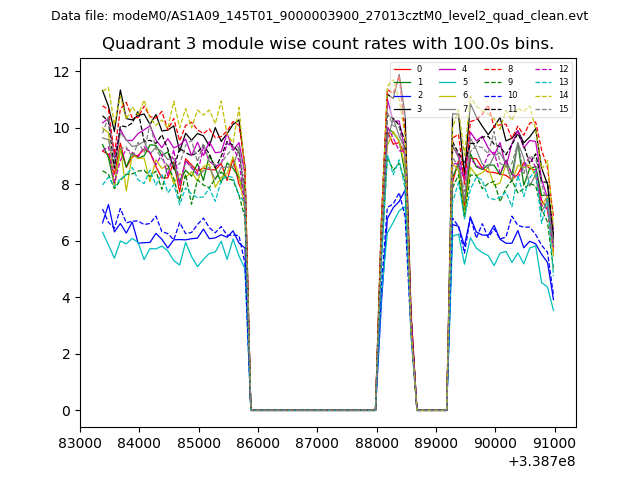
| Module-wise count rates for Quadrant C Data is divided into 100 sec bins |
 |
 |
| Module-wise count rates for Quadrant D Data is divided into 100 sec bins |
 |
 |
| Parameter | Plot |
|---|---|
| CZT HV Monitor | 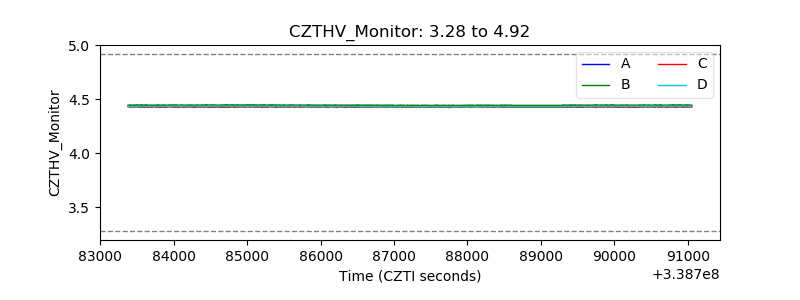 |
| D_VDD | 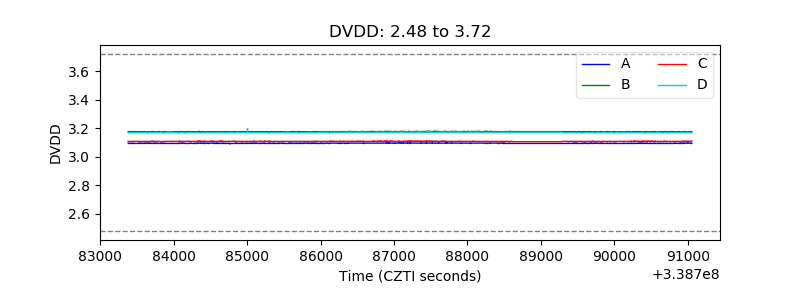 |
| Temperature 1 | 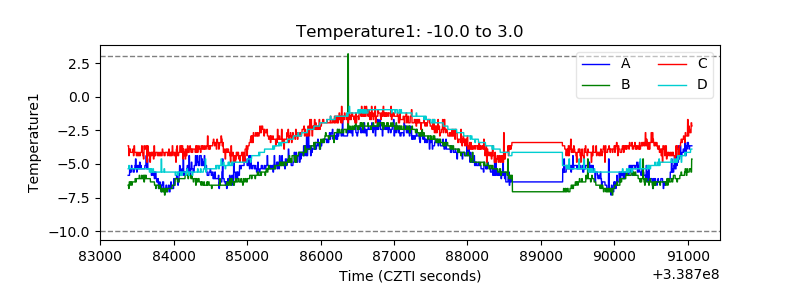 |
| Veto HV Monitor | 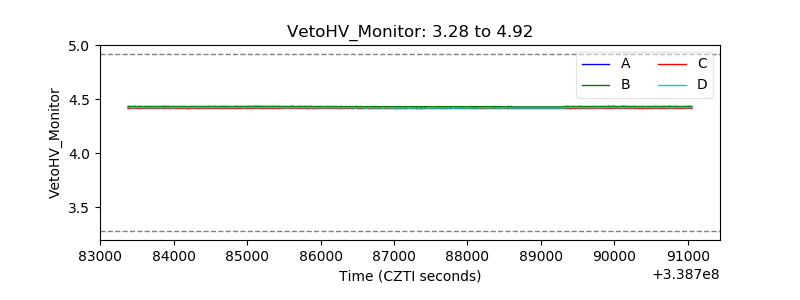 |
| Veto LLD | 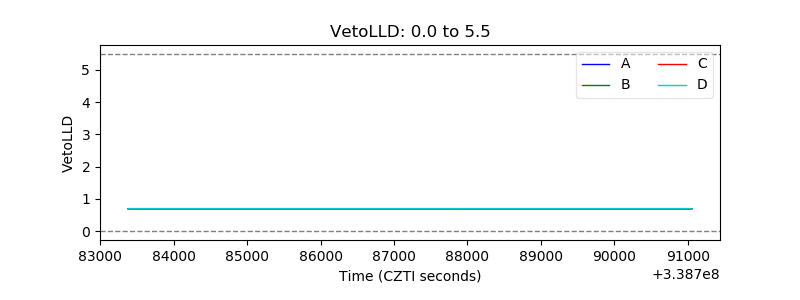 |
| Alpha Counter | 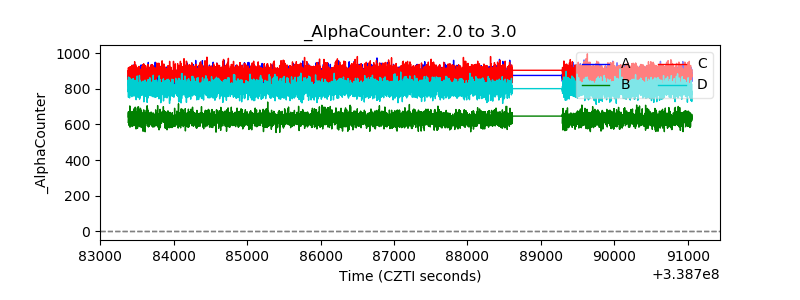 |
| _CPM_Rate | 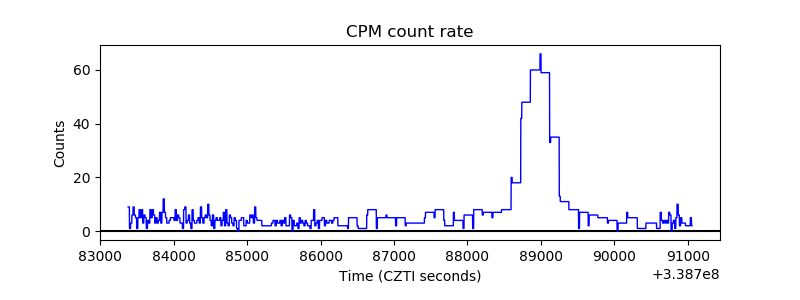 |
| CZT Counter | 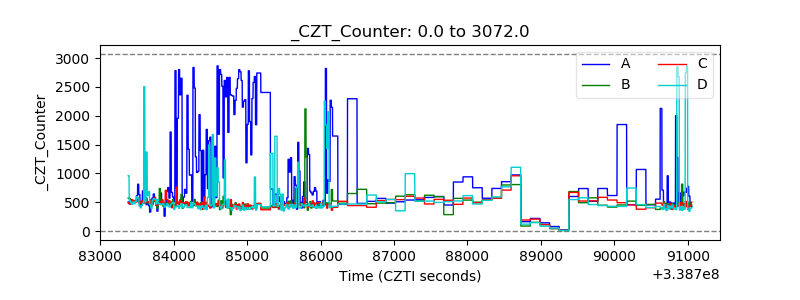 |
| +2.5 Volts monitor |  |
| +5 Volts monitor | 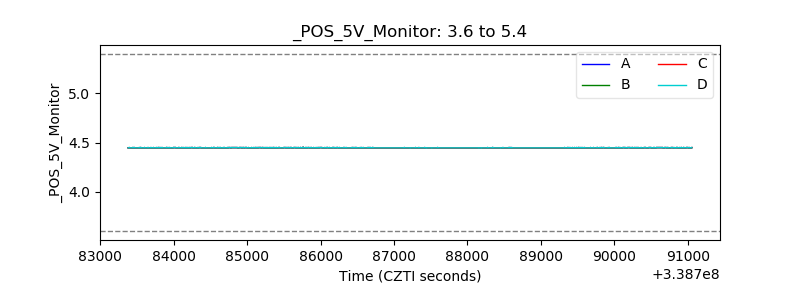 |
| _ROLL_ROT | 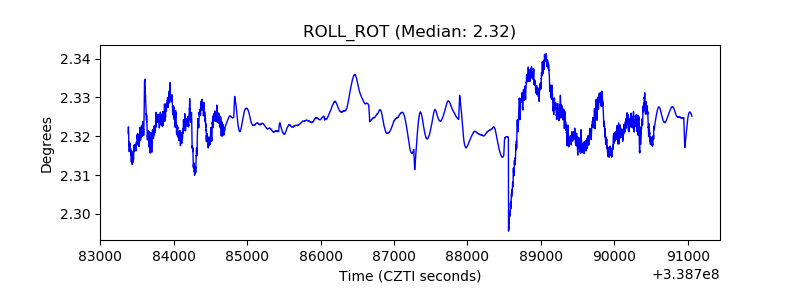 |
| _Roll_DEC | 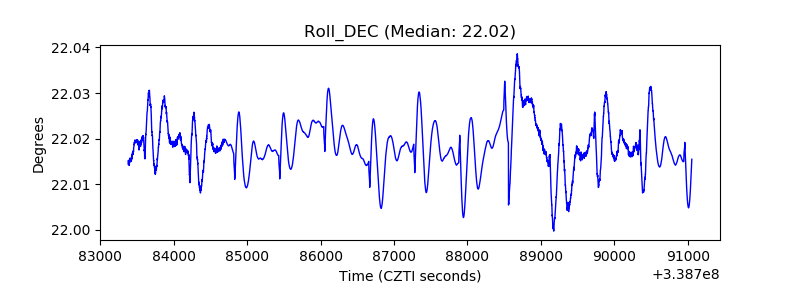 |
| _Roll_RA | 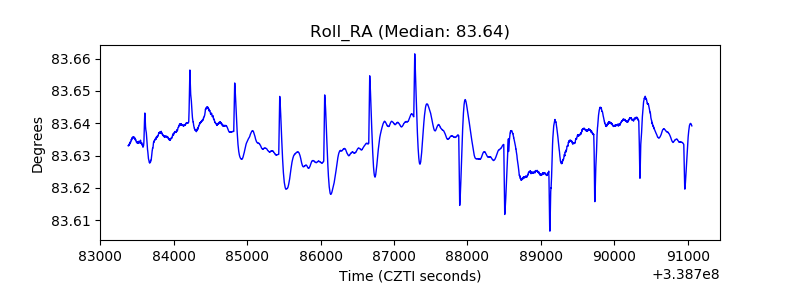 |
| Veto Counter | 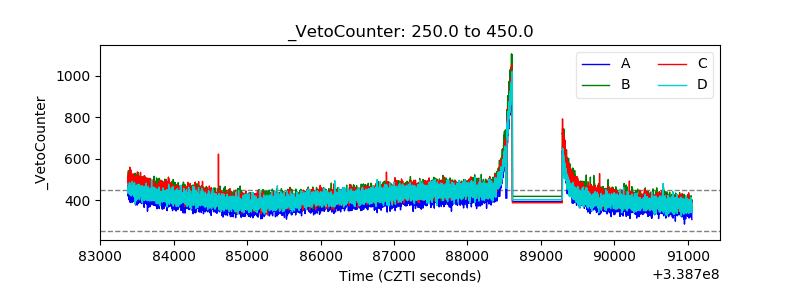 |