| Param | Original file | Final file |
|---|---|---|
| Filename | modeM0/AS1A09_145T01_9000003900_27014cztM0_level2.evt | modeM0/AS1A09_145T01_9000003900_27014cztM0_level2_quad_clean.evt |
| Size (bytes) | 602,835,840 | 99,843,840 |
| Size | 574.9 MB | 95.2 MB |
| Events in quadrant A | 5,059,784 | 632,216 |
| Events in quadrant B | 3,815,016 | 671,039 |
| Events in quadrant C | 3,394,538 | 651,318 |
| Events in quadrant D | 5,523,838 | 591,774 |
| Mode M0 | |||
|---|---|---|---|
| Quadrant | BADHDUFLAG | Total packets | Discarded packets |
| A | 0 | 19395 | 0 |
| B | 0 | 15662 | 0 |
| C | 0 | 14279 | 0 |
| D | 0 | 21046 | 0 |
| Mode M9 | |||
|---|---|---|---|
| Quadrant | BADHDUFLAG | Total packets | Discarded packets |
| A | 0 | 3 | 0 |
| B | 0 | 3 | 0 |
| C | 0 | 3 | 0 |
| D | 0 | 3 | 0 |
| Quadrant | Total seconds | Saturated seconds | Saturation percentage |
|---|---|---|---|
| A | 6845 | 604 | 8.823959% |
| B | 6845 | 184 | 2.688093% |
| C | 6846 | 101 | 1.475314% |
| D | 6846 | 872 | 12.737365% |
Noise dominated data is calculated using 1-second bins in cleaned event files. If a bin has >2000 counts, and if more than 50% of those come from <1% of pixels, then it is considered to be noise-dominated and hence unusable.
| Quadrant | # 1 sec bins | Bins with >0 counts | Bins with >2000 counts | High rate bins dominated by noise | Noise dominated (total time) | Noise dominated (detector-on time) | Marked lightcurve |
|---|---|---|---|---|---|---|---|
| A | 7175 | 6845 | 443 | 443 | 6.17% | 6.47% | 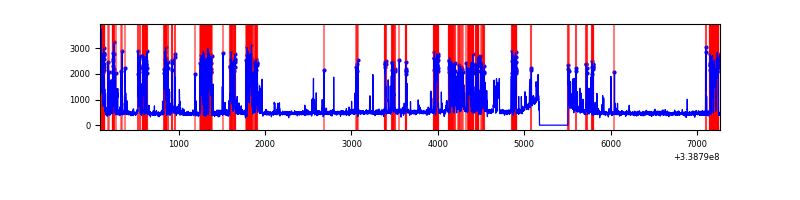 |
| B | 7175 | 6845 | 44 | 44 | 0.61% | 0.64% | 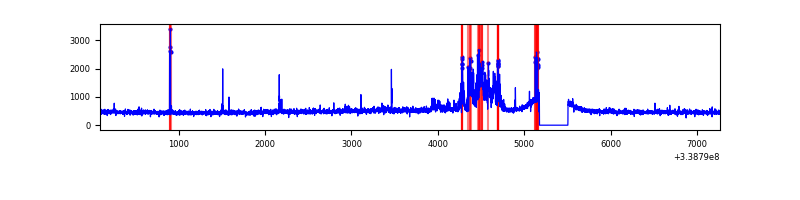 |
| C | 7176 | 6846 | 5 | 5 | 0.07% | 0.07% | 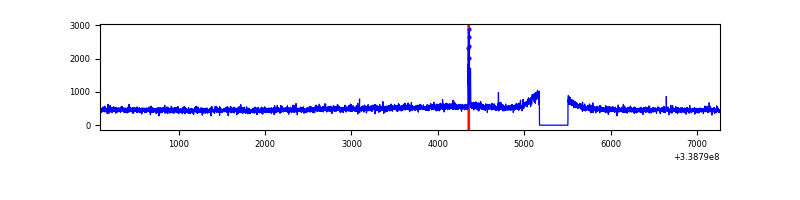 |
| D | 7176 | 6846 | 807 | 807 | 11.25% | 11.79% | 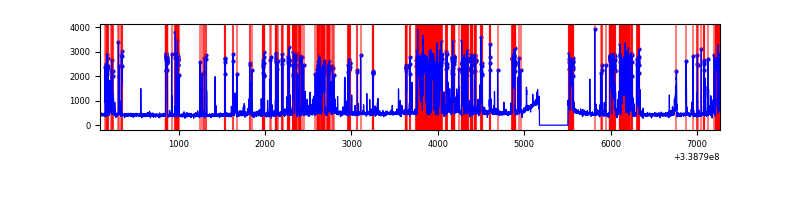 |
Top three noisy pixels from each quadrant. If the there are fewer than three noisy pixels in the level2.evt file, extra rows are filled as -1
| Pixel properties | Quadrant properties | ||||||
|---|---|---|---|---|---|---|---|
| Quadrant | DetID | PixID | Counts | Sigma | Mean | Median | Sigma |
| A | 6 | 16 | 1049925 | 6211.15 | 834 | 820 | 168.9 |
| A | 14 | 235 | 784172 | 4637.78 | 834 | 820 | 168.9 |
| A | 13 | 254 | 10686 | 58.41 | 834 | 820 | 168.9 |
| B | 0 | 189 | 380830 | 2303.27 | 849 | 828 | 165.0 |
| B | 10 | 245 | 55871 | 333.62 | 849 | 828 | 165.0 |
| B | 0 | 219 | 19956 | 115.94 | 849 | 828 | 165.0 |
| C | 14 | 238 | 133428 | 682.03 | 824 | 832 | 194.4 |
| C | 10 | 22 | 28540 | 142.52 | 824 | 832 | 194.4 |
| C | 5 | 218 | 11726 | 56.04 | 824 | 832 | 194.4 |
| D | 1 | 52 | 2525341 | 13488.16 | 778 | 759 | 187.2 |
| D | 2 | 250 | 48054 | 252.68 | 778 | 759 | 187.2 |
| D | 2 | 234 | 26080 | 135.28 | 778 | 759 | 187.2 |
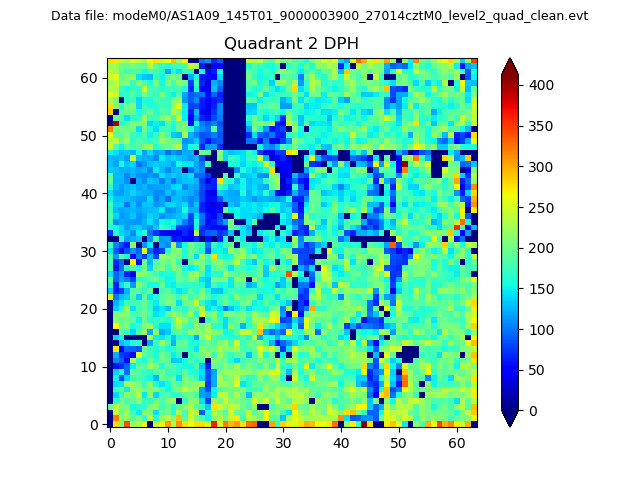
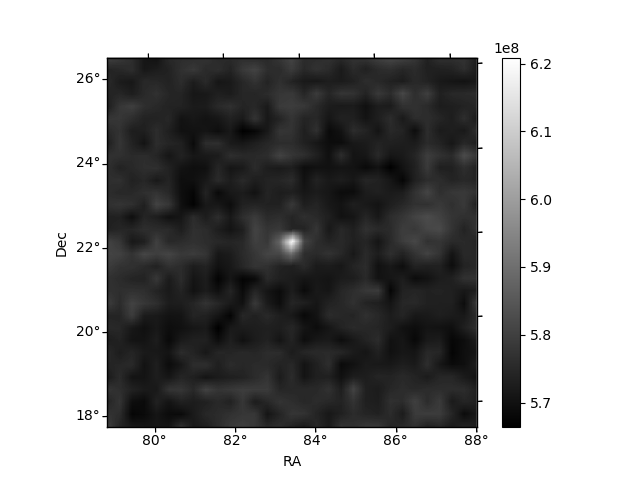
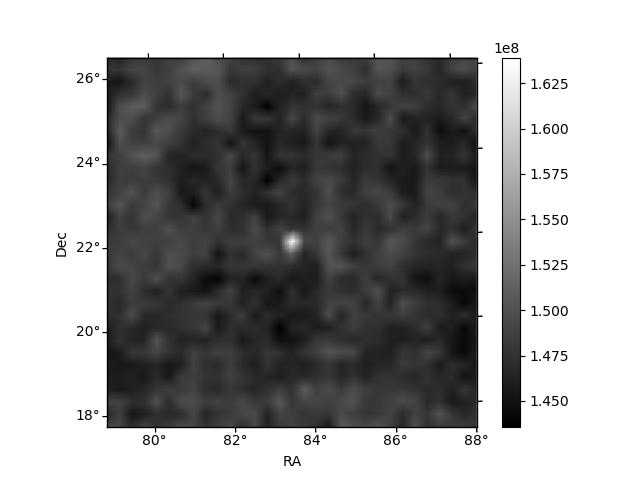
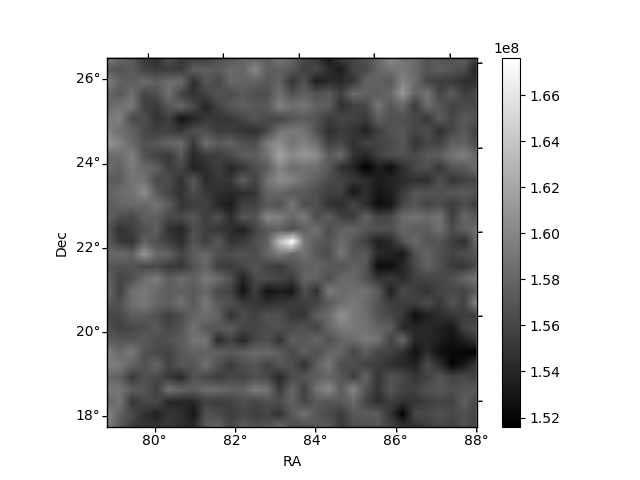
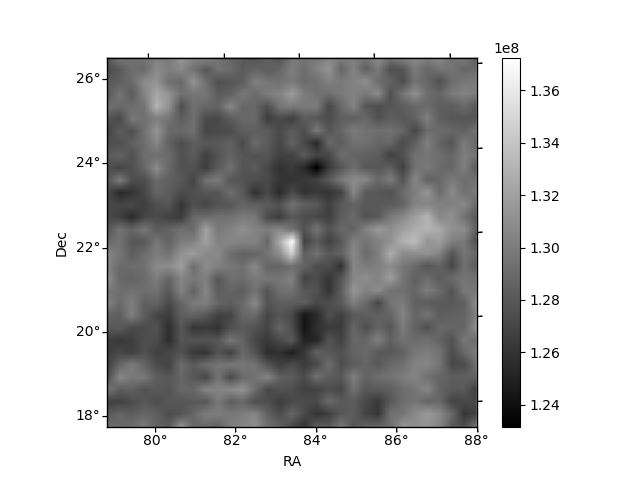
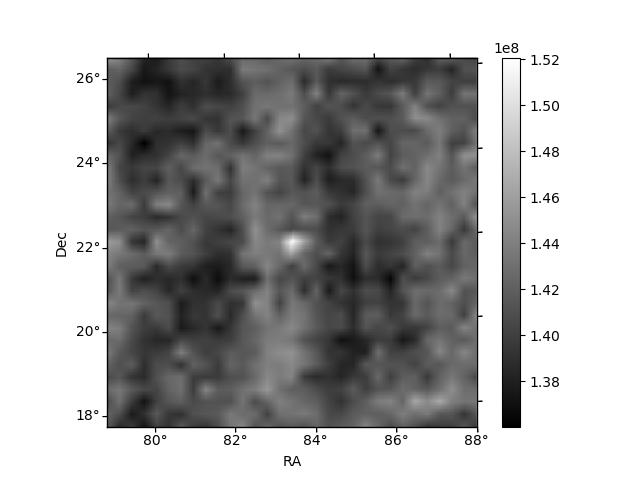
Histogram calculated using DETX and DETY for each event in the final _common_clean file
| Quadrant A | 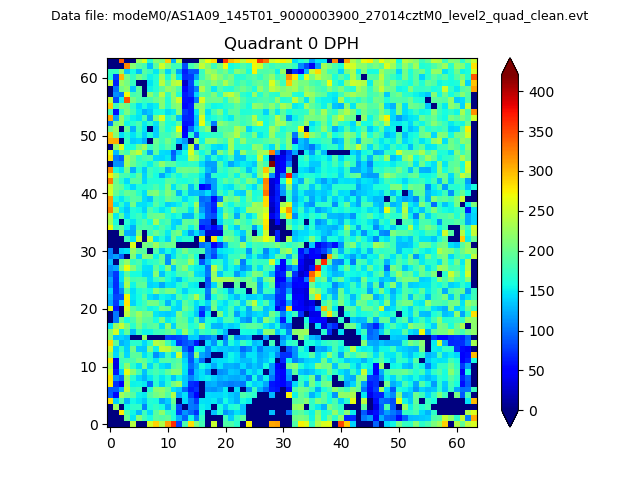 |
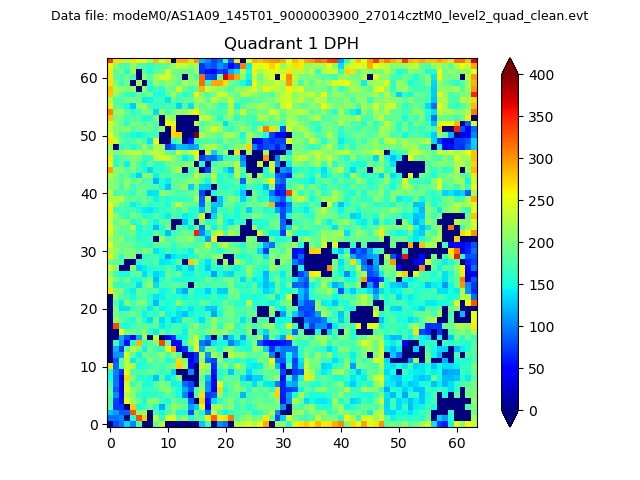 |
Quadrant B |
|---|---|---|---|
| Quadrant D | 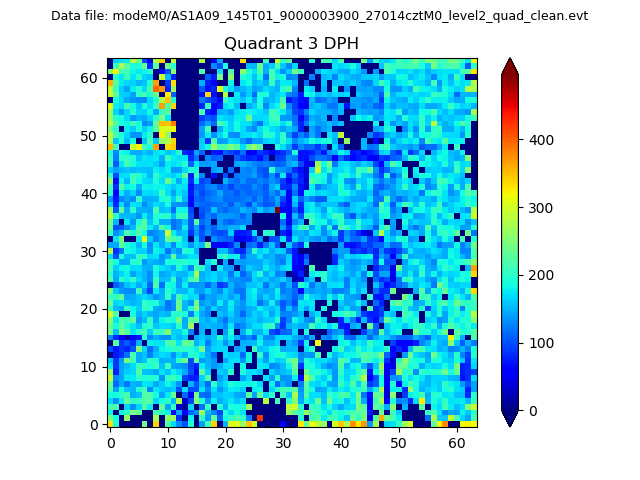 |
 |
Quadrant C |
| Plot type | Count rate plots | Images |
|---|---|---|
| Comparison with Poisson distribution Blue bars denote a histogram of data divided into 1 sec bins. Red curve is a Poisson curve with rate = median count rate of data. |
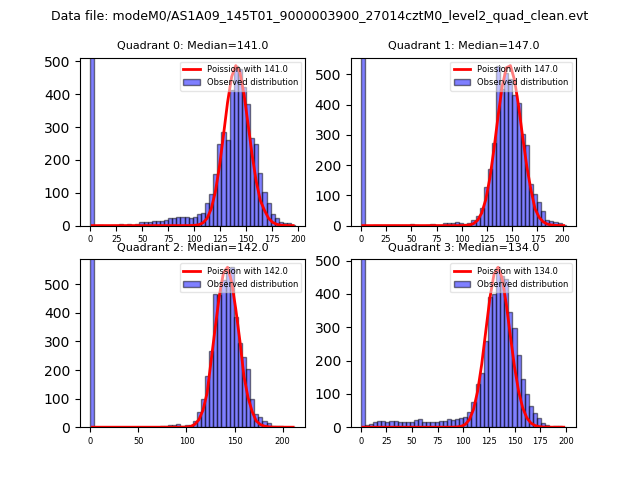 |
 |
| Quadrant-wise count rates Data is divided into 100 sec bins |
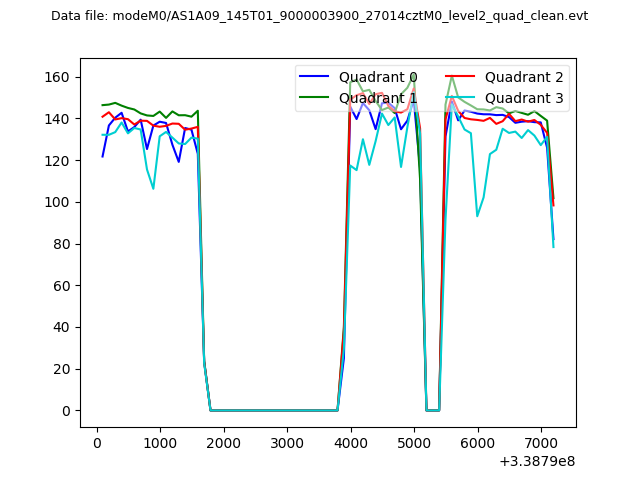 |
|
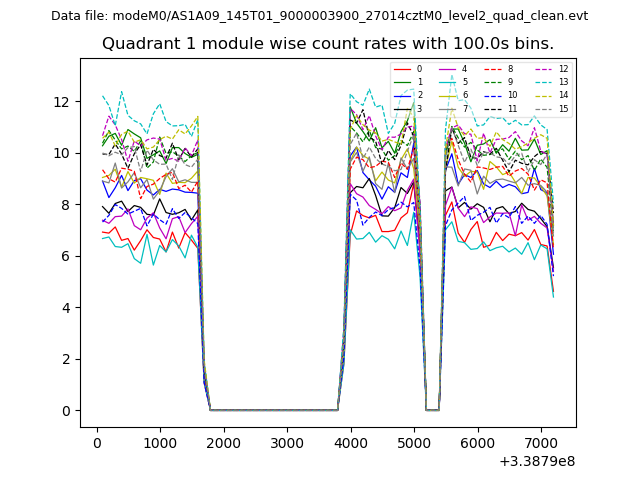
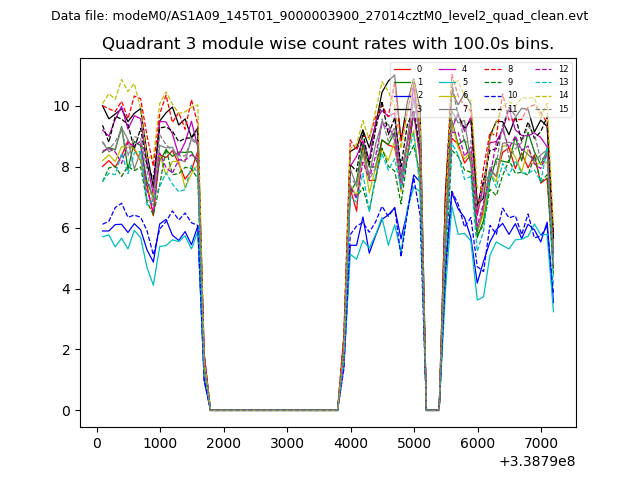
| Module-wise count rates for Quadrant A Data is divided into 100 sec bins |
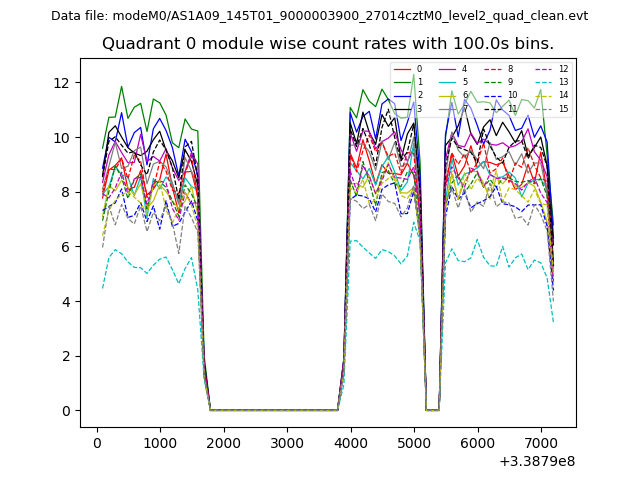 |
 |
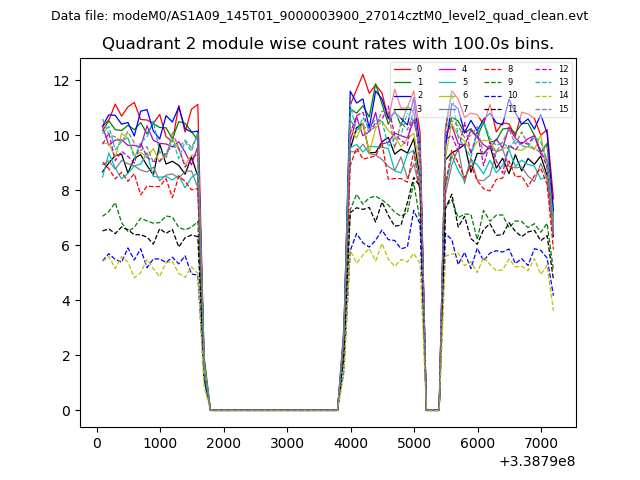
| Module-wise count rates for Quadrant B Data is divided into 100 sec bins |
 |
 |
| Module-wise count rates for Quadrant C Data is divided into 100 sec bins |
 |
 |
| Module-wise count rates for Quadrant D Data is divided into 100 sec bins |
 |
 |
| Parameter | Plot |
|---|---|
| CZT HV Monitor | 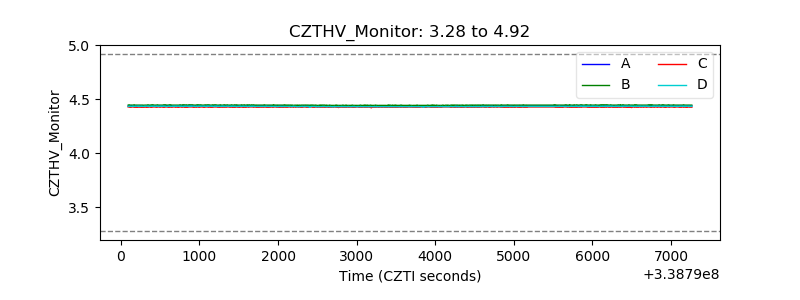 |
| D_VDD | 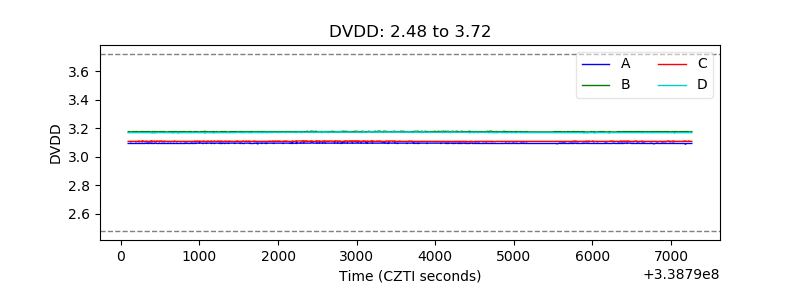 |
| Temperature 1 | 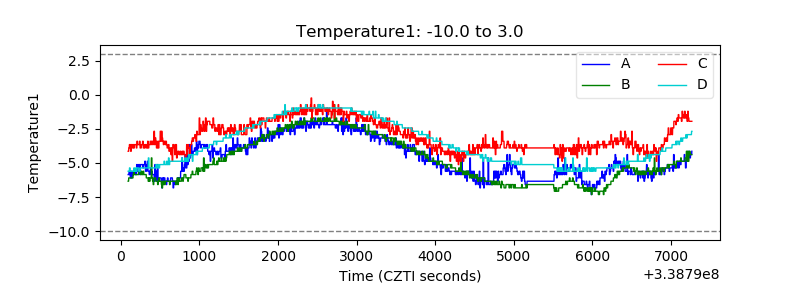 |
| Veto HV Monitor | 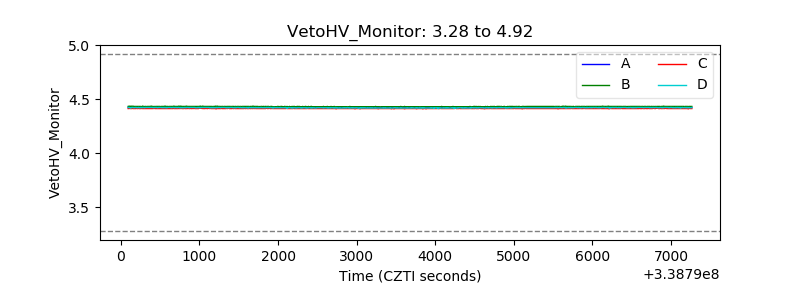 |
| Veto LLD | 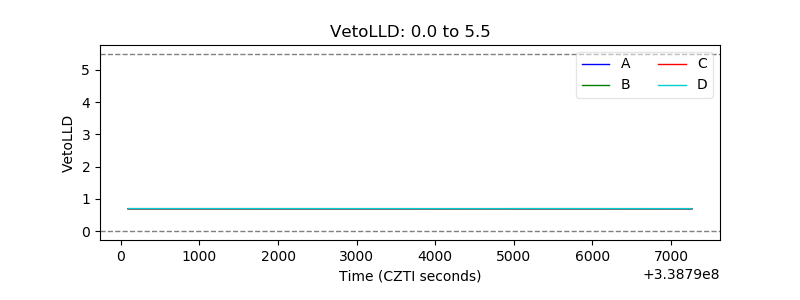 |
| Alpha Counter | 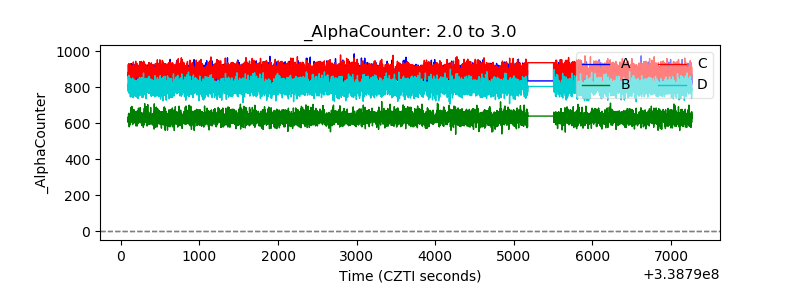 |
| _CPM_Rate | 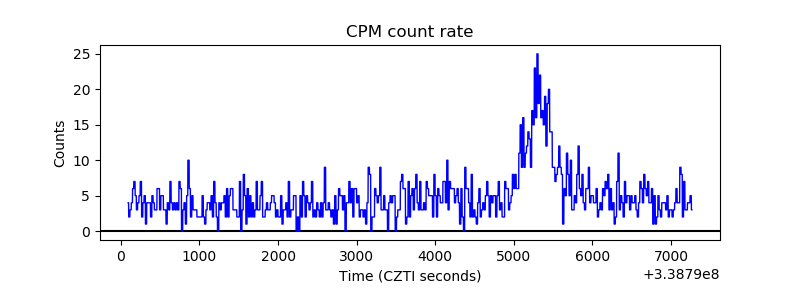 |
| CZT Counter | 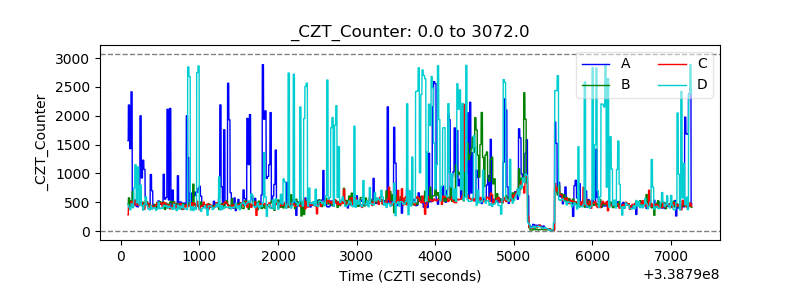 |
| +2.5 Volts monitor |  |
| +5 Volts monitor |  |
| _ROLL_ROT | 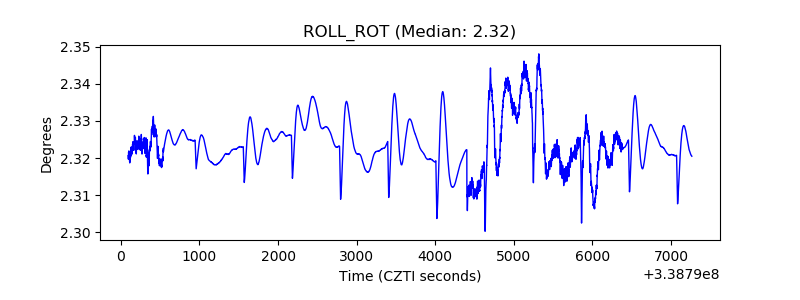 |
| _Roll_DEC | 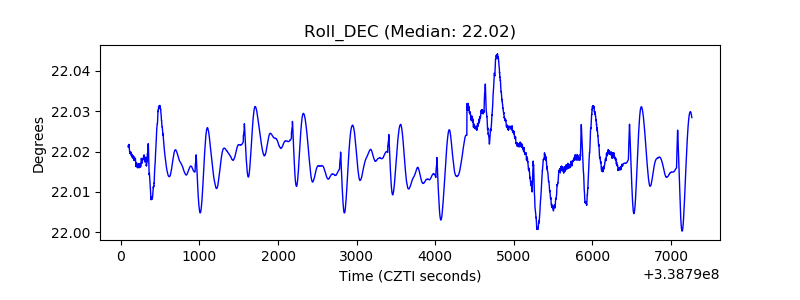 |
| _Roll_RA | 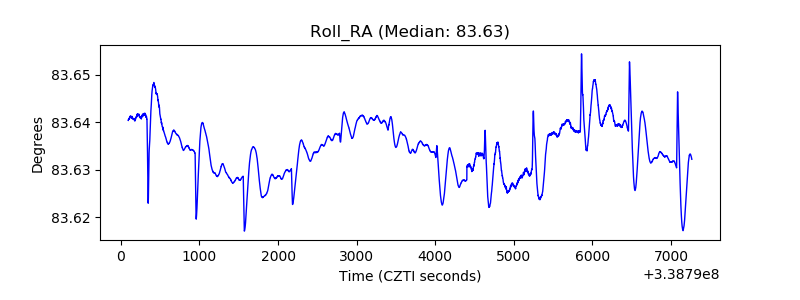 |
| Veto Counter | 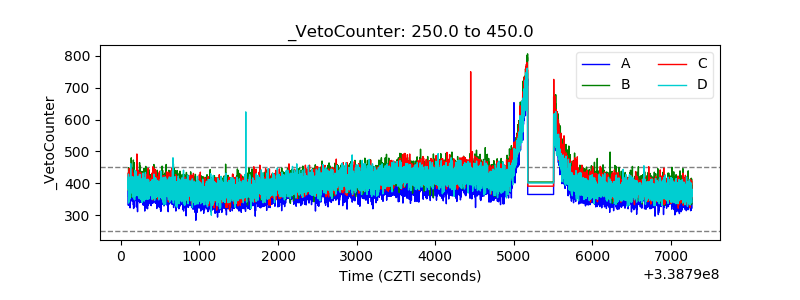 |