| Param | Original file | Final file |
|---|---|---|
| Filename | modeM0/AS1A09_145T01_9000003900_27015cztM0_level2.evt | modeM0/AS1A09_145T01_9000003900_27015cztM0_level2_quad_clean.evt |
| Size (bytes) | 575,634,240 | 99,987,840 |
| Size | 549.0 MB | 95.4 MB |
| Events in quadrant A | 5,472,672 | 617,643 |
| Events in quadrant B | 3,853,904 | 663,574 |
| Events in quadrant C | 3,414,728 | 643,924 |
| Events in quadrant D | 4,224,258 | 622,292 |
| Mode M0 | |||
|---|---|---|---|
| Quadrant | BADHDUFLAG | Total packets | Discarded packets |
| A | 0 | 20724 | 0 |
| B | 0 | 15747 | 0 |
| C | 0 | 14300 | 0 |
| D | 0 | 17147 | 0 |
| Mode M9 | |||
|---|---|---|---|
| Quadrant | BADHDUFLAG | Total packets | Discarded packets |
| A | 0 | 1 | 0 |
| B | 0 | 1 | 0 |
| C | 0 | 1 | 0 |
| D | 0 | 1 | 0 |
| Quadrant | Total seconds | Saturated seconds | Saturation percentage |
|---|---|---|---|
| A | 6889 | 933 | 13.543330% |
| B | 6890 | 338 | 4.905660% |
| C | 6890 | 237 | 3.439768% |
| D | 6889 | 392 | 5.690231% |
Noise dominated data is calculated using 1-second bins in cleaned event files. If a bin has >2000 counts, and if more than 50% of those come from <1% of pixels, then it is considered to be noise-dominated and hence unusable.
| Quadrant | # 1 sec bins | Bins with >0 counts | Bins with >2000 counts | High rate bins dominated by noise | Noise dominated (total time) | Noise dominated (detector-on time) | Marked lightcurve |
|---|---|---|---|---|---|---|---|
| A | 6989 | 6889 | 684 | 684 | 9.79% | 9.93% | 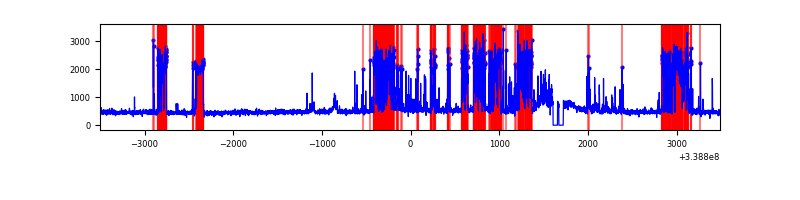 |
| B | 6990 | 6890 | 76 | 76 | 1.09% | 1.10% | 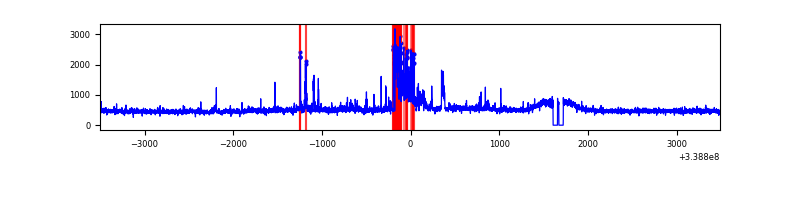 |
| C | 6990 | 6890 | 0 | 0 | 0.00% | 0.00% | 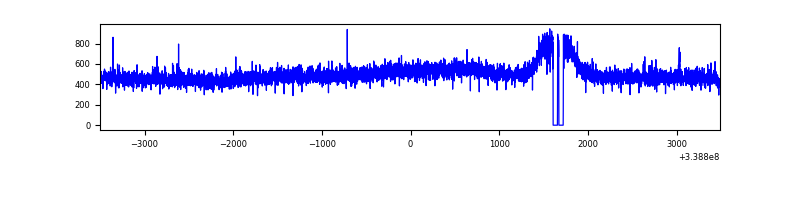 |
| D | 6989 | 6889 | 230 | 230 | 3.29% | 3.34% | 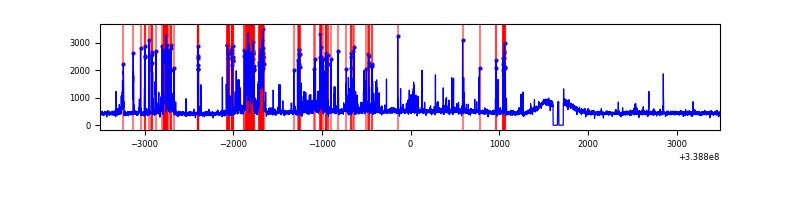 |
Top three noisy pixels from each quadrant. If the there are fewer than three noisy pixels in the level2.evt file, extra rows are filled as -1
| Pixel properties | Quadrant properties | ||||||
|---|---|---|---|---|---|---|---|
| Quadrant | DetID | PixID | Counts | Sigma | Mean | Median | Sigma |
| A | 6 | 16 | 1710386 | 9987.81 | 835 | 820 | 171.2 |
| A | 14 | 235 | 540087 | 3150.56 | 835 | 820 | 171.2 |
| A | 13 | 254 | 9573 | 51.14 | 835 | 820 | 171.2 |
| B | 10 | 245 | 334336 | 1980.78 | 859 | 835 | 168.4 |
| B | 0 | 189 | 97316 | 573.03 | 859 | 835 | 168.4 |
| B | 10 | 246 | 30335 | 175.21 | 859 | 835 | 168.4 |
| C | 14 | 238 | 134552 | 676.04 | 834 | 840 | 197.8 |
| C | 5 | 218 | 12222 | 57.55 | 834 | 840 | 197.8 |
| C | 3 | 233 | 6439 | 28.31 | 834 | 840 | 197.8 |
| D | 1 | 52 | 726035 | 3632.54 | 833 | 812 | 199.6 |
| D | 12 | 233 | 198380 | 989.59 | 833 | 812 | 199.6 |
| D | 2 | 250 | 103095 | 512.32 | 833 | 812 | 199.6 |
Histogram calculated using DETX and DETY for each event in the final _common_clean file
| Quadrant A | 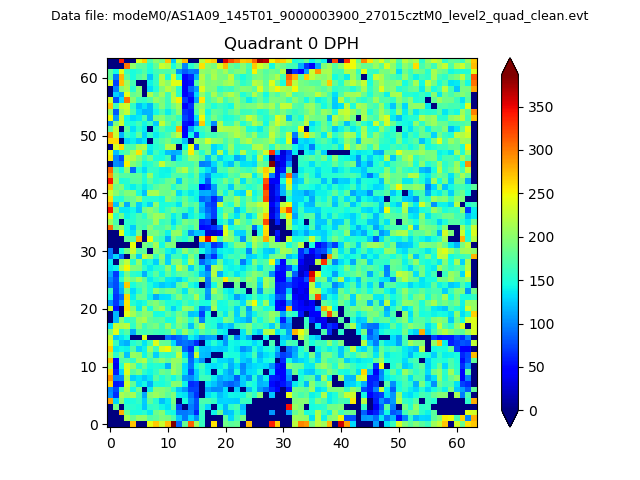 |
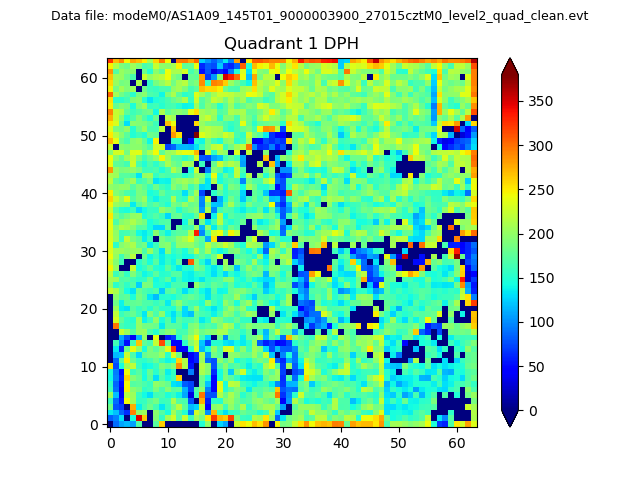 |
Quadrant B |
|---|---|---|---|
| Quadrant D | 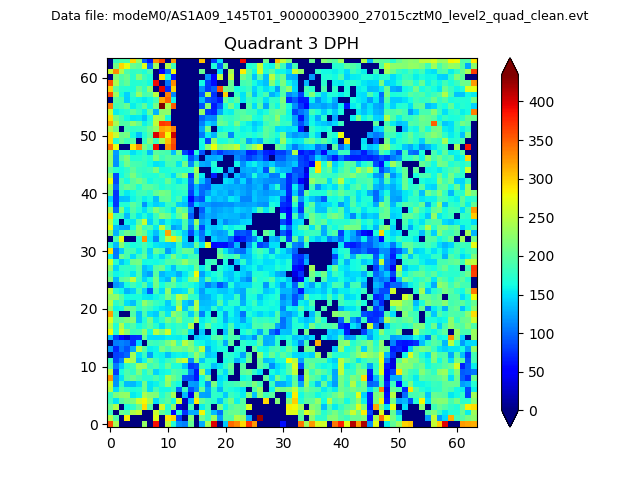 |
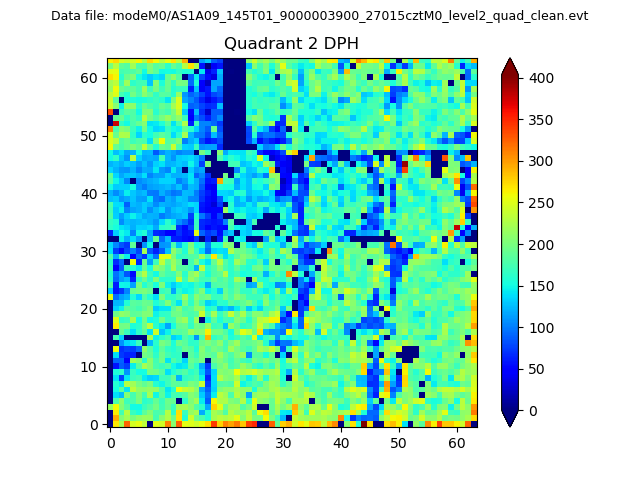 |
Quadrant C |
| Plot type | Count rate plots | Images |
|---|---|---|
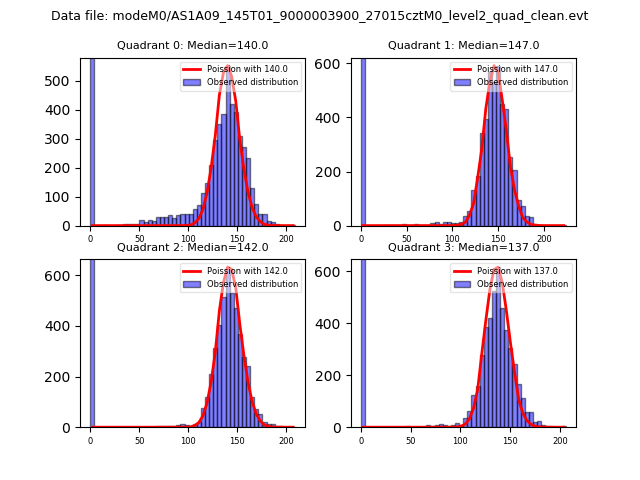
| Comparison with Poisson distribution Blue bars denote a histogram of data divided into 1 sec bins. Red curve is a Poisson curve with rate = median count rate of data. |
 |
 |
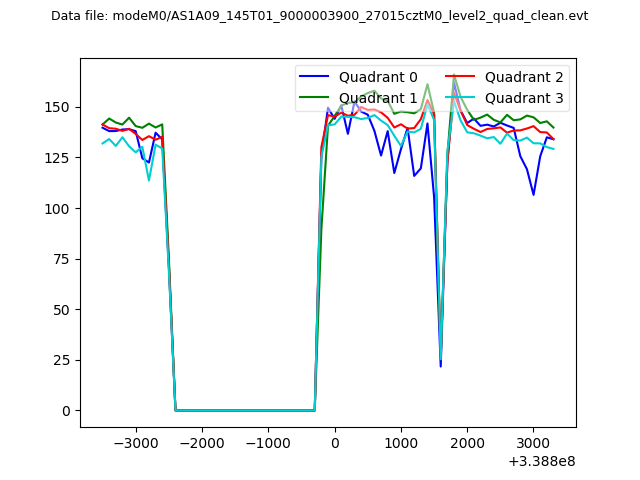
| Quadrant-wise count rates Data is divided into 100 sec bins |
 |
|
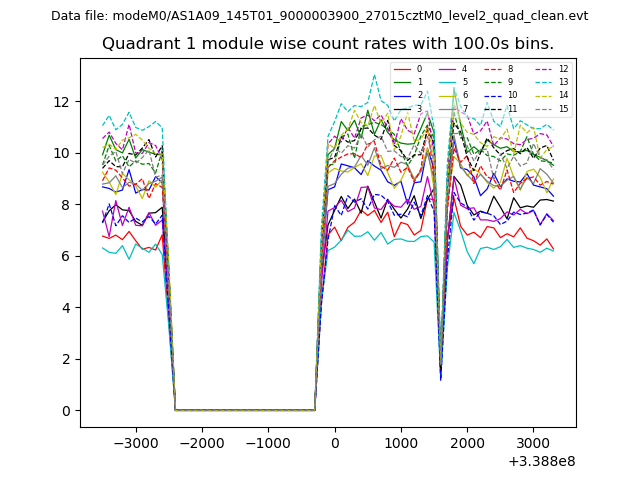
| Module-wise count rates for Quadrant A Data is divided into 100 sec bins |
 |
 |
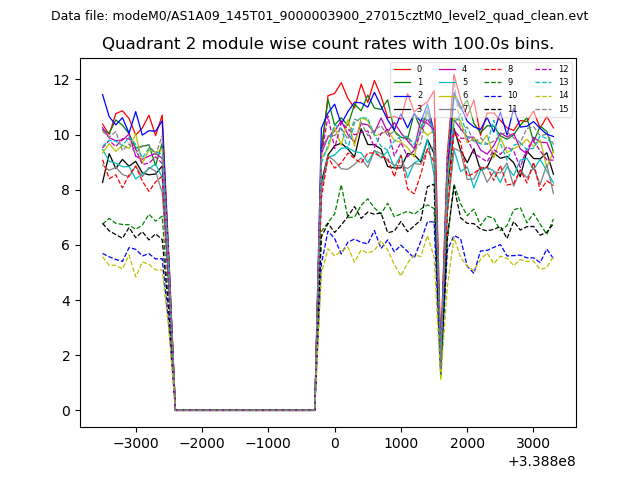
| Module-wise count rates for Quadrant B Data is divided into 100 sec bins |
 |
 |
| Module-wise count rates for Quadrant C Data is divided into 100 sec bins |
 |
 |
| Module-wise count rates for Quadrant D Data is divided into 100 sec bins |
 |
 |
| Parameter | Plot |
|---|---|
| CZT HV Monitor | 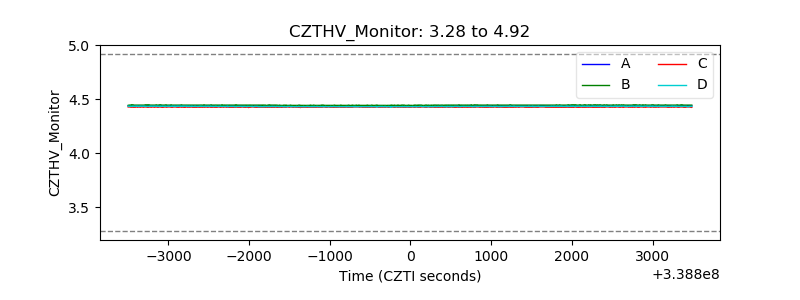 |
| D_VDD | 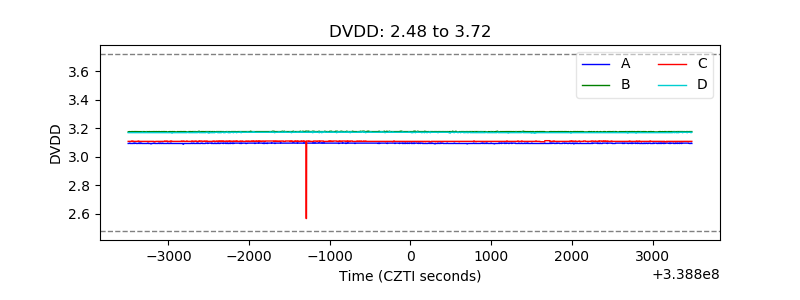 |
| Temperature 1 | 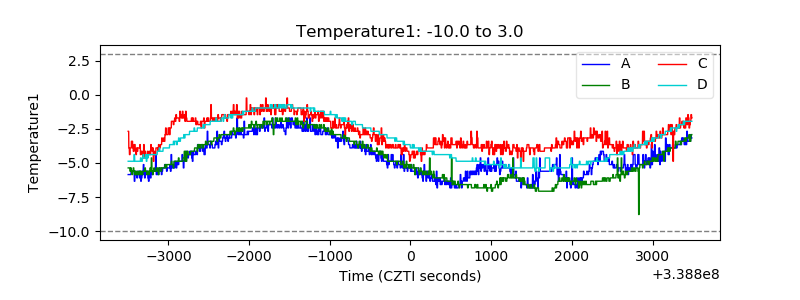 |
| Veto HV Monitor | 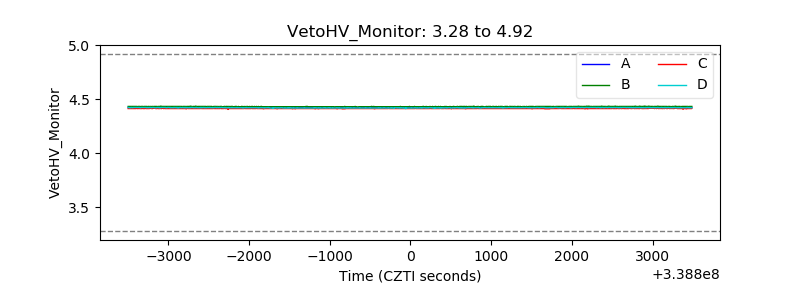 |
| Veto LLD | 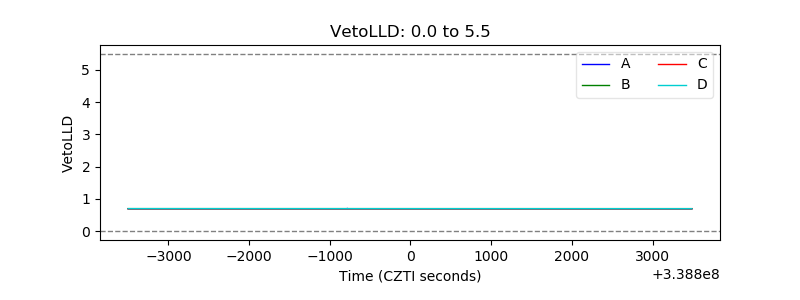 |
| Alpha Counter | 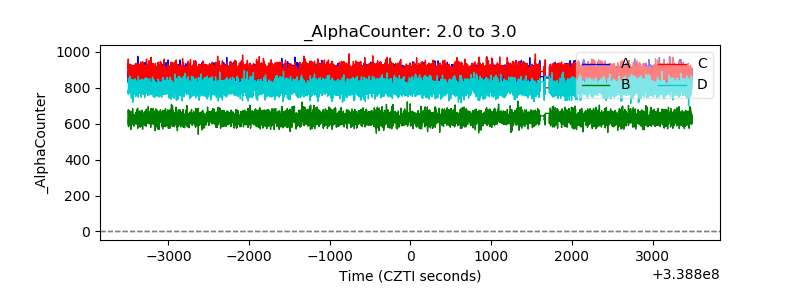 |
| _CPM_Rate | 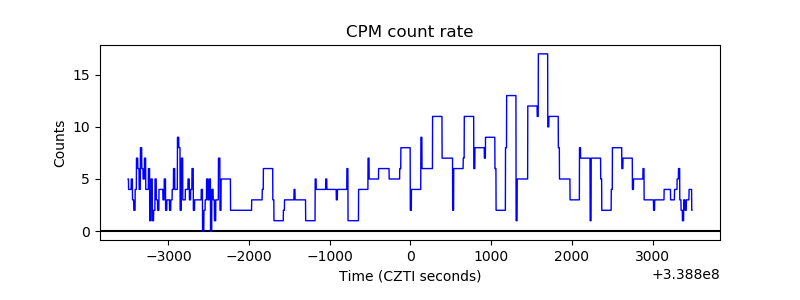 |
| CZT Counter | 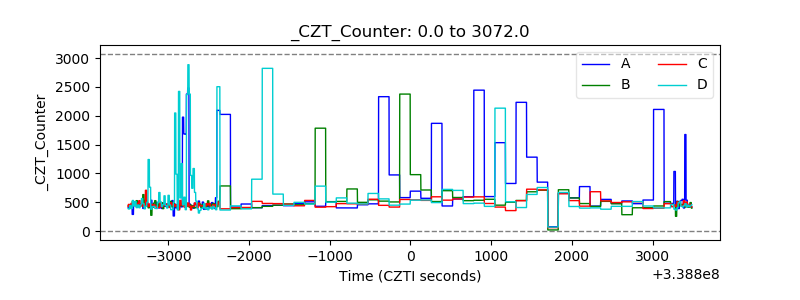 |
| +2.5 Volts monitor |  |
| +5 Volts monitor |  |
| _ROLL_ROT |  |
| _Roll_DEC | 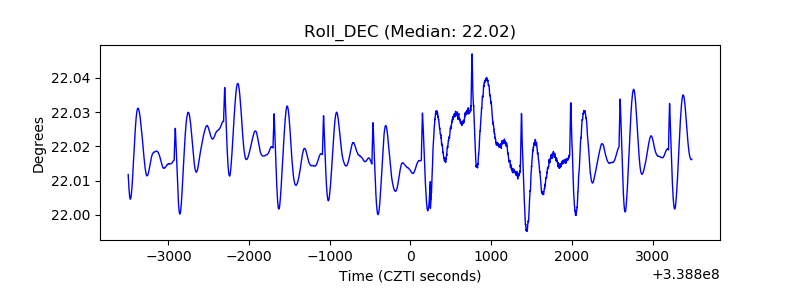 |
| _Roll_RA | 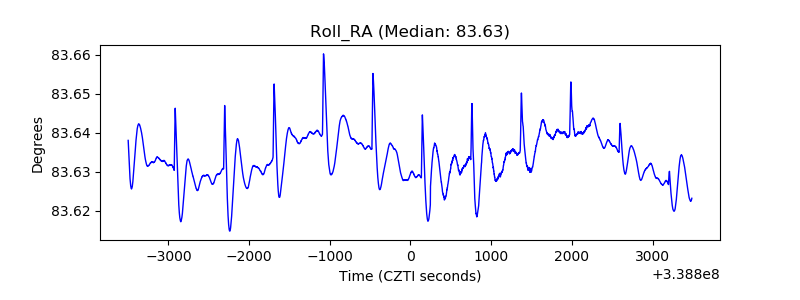 |
| Veto Counter |  |