| Param | Original file | Final file |
|---|---|---|
| Filename | modeM0/AS1A09_145T01_9000003900_27019cztM0_level2.evt | modeM0/AS1A09_145T01_9000003900_27019cztM0_level2_quad_clean.evt |
| Size (bytes) | 1,603,082,880 | 215,599,680 |
| Size | 1.5 GB | 205.6 MB |
| Events in quadrant A | 18,984,963 | 1,224,672 |
| Events in quadrant B | 9,633,537 | 1,414,966 |
| Events in quadrant C | 8,618,801 | 1,360,195 |
| Events in quadrant D | 10,129,858 | 1,320,322 |
| Mode M0 | |||
|---|---|---|---|
| Quadrant | BADHDUFLAG | Total packets | Discarded packets |
| A | 0 | 68158 | 0 |
| B | 0 | 39067 | 0 |
| C | 0 | 35846 | 0 |
| D | 0 | 41369 | 0 |
| Mode M9 | |||
|---|---|---|---|
| Quadrant | BADHDUFLAG | Total packets | Discarded packets |
| A | 0 | 17 | 0 |
| B | 0 | 17 | 0 |
| C | 0 | 17 | 0 |
| D | 0 | 17 | 0 |
| Quadrant | Total seconds | Saturated seconds | Saturation percentage |
|---|---|---|---|
| A | 17526 | 3871 | 22.087185% |
| B | 17527 | 373 | 2.128145% |
| C | 17527 | 239 | 1.363610% |
| D | 17527 | 399 | 2.276488% |
Noise dominated data is calculated using 1-second bins in cleaned event files. If a bin has >2000 counts, and if more than 50% of those come from <1% of pixels, then it is considered to be noise-dominated and hence unusable.
| Quadrant | # 1 sec bins | Bins with >0 counts | Bins with >2000 counts | High rate bins dominated by noise | Noise dominated (total time) | Noise dominated (detector-on time) | Marked lightcurve |
|---|---|---|---|---|---|---|---|
| A | 19241 | 17526 | 2870 | 2870 | 14.92% | 16.38% | 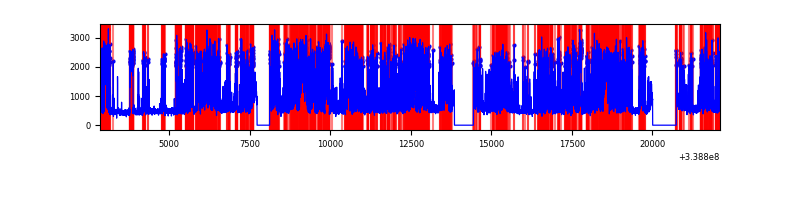 |
| B | 19242 | 17527 | 131 | 131 | 0.68% | 0.75% | 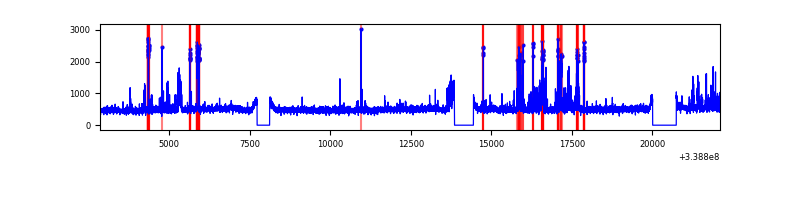 |
| C | 19242 | 17527 | 0 | 0 | 0.00% | 0.00% | 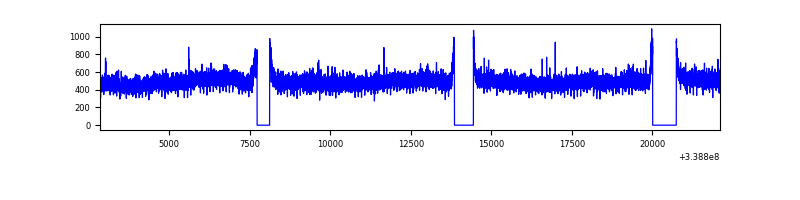 |
| D | 19242 | 17527 | 264 | 264 | 1.37% | 1.51% | 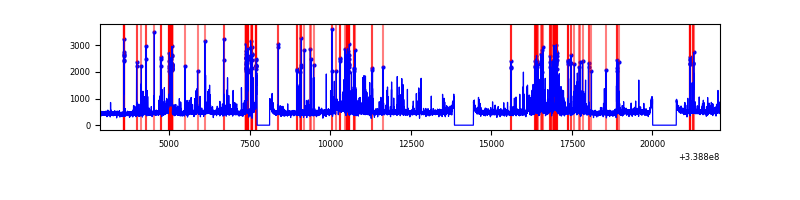 |
Top three noisy pixels from each quadrant. If the there are fewer than three noisy pixels in the level2.evt file, extra rows are filled as -1
| Pixel properties | Quadrant properties | ||||||
|---|---|---|---|---|---|---|---|
| Quadrant | DetID | PixID | Counts | Sigma | Mean | Median | Sigma |
| A | 14 | 235 | 8754681 | 21568.49 | 2016 | 1976 | 405.8 |
| A | 6 | 16 | 2385302 | 5873.01 | 2016 | 1976 | 405.8 |
| A | 8 | 192 | 42048 | 98.75 | 2016 | 1976 | 405.8 |
| B | 0 | 189 | 921764 | 2222.25 | 2170 | 2121 | 413.8 |
| B | 3 | 64 | 71635 | 167.98 | 2170 | 2121 | 413.8 |
| B | 0 | 219 | 62041 | 144.79 | 2170 | 2121 | 413.8 |
| C | 14 | 238 | 336932 | 675.18 | 2105 | 2122 | 495.9 |
| C | 3 | 233 | 26076 | 48.31 | 2105 | 2122 | 495.9 |
| C | 5 | 218 | 18527 | 33.08 | 2105 | 2122 | 495.9 |
| D | 1 | 52 | 960403 | 1894.79 | 2110 | 2060 | 505.8 |
| D | 2 | 250 | 838006 | 1652.8 | 2110 | 2060 | 505.8 |
| D | 12 | 233 | 185622 | 362.93 | 2110 | 2060 | 505.8 |
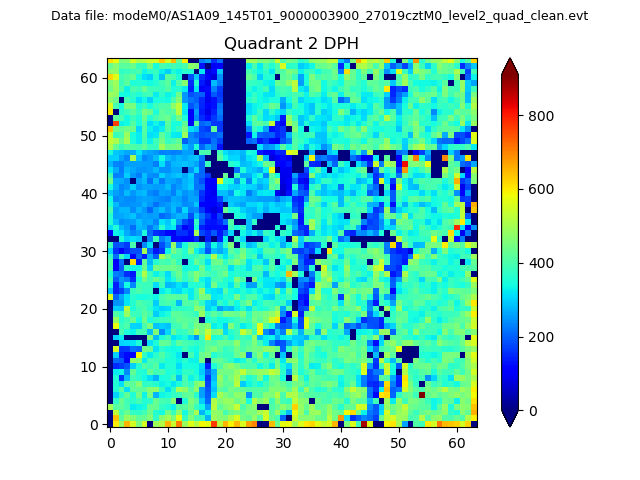
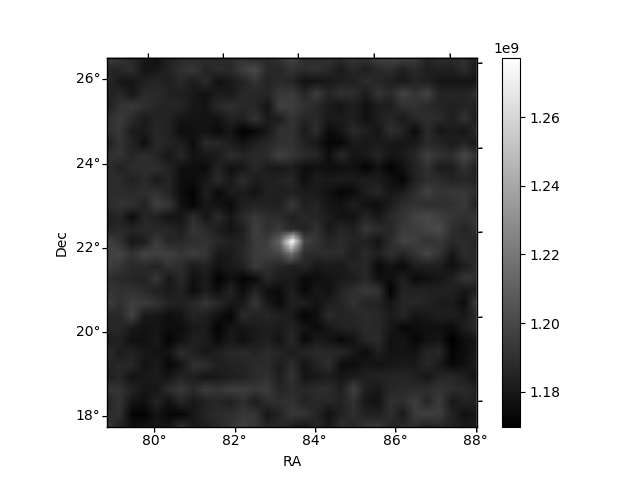
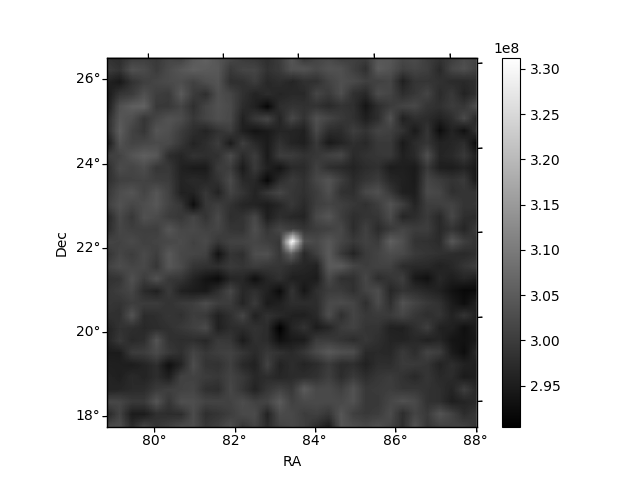
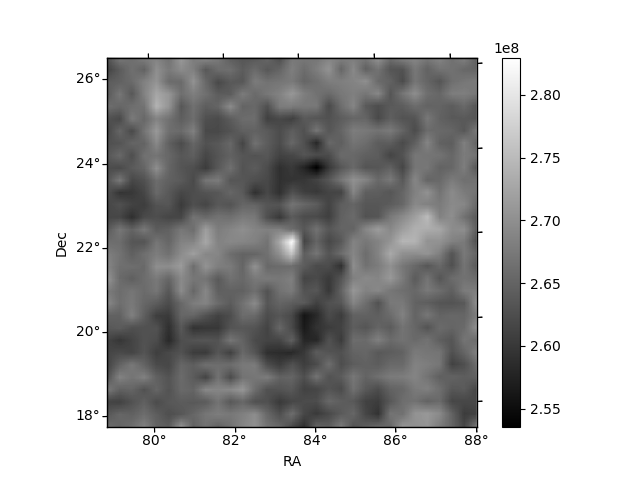
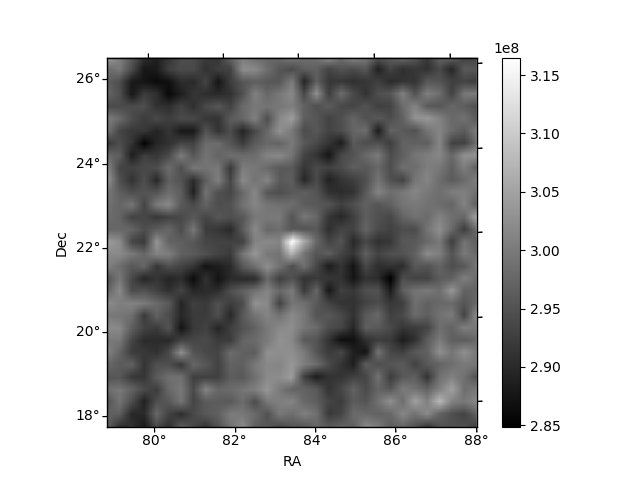
Histogram calculated using DETX and DETY for each event in the final _common_clean file
| Quadrant A | 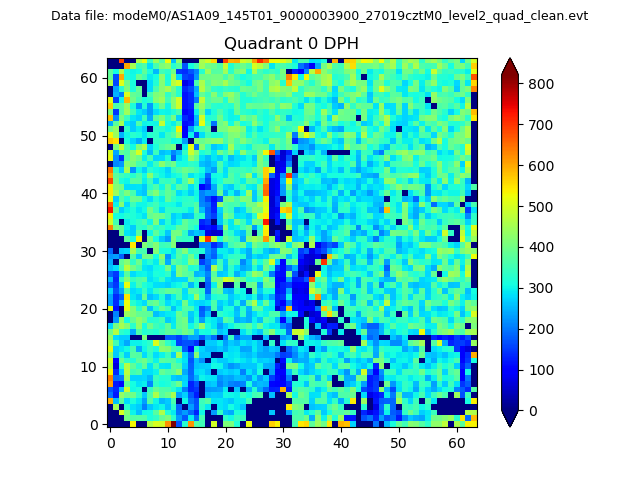 |
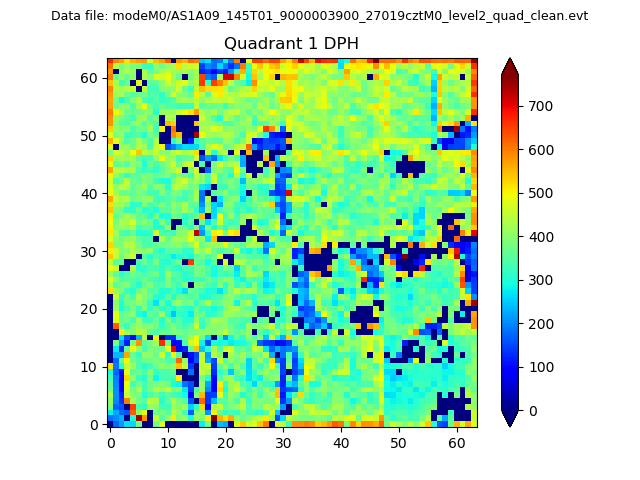 |
Quadrant B |
|---|---|---|---|
| Quadrant D | 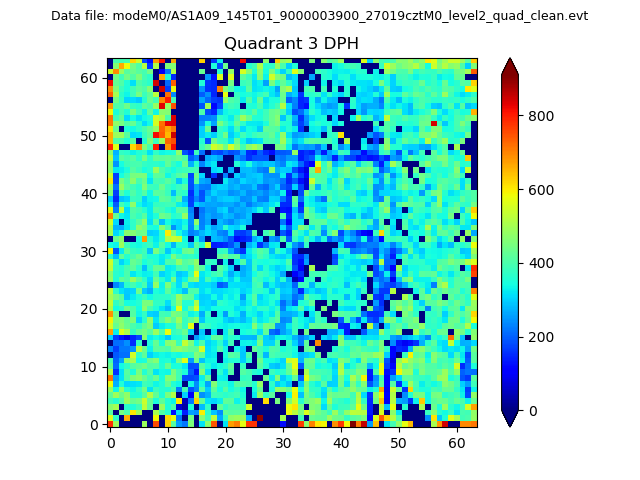 |
 |
Quadrant C |
| Plot type | Count rate plots | Images |
|---|---|---|
| Comparison with Poisson distribution Blue bars denote a histogram of data divided into 1 sec bins. Red curve is a Poisson curve with rate = median count rate of data. |
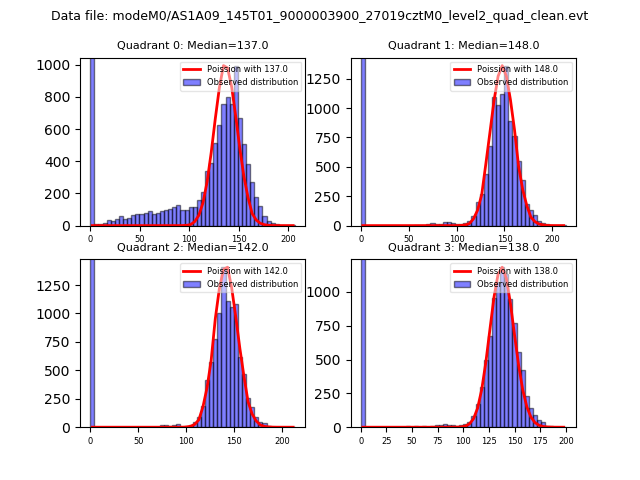 |
 |
| Quadrant-wise count rates Data is divided into 100 sec bins |
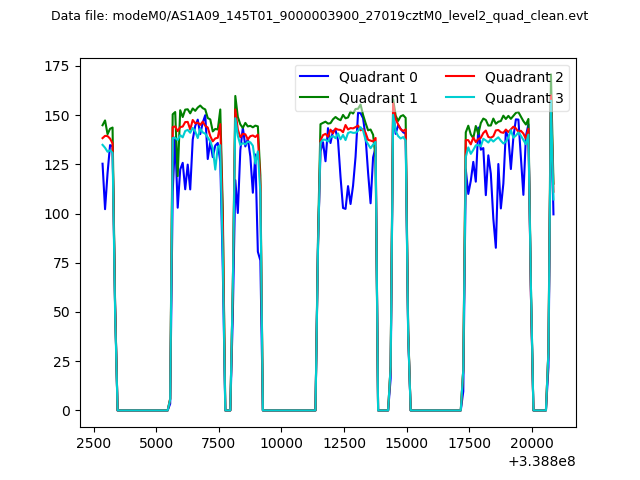 |
|
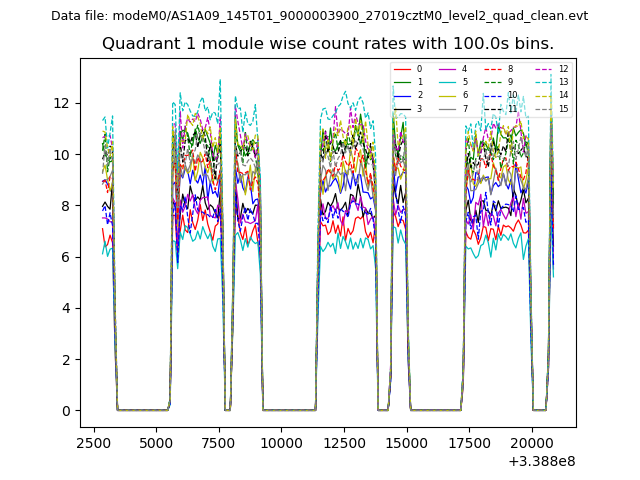
| Module-wise count rates for Quadrant A Data is divided into 100 sec bins |
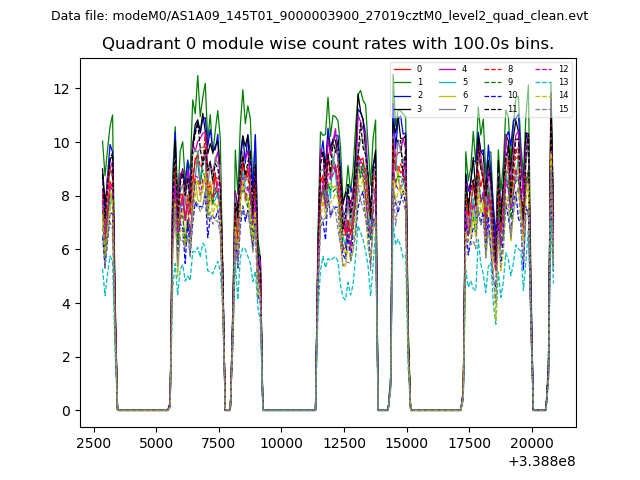 |
 |
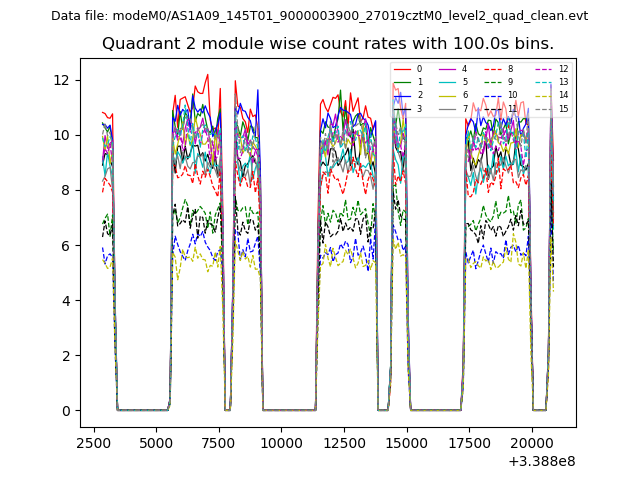
| Module-wise count rates for Quadrant B Data is divided into 100 sec bins |
 |
 |
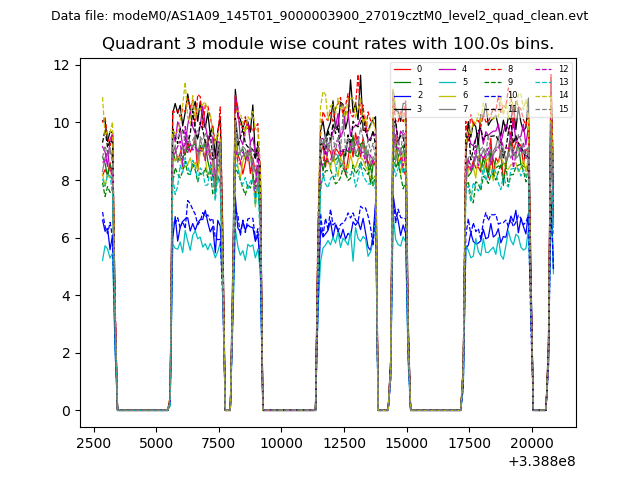
| Module-wise count rates for Quadrant C Data is divided into 100 sec bins |
 |
 |
| Module-wise count rates for Quadrant D Data is divided into 100 sec bins |
 |
 |
| Parameter | Plot |
|---|---|
| CZT HV Monitor | 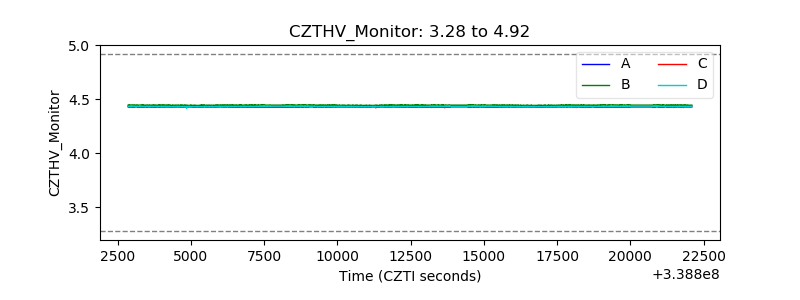 |
| D_VDD | 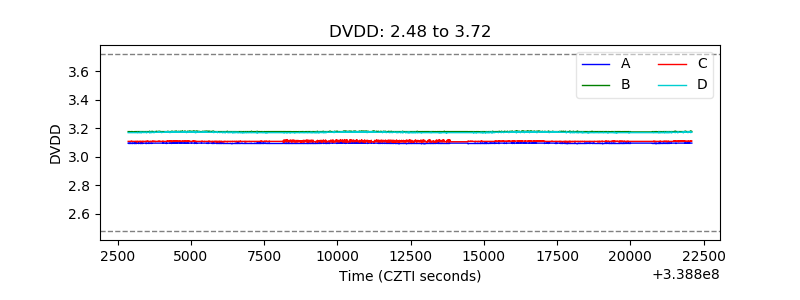 |
| Temperature 1 | 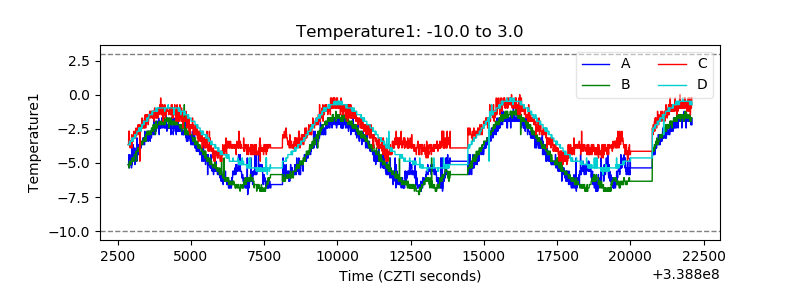 |
| Veto HV Monitor | 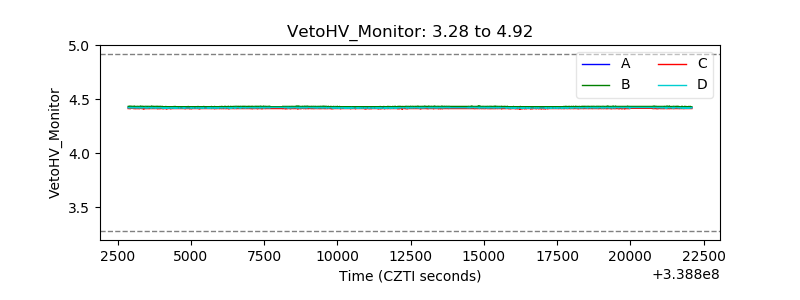 |
| Veto LLD | 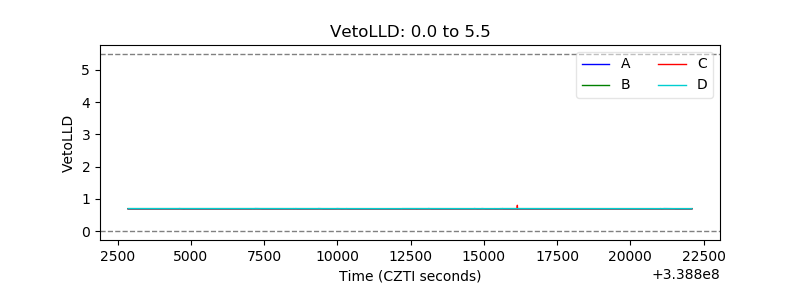 |
| Alpha Counter | 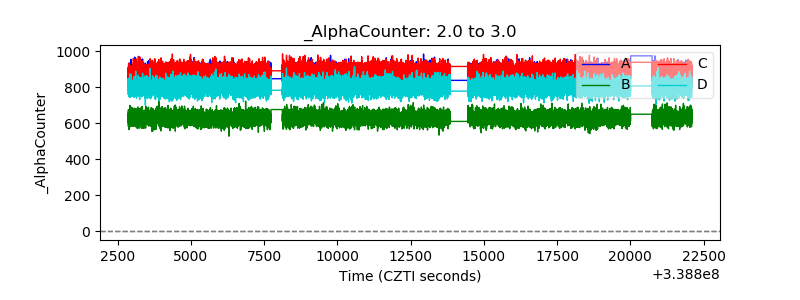 |
| _CPM_Rate | 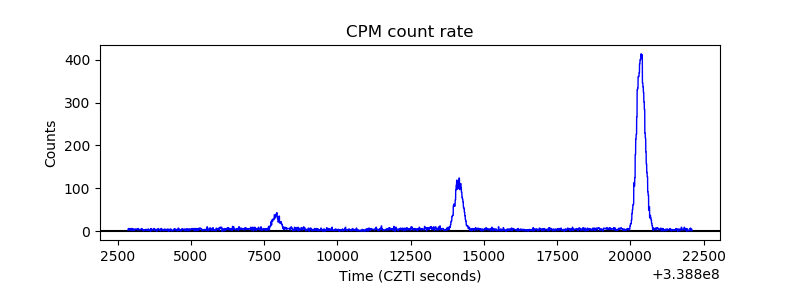 |
| CZT Counter | 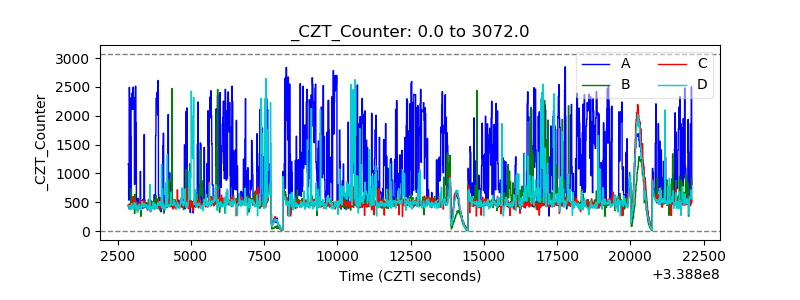 |
| +2.5 Volts monitor |  |
| +5 Volts monitor |  |
| _ROLL_ROT | 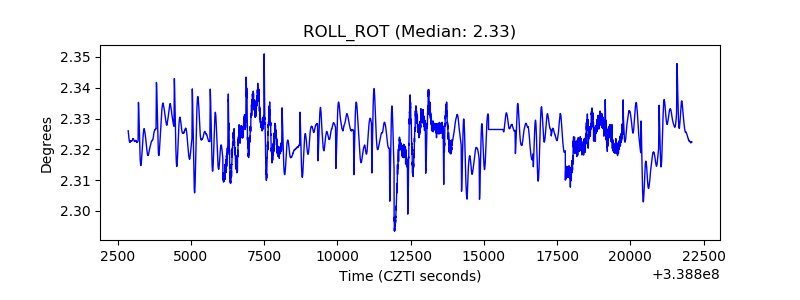 |
| _Roll_DEC | 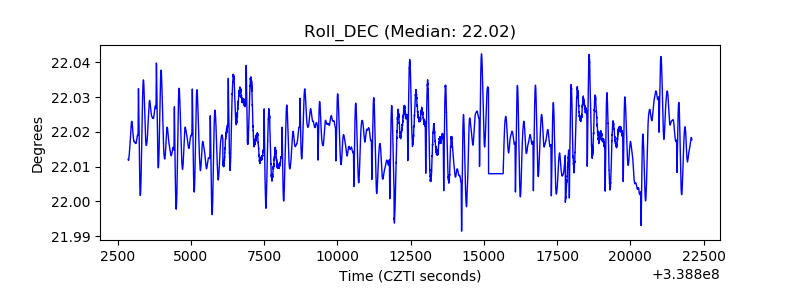 |
| _Roll_RA | 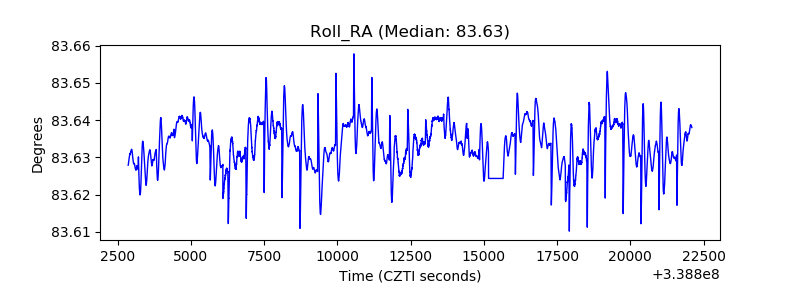 |
| Veto Counter | 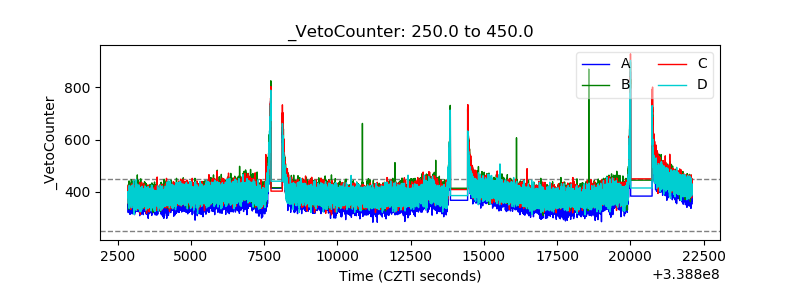 |