| Param | Original file | Final file |
|---|---|---|
| Filename | modeM0/AS1A09_120T02_9000003904cztM0_level2.fits | modeM0/AS1A09_120T02_9000003904cztM0_level2_quad_clean.evt |
| Size (bytes) | 2,628,336,960 | 2,540,940,480 |
| Size | 2.4 GB | 2.4 GB |
| Events in quadrant A | 15,242,010 | 13,227,653 |
| Events in quadrant B | 15,463,594 | 15,851,758 |
| Events in quadrant C | 16,606,896 | 15,795,538 |
| Events in quadrant D | 14,089,722 | 13,919,631 |
| Mode M9 | |||
|---|---|---|---|
| Quadrant | BADHDUFLAG | Total packets | Discarded packets |
| A | 0 | 424 | 0 |
| B | 0 | 425 | 0 |
| C | 0 | 426 | 0 |
| D | 0 | 424 | 0 |
| Mode SS | |||
|---|---|---|---|
| Quadrant | BADHDUFLAG | Total packets | Discarded packets |
| A | 0 | 5404 | 0 |
| B | 0 | 5406 | 0 |
| C | 0 | 5402 | 0 |
| D | 0 | 5409 | 0 |
| Mode M0 | |||
|---|---|---|---|
| Quadrant | BADHDUFLAG | Total packets | Discarded packets |
| A | 0 | 936615 | 0 |
| B | 0 | 758039 | 0 |
| C | 0 | 567169 | 0 |
| D | 0 | 748982 | 0 |
| Quadrant | Total seconds | Saturated seconds | Saturation percentage |
|---|---|---|---|
| A | 265098 | 47190 | 17.800964% |
| B | 265076 | 29244 | 11.032308% |
| C | 265155 | 4830 | 1.821576% |
| D | 265081 | 18179 | 6.857904% |
Noise dominated data is calculated using 1-second bins in cleaned event files. If a bin has >2000 counts, and if more than 50% of those come from <1% of pixels, then it is considered to be noise-dominated and hence unusable.
| Quadrant | # 1 sec bins | Bins with >0 counts | Bins with >2000 counts | High rate bins dominated by noise | Noise dominated (total time) | Noise dominated (detector-on time) | Marked lightcurve |
|---|---|---|---|---|---|---|---|
| A | 309172 | 265166 | 0 | 0 | 0.00% | 0.00% | 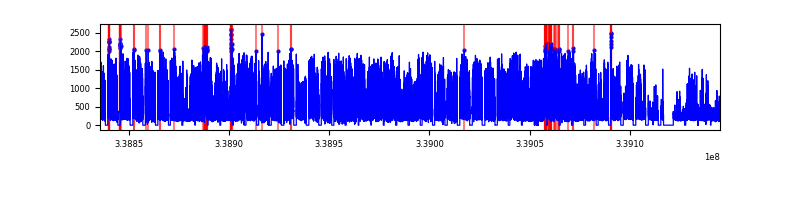 |
| B | 309172 | 265302 | 0 | 0 | 0.00% | 0.00% | 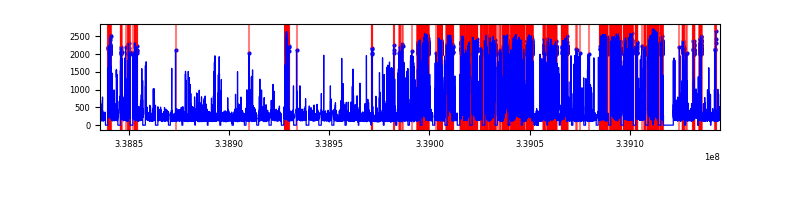 |
| C | 309172 | 265374 | 0 | 0 | 0.00% | 0.00% | 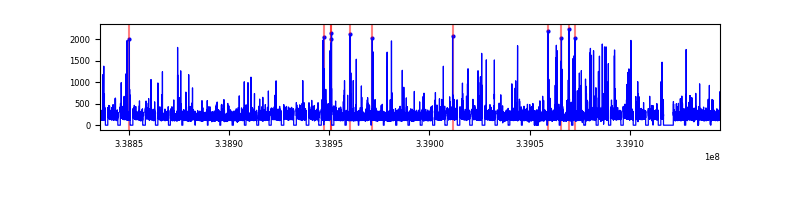 |
| D | 309172 | 264692 | 0 | 0 | 0.00% | 0.00% | 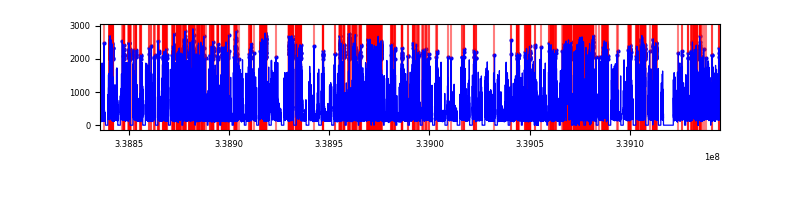 |
Top three noisy pixels from each quadrant. If the there are fewer than three noisy pixels in the level2.evt file, extra rows are filled as -1
| Pixel properties | Quadrant properties | ||||||
|---|---|---|---|---|---|---|---|
| Quadrant | DetID | PixID | Counts | Sigma | Mean | Median | Sigma |
| A | 0 | 29 | 12855 | 9.56 | 3971 | 3741 | 953.2 |
| A | 7 | 110 | 12635 | 9.33 | 3971 | 3741 | 953.2 |
| A | 9 | 19 | 11563 | 8.21 | 3971 | 3741 | 953.2 |
| B | 2 | 9 | 12118 | 10.4 | 4075 | 3887 | 791.1 |
| B | 5 | 128 | 10336 | 8.15 | 4075 | 3887 | 791.1 |
| B | 5 | 255 | 10052 | 7.79 | 4075 | 3887 | 791.1 |
| C | 1 | 81 | 13759 | 8.84 | 4386 | 4125 | 1089.8 |
| C | 1 | 80 | 13559 | 8.66 | 4386 | 4125 | 1089.8 |
| C | 12 | 241 | 11260 | 6.55 | 4386 | 4125 | 1089.8 |
| D | 4 | 246 | 10839 | 6.74 | 4024 | 3671 | 1063.7 |
| D | 6 | 67 | 9872 | 5.83 | 4024 | 3671 | 1063.7 |
| D | 10 | 189 | 9843 | 5.8 | 4024 | 3671 | 1063.7 |
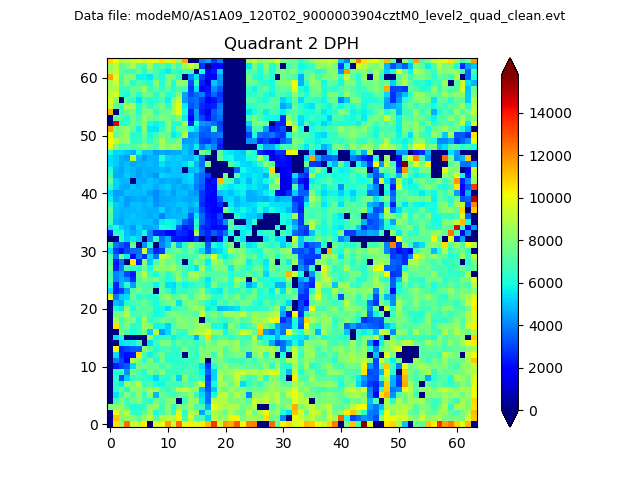
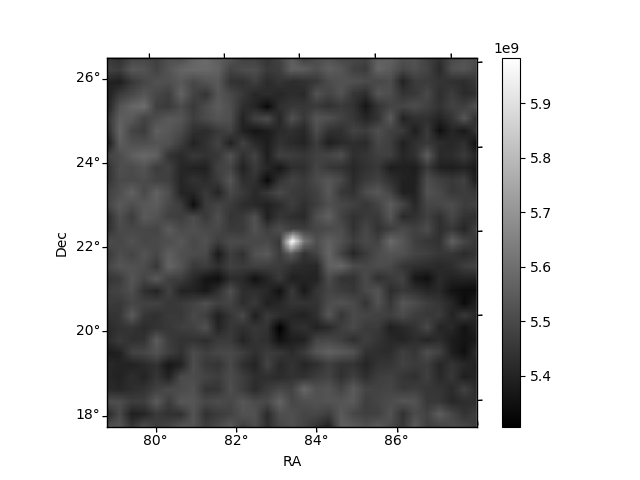
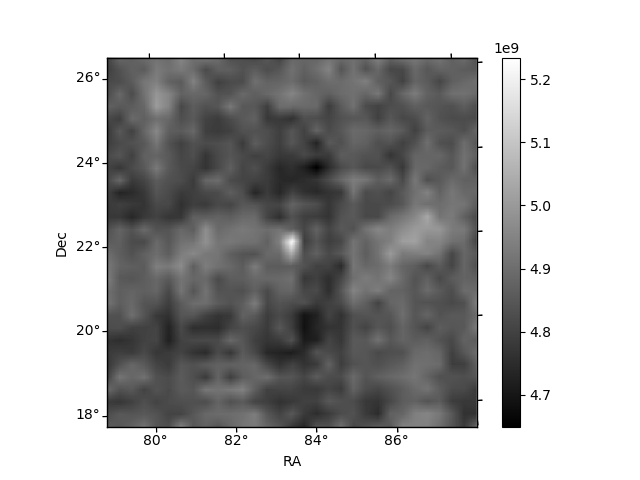
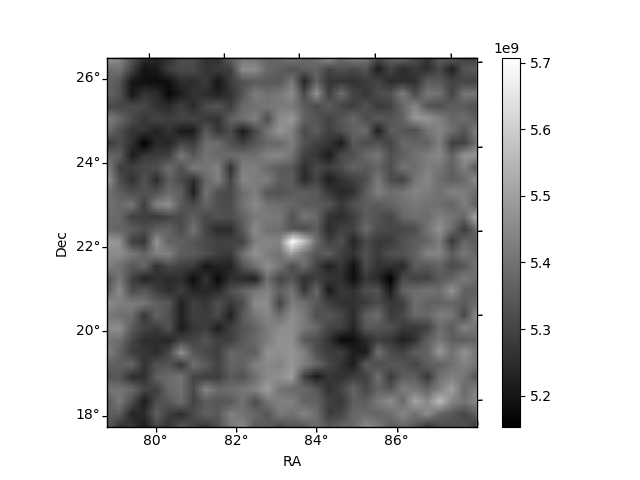
Histogram calculated using DETX and DETY for each event in the final _common_clean file
| Quadrant A | 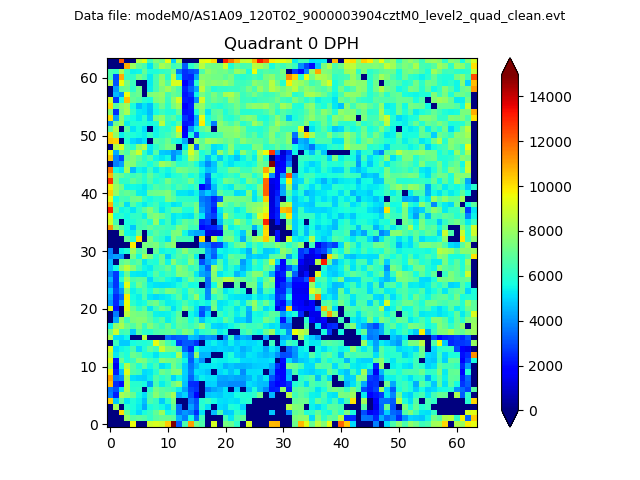 |
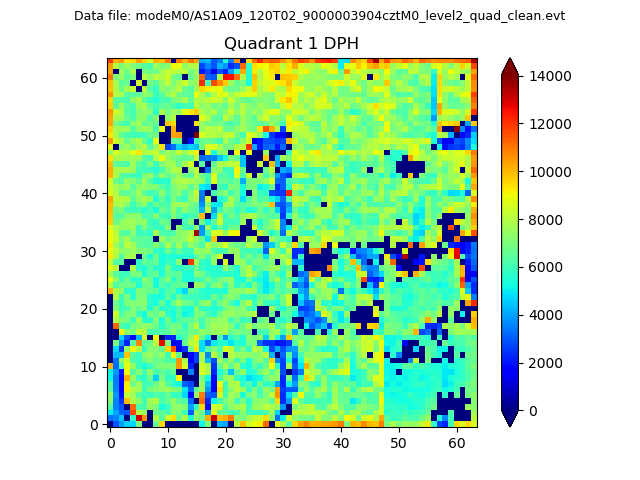 |
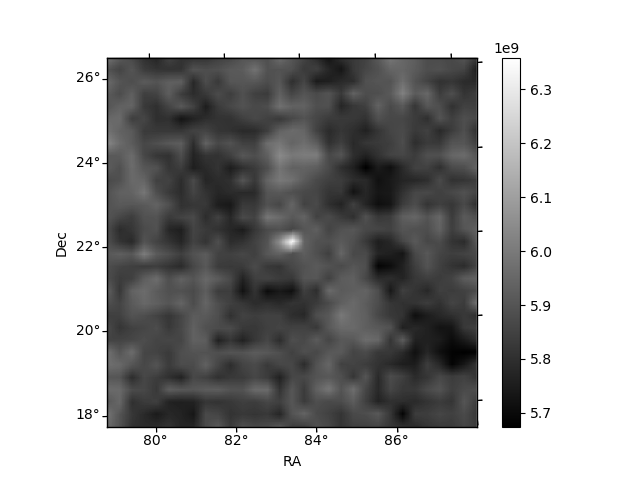
Quadrant B |
|---|---|---|---|
| Quadrant D | 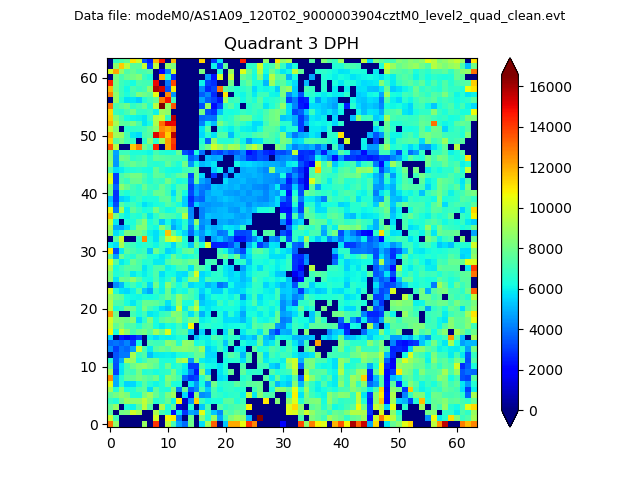 |
 |
Quadrant C |
| Plot type | Count rate plots | Images |
|---|---|---|
| Comparison with Poisson distribution Blue bars denote a histogram of data divided into 1 sec bins. Red curve is a Poisson curve with rate = median count rate of data. |
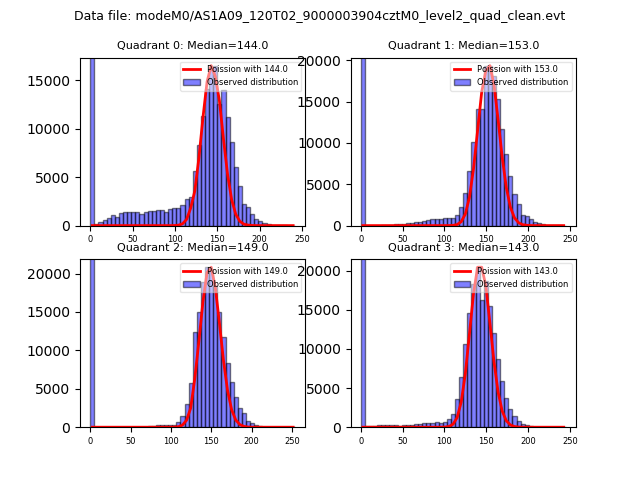 |
 |
| Quadrant-wise count rates Data is divided into 100 sec bins |
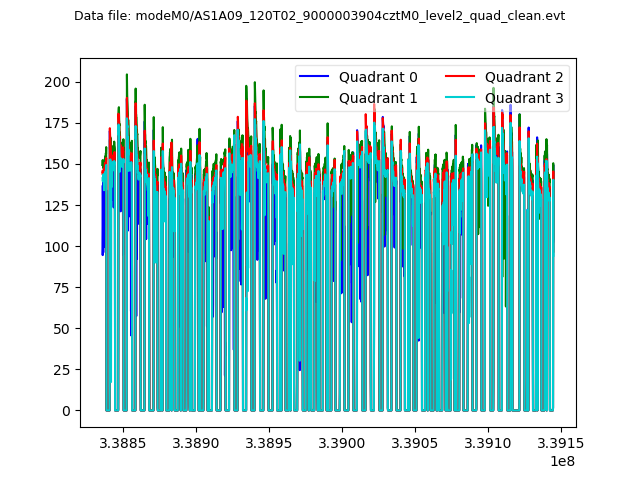 |
|
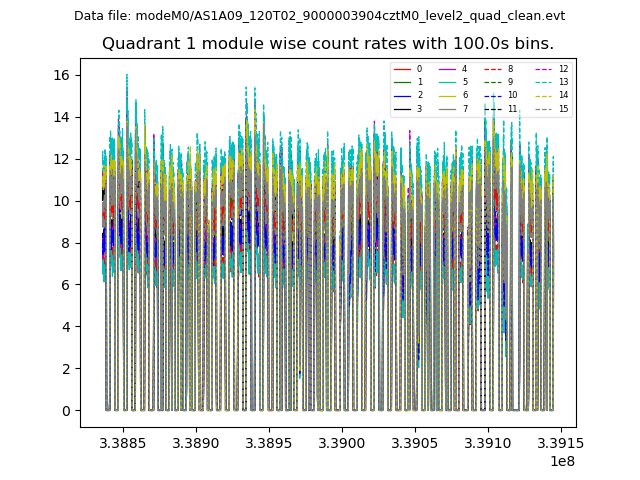
| Module-wise count rates for Quadrant A Data is divided into 100 sec bins |
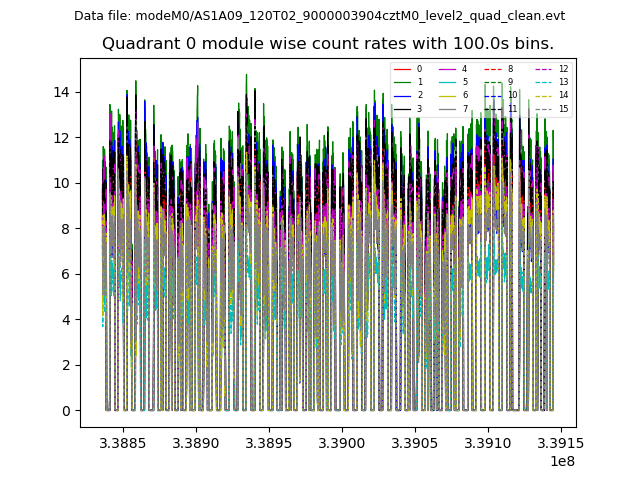 |
 |
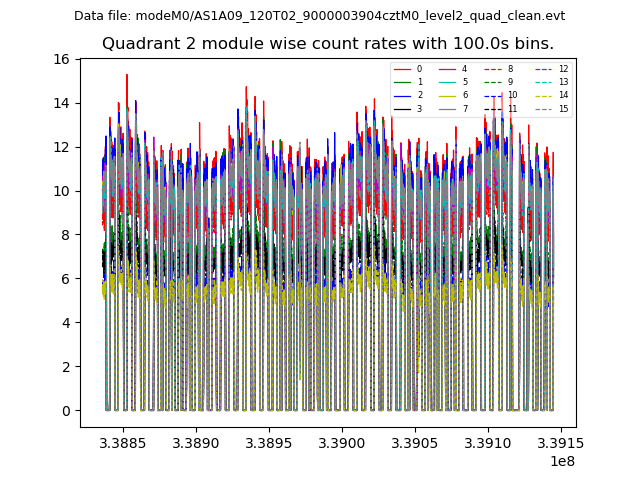
| Module-wise count rates for Quadrant B Data is divided into 100 sec bins |
 |
 |
| Module-wise count rates for Quadrant C Data is divided into 100 sec bins |
 |
 |
| Module-wise count rates for Quadrant D Data is divided into 100 sec bins |
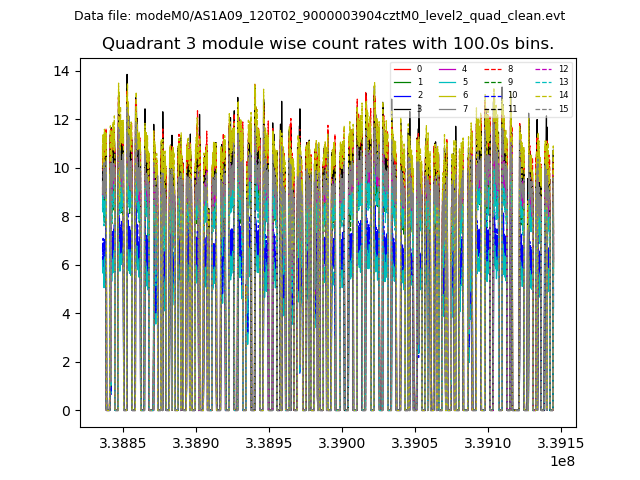 |
 |
| Parameter | Plot |
|---|---|
| CZT HV Monitor | 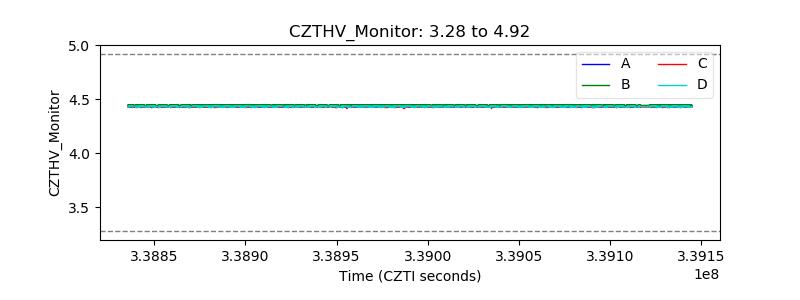 |
| D_VDD | 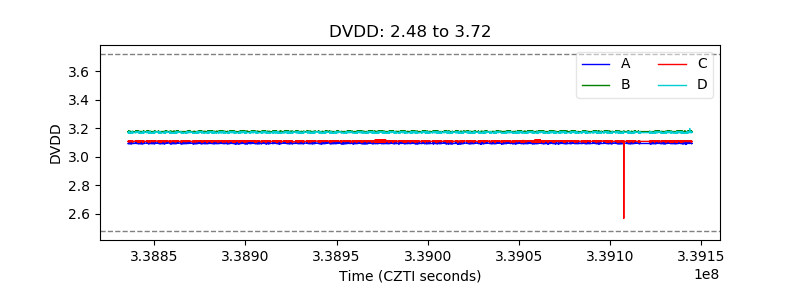 |
| Temperature 1 | 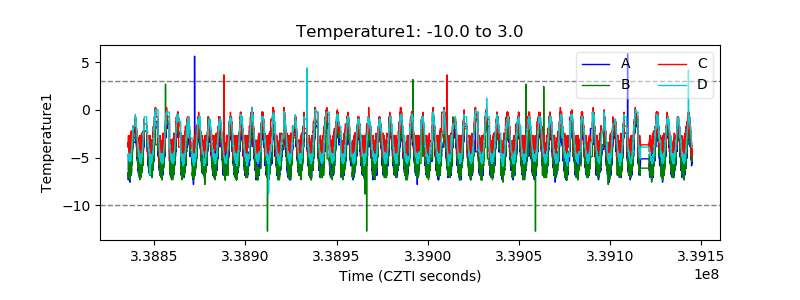 |
| Veto HV Monitor | 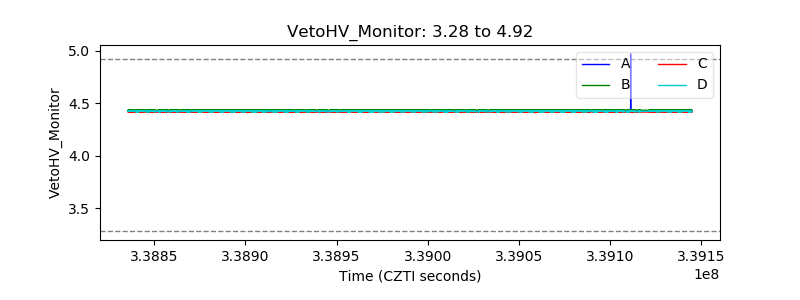 |
| Veto LLD | 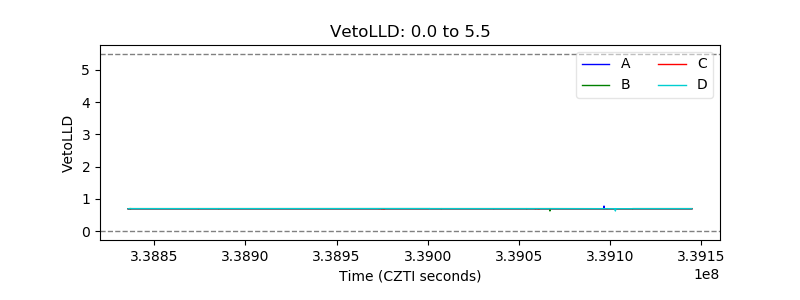 |
| Alpha Counter | 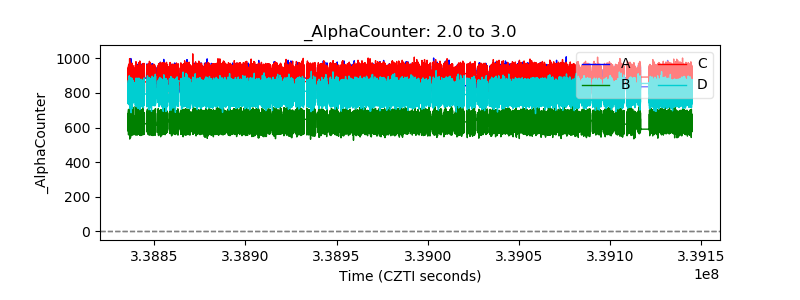 |
| _CPM_Rate | 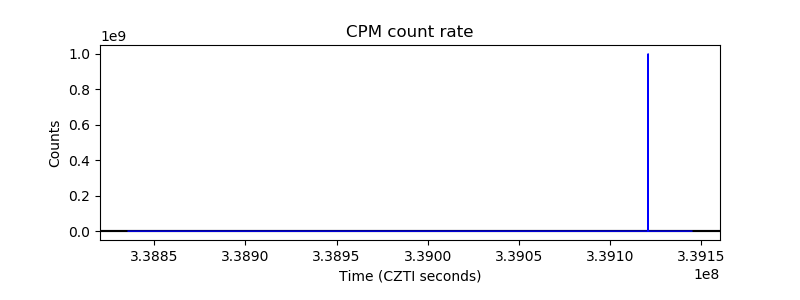 |
| CZT Counter | 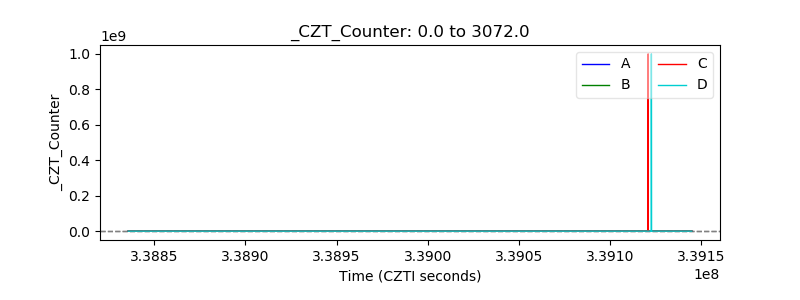 |
| +2.5 Volts monitor | 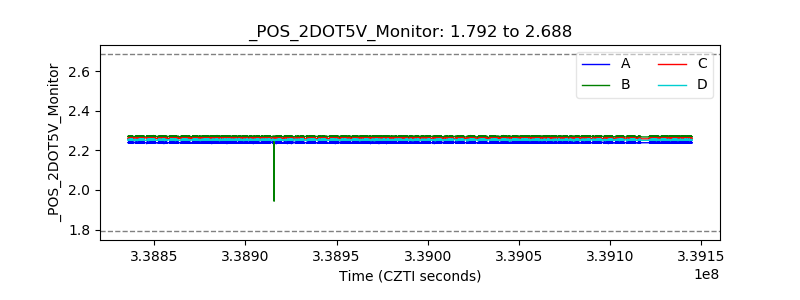 |
| +5 Volts monitor | 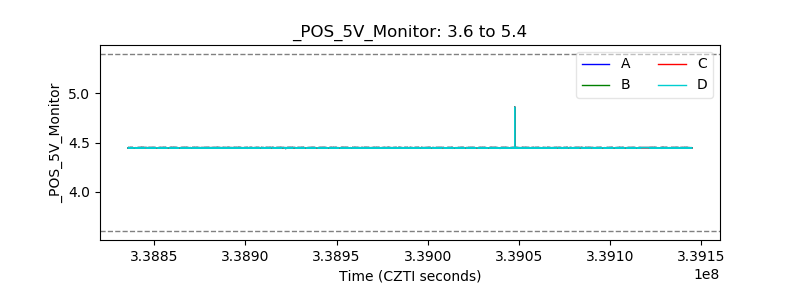 |
| _ROLL_ROT | 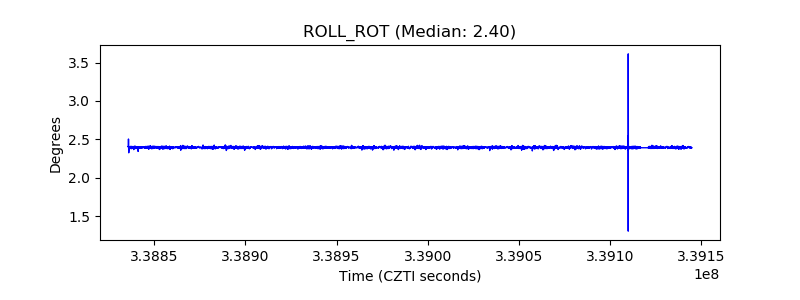 |
| _Roll_DEC | 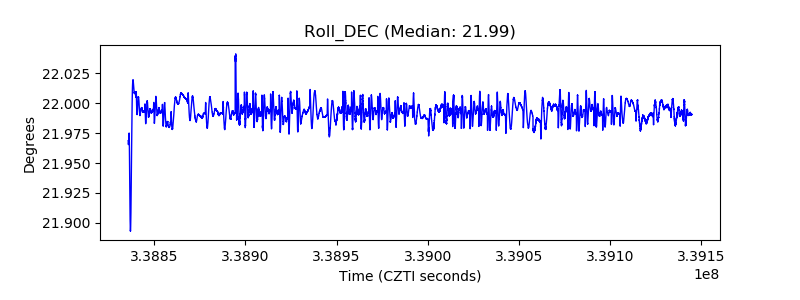 |
| _Roll_RA | 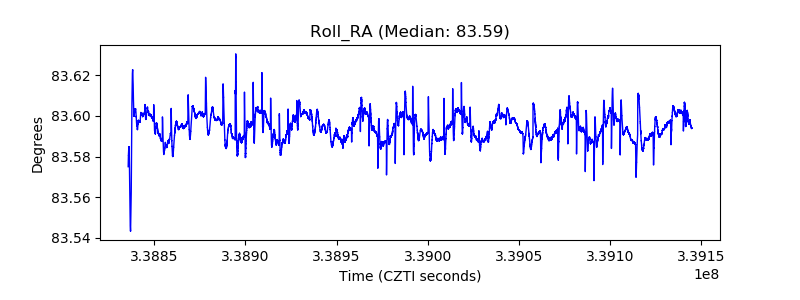 |
| Veto Counter | 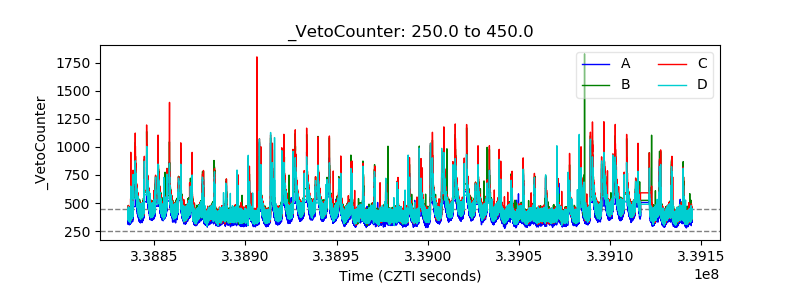 |