| Param | Original file | Final file |
|---|---|---|
| Filename | modeM0/AS1A09_120T02_9000003904_27022cztM0_level2.evt | modeM0/AS1A09_120T02_9000003904_27022cztM0_level2_quad_clean.evt |
| Size (bytes) | 404,432,640 | 62,544,960 |
| Size | 385.7 MB | 59.6 MB |
| Events in quadrant A | 4,516,314 | 362,808 |
| Events in quadrant B | 2,762,579 | 431,388 |
| Events in quadrant C | 2,136,797 | 418,028 |
| Events in quadrant D | 2,564,592 | 403,171 |
| Mode M9 | |||
|---|---|---|---|
| Quadrant | BADHDUFLAG | Total packets | Discarded packets |
| A | 0 | 12 | 0 |
| B | 0 | 12 | 0 |
| C | 0 | 12 | 0 |
| D | 0 | 12 | 0 |
| Mode M0 | |||
|---|---|---|---|
| Quadrant | BADHDUFLAG | Total packets | Discarded packets |
| A | 0 | 16193 | 0 |
| B | 0 | 10724 | 0 |
| C | 0 | 8890 | 0 |
| D | 0 | 10316 | 0 |
| Quadrant | Total seconds | Saturated seconds | Saturation percentage |
|---|---|---|---|
| A | 3942 | 989 | 25.088787% |
| B | 3942 | 255 | 6.468798% |
| C | 3942 | 75 | 1.902588% |
| D | 3941 | 103 | 2.613550% |
Noise dominated data is calculated using 1-second bins in cleaned event files. If a bin has >2000 counts, and if more than 50% of those come from <1% of pixels, then it is considered to be noise-dominated and hence unusable.
| Quadrant | # 1 sec bins | Bins with >0 counts | Bins with >2000 counts | High rate bins dominated by noise | Noise dominated (total time) | Noise dominated (detector-on time) | Marked lightcurve |
|---|---|---|---|---|---|---|---|
| A | 5132 | 3942 | 775 | 775 | 15.10% | 19.66% | 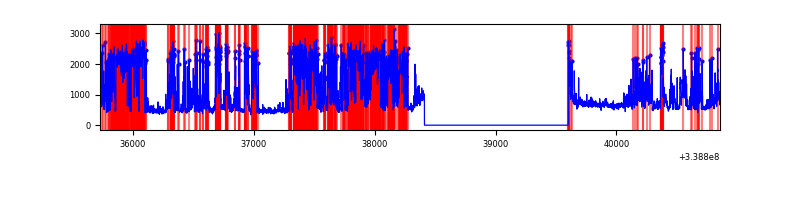 |
| B | 5132 | 3942 | 126 | 126 | 2.46% | 3.20% | 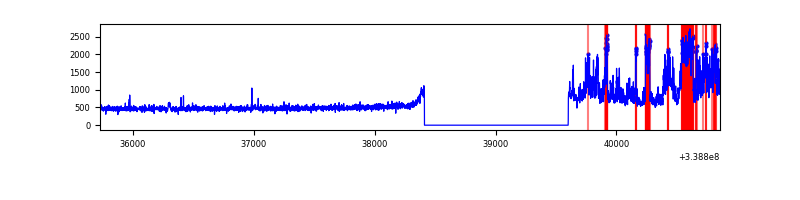 |
| C | 5132 | 3942 | 0 | 0 | 0.00% | 0.00% | 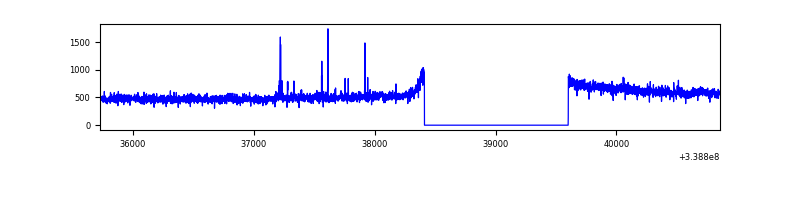 |
| D | 5130 | 3940 | 78 | 78 | 1.52% | 1.98% | 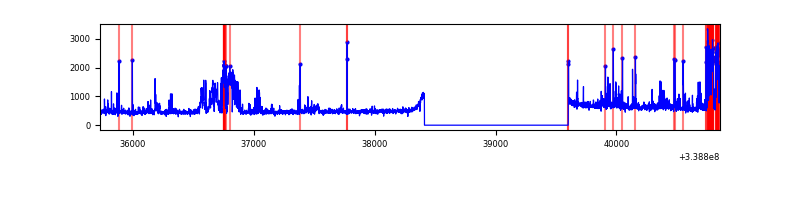 |
Top three noisy pixels from each quadrant. If the there are fewer than three noisy pixels in the level2.evt file, extra rows are filled as -1
| Pixel properties | Quadrant properties | ||||||
|---|---|---|---|---|---|---|---|
| Quadrant | DetID | PixID | Counts | Sigma | Mean | Median | Sigma |
| A | 14 | 235 | 2531579 | 25897.27 | 484 | 475 | 97.7 |
| A | 6 | 16 | 99417 | 1012.34 | 484 | 475 | 97.7 |
| A | 8 | 192 | 13273 | 130.94 | 484 | 475 | 97.7 |
| B | 0 | 189 | 686038 | 6831.17 | 526 | 515 | 100.4 |
| B | 12 | 111 | 11319 | 107.66 | 526 | 515 | 100.4 |
| B | 11 | 111 | 10434 | 98.84 | 526 | 515 | 100.4 |
| C | 14 | 238 | 84844 | 684.43 | 521 | 526 | 123.2 |
| C | 15 | 208 | 17969 | 141.59 | 521 | 526 | 123.2 |
| C | 13 | 61 | 3588 | 24.85 | 521 | 526 | 123.2 |
| D | 1 | 52 | 326085 | 2596.57 | 518 | 506 | 125.4 |
| D | 11 | 176 | 159420 | 1267.38 | 518 | 506 | 125.4 |
| D | 2 | 250 | 82463 | 653.63 | 518 | 506 | 125.4 |
Histogram calculated using DETX and DETY for each event in the final _common_clean file
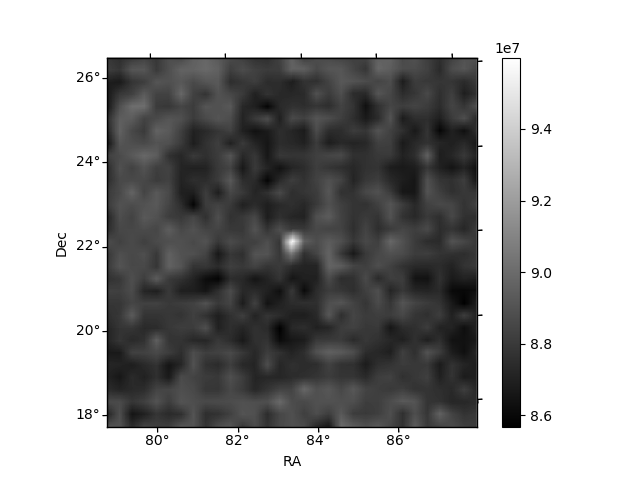
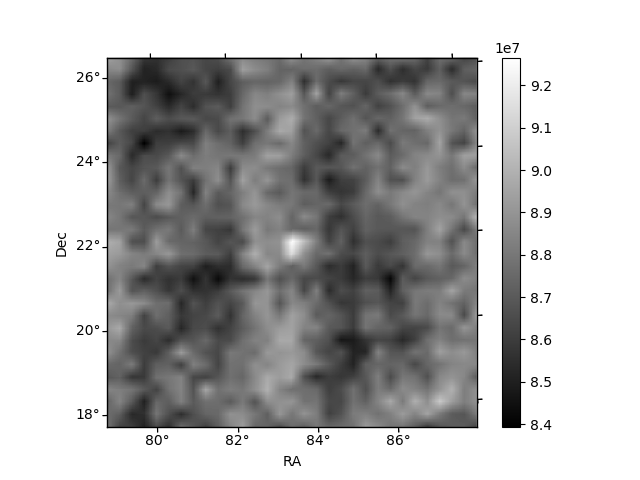
| Quadrant A |  |
 |
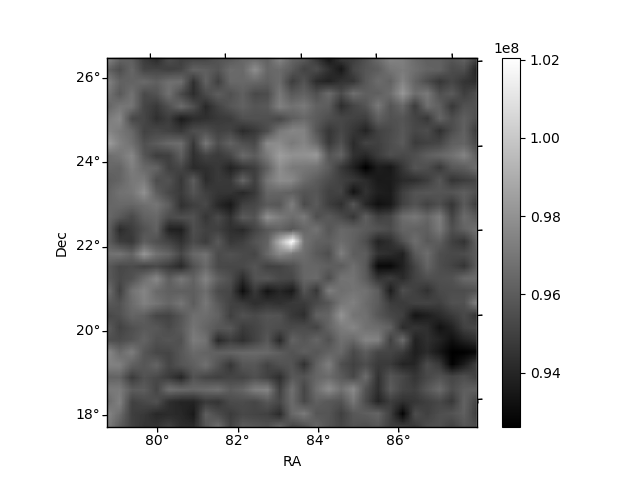
Quadrant B |
|---|---|---|---|
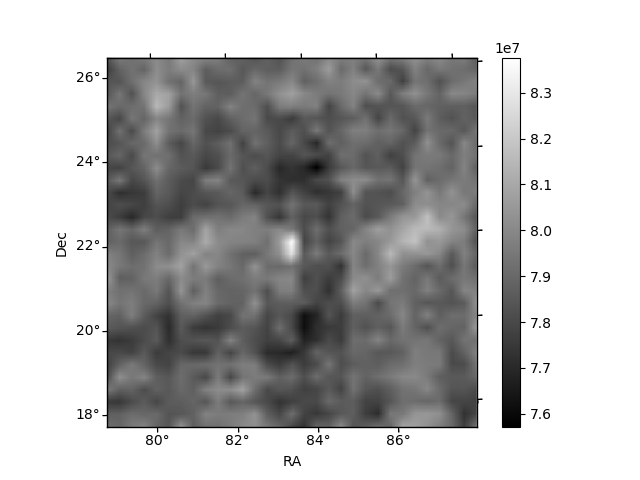
| Quadrant D |  |
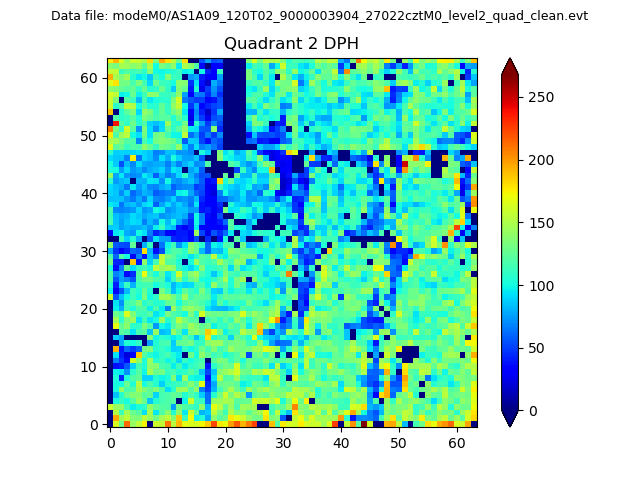 |
Quadrant C |
| Plot type | Count rate plots | Images |
|---|---|---|
| Comparison with Poisson distribution Blue bars denote a histogram of data divided into 1 sec bins. Red curve is a Poisson curve with rate = median count rate of data. |
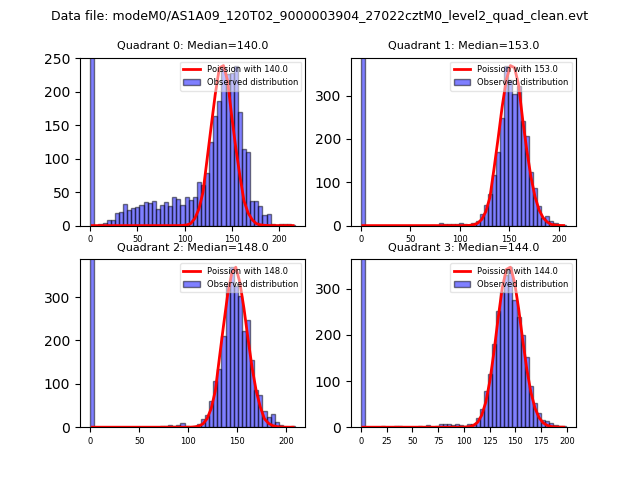 |
 |
| Quadrant-wise count rates Data is divided into 100 sec bins |
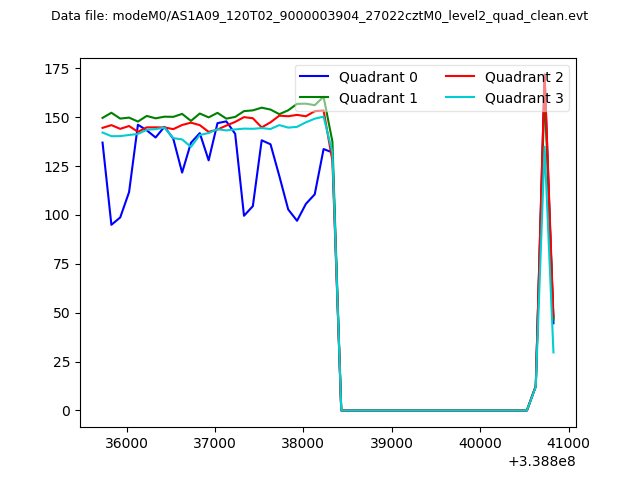 |
|
| Module-wise count rates for Quadrant A Data is divided into 100 sec bins |
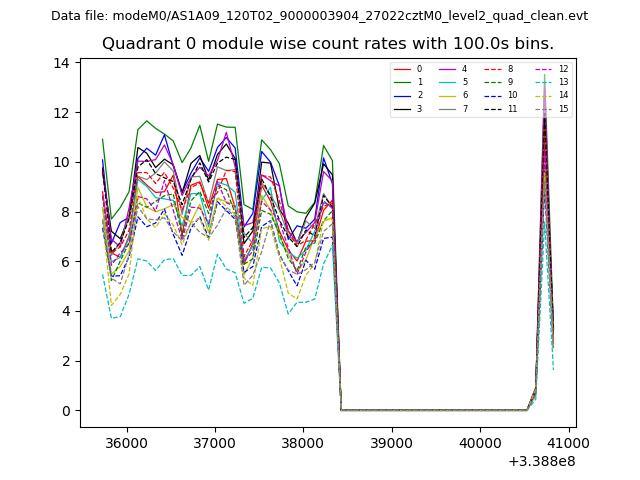 |
 |
| Module-wise count rates for Quadrant B Data is divided into 100 sec bins |
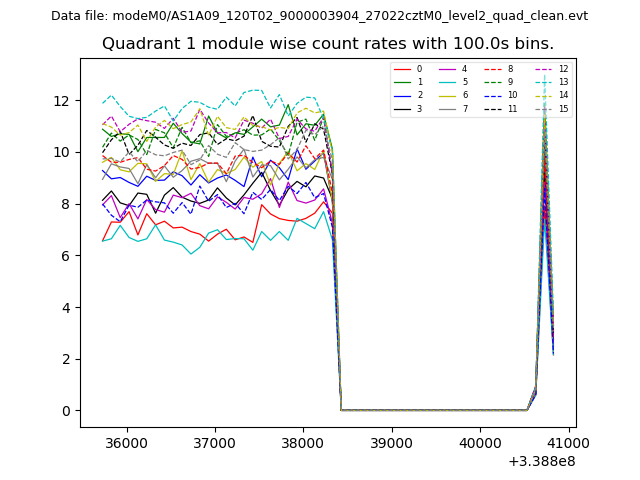 |
 |
| Module-wise count rates for Quadrant C Data is divided into 100 sec bins |
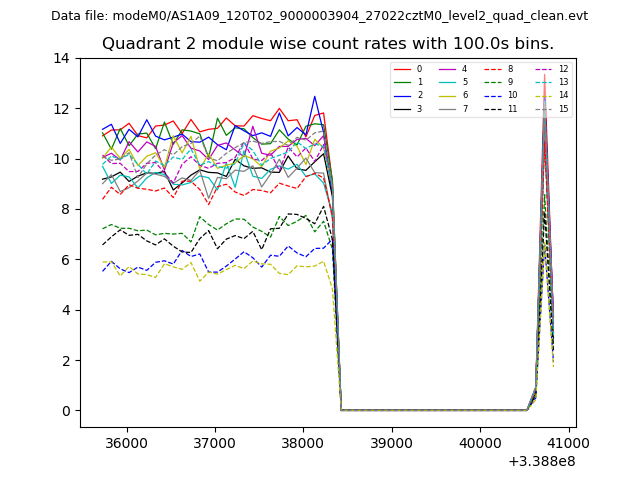 |
 |
| Module-wise count rates for Quadrant D Data is divided into 100 sec bins |
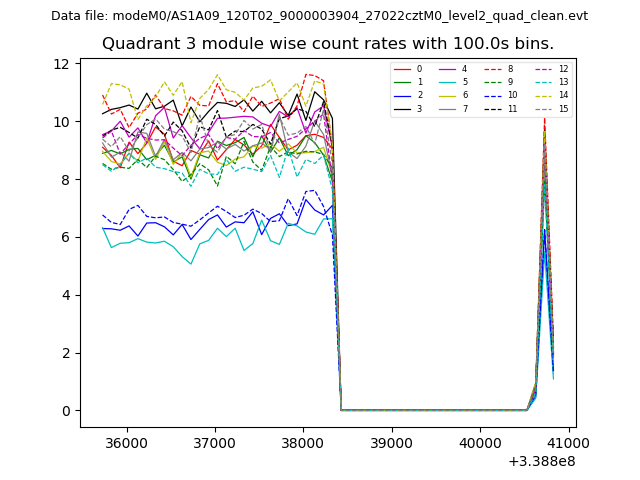 |
 |
| Parameter | Plot |
|---|---|
| CZT HV Monitor |  |
| D_VDD | 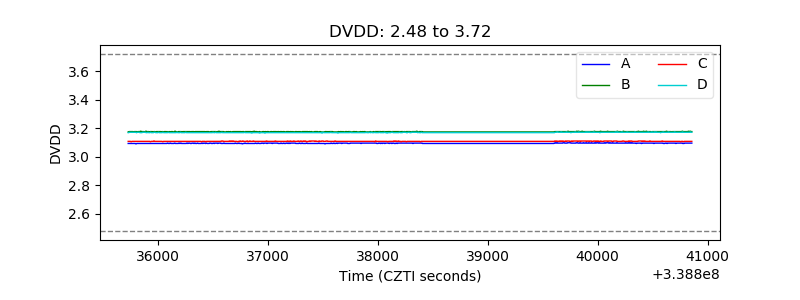 |
| Temperature 1 | 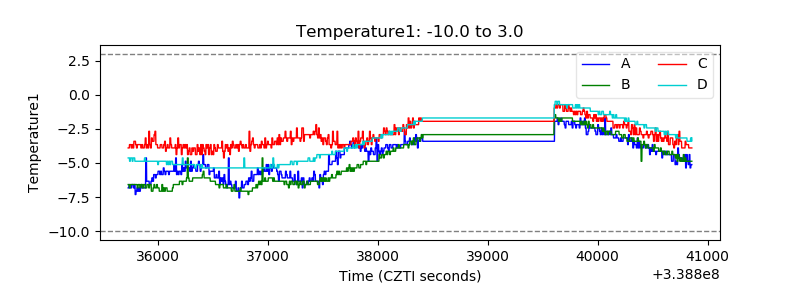 |
| Veto HV Monitor | 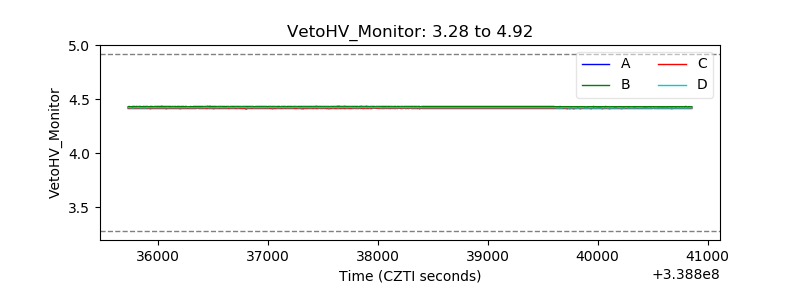 |
| Veto LLD | 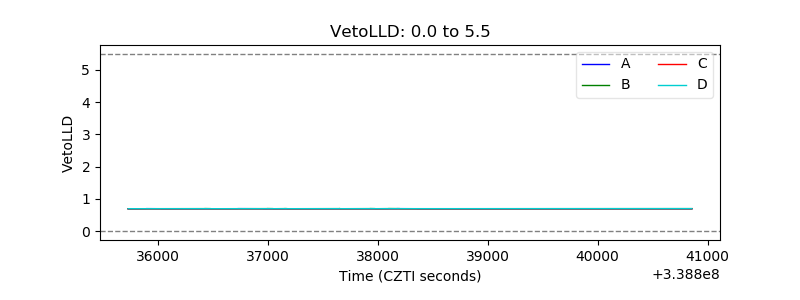 |
| Alpha Counter | 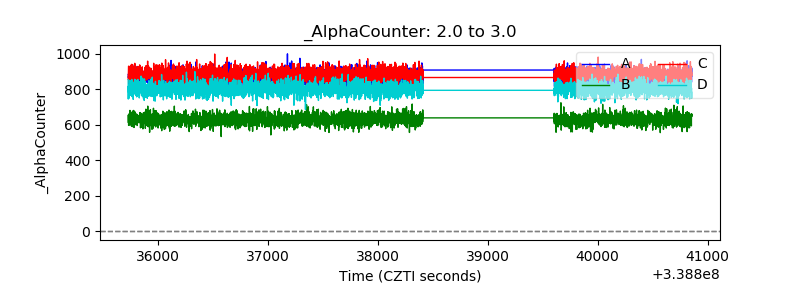 |
| _CPM_Rate | 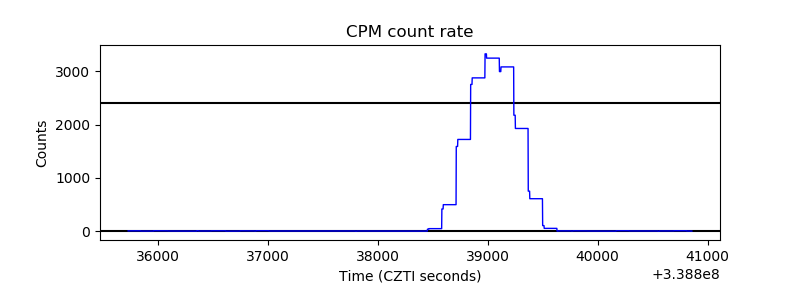 |
| CZT Counter | 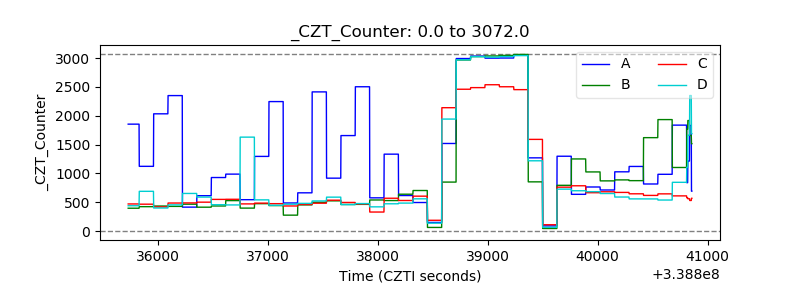 |
| +2.5 Volts monitor |  |
| +5 Volts monitor |  |
| _ROLL_ROT | 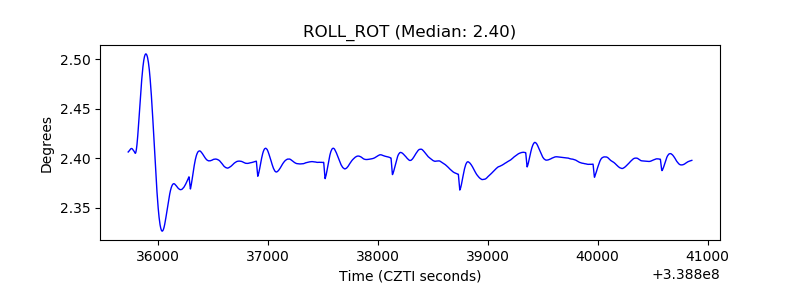 |
| _Roll_DEC | 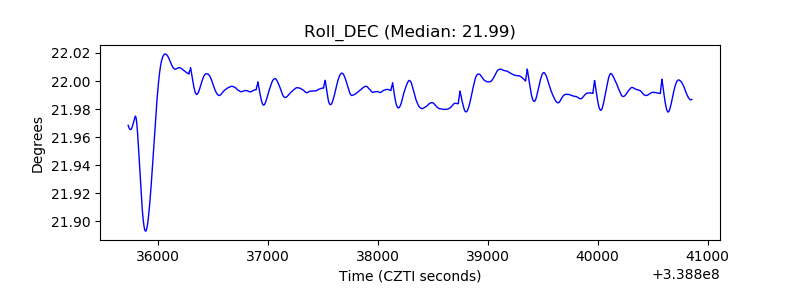 |
| _Roll_RA | 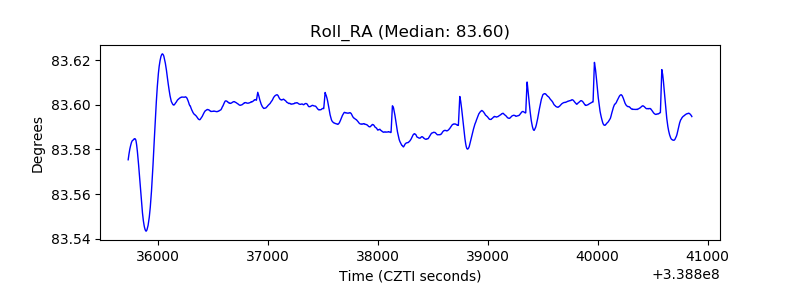 |
| Veto Counter | 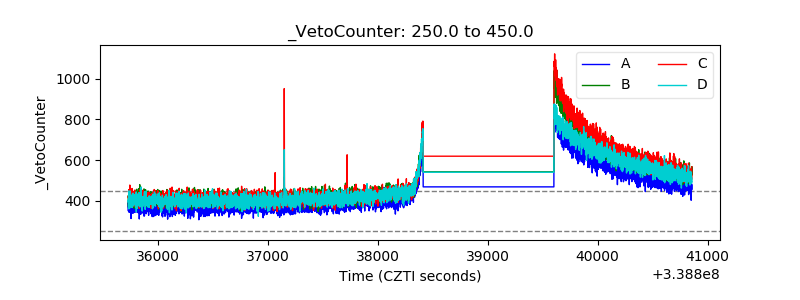 |