| Param | Original file | Final file |
|---|---|---|
| Filename | modeM0/AS1A09_120T02_9000003904_27023cztM0_level2.evt | modeM0/AS1A09_120T02_9000003904_27023cztM0_level2_quad_clean.evt |
| Size (bytes) | 659,208,960 | 99,731,520 |
| Size | 628.7 MB | 95.1 MB |
| Events in quadrant A | 5,790,952 | 635,679 |
| Events in quadrant B | 5,015,836 | 685,377 |
| Events in quadrant C | 3,569,428 | 668,780 |
| Events in quadrant D | 5,160,735 | 588,939 |
| Mode M9 | |||
|---|---|---|---|
| Quadrant | BADHDUFLAG | Total packets | Discarded packets |
| A | 0 | 20 | 0 |
| B | 0 | 21 | 0 |
| C | 0 | 21 | 0 |
| D | 0 | 21 | 0 |
| Mode M0 | |||
|---|---|---|---|
| Quadrant | BADHDUFLAG | Total packets | Discarded packets |
| A | 0 | 21549 | 0 |
| B | 0 | 19029 | 0 |
| C | 0 | 14650 | 0 |
| D | 0 | 19668 | 0 |
| Quadrant | Total seconds | Saturated seconds | Saturation percentage |
|---|---|---|---|
| A | 6321 | 754 | 11.928492% |
| B | 6321 | 451 | 7.134947% |
| C | 6321 | 129 | 2.040816% |
| D | 6321 | 596 | 9.428888% |
Noise dominated data is calculated using 1-second bins in cleaned event files. If a bin has >2000 counts, and if more than 50% of those come from <1% of pixels, then it is considered to be noise-dominated and hence unusable.
| Quadrant | # 1 sec bins | Bins with >0 counts | Bins with >2000 counts | High rate bins dominated by noise | Noise dominated (total time) | Noise dominated (detector-on time) | Marked lightcurve |
|---|---|---|---|---|---|---|---|
| A | 7571 | 6321 | 529 | 529 | 6.99% | 8.37% | 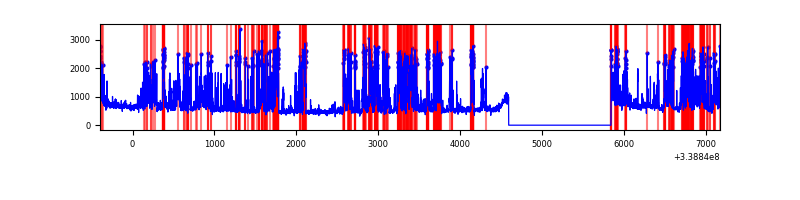 |
| B | 7571 | 6321 | 177 | 177 | 2.34% | 2.80% | 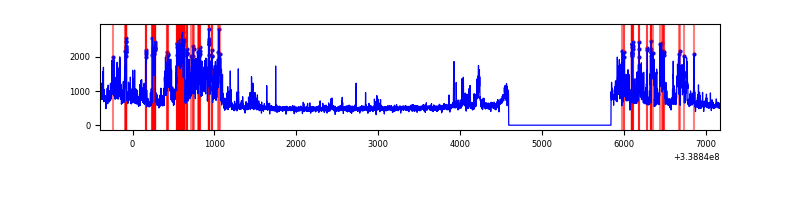 |
| C | 7571 | 6321 | 0 | 0 | 0.00% | 0.00% | 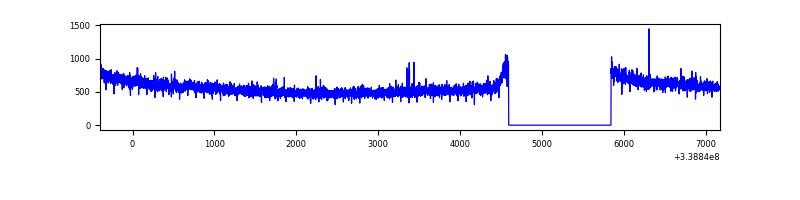 |
| D | 7571 | 6321 | 540 | 540 | 7.13% | 8.54% | 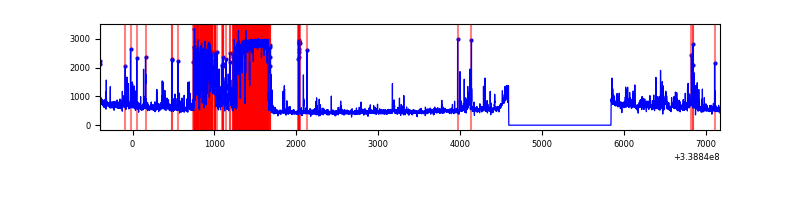 |
Top three noisy pixels from each quadrant. If the there are fewer than three noisy pixels in the level2.evt file, extra rows are filled as -1
| Pixel properties | Quadrant properties | ||||||
|---|---|---|---|---|---|---|---|
| Quadrant | DetID | PixID | Counts | Sigma | Mean | Median | Sigma |
| A | 14 | 235 | 2282966 | 13408.25 | 856 | 844 | 170.2 |
| A | 6 | 16 | 179973 | 1052.44 | 856 | 844 | 170.2 |
| A | 8 | 192 | 27068 | 154.07 | 856 | 844 | 170.2 |
| B | 0 | 189 | 1542083 | 9295.74 | 883 | 866 | 165.8 |
| B | 0 | 219 | 24246 | 141.01 | 883 | 866 | 165.8 |
| B | 12 | 111 | 18948 | 109.06 | 883 | 866 | 165.8 |
| C | 14 | 238 | 142737 | 691.59 | 878 | 888 | 205.1 |
| C | 15 | 208 | 8736 | 38.26 | 878 | 888 | 205.1 |
| C | 13 | 61 | 5973 | 24.79 | 878 | 888 | 205.1 |
| D | 11 | 176 | 1572012 | 7896.12 | 836 | 819 | 199.0 |
| D | 1 | 52 | 242519 | 1214.68 | 836 | 819 | 199.0 |
| D | 2 | 250 | 144504 | 722.1 | 836 | 819 | 199.0 |
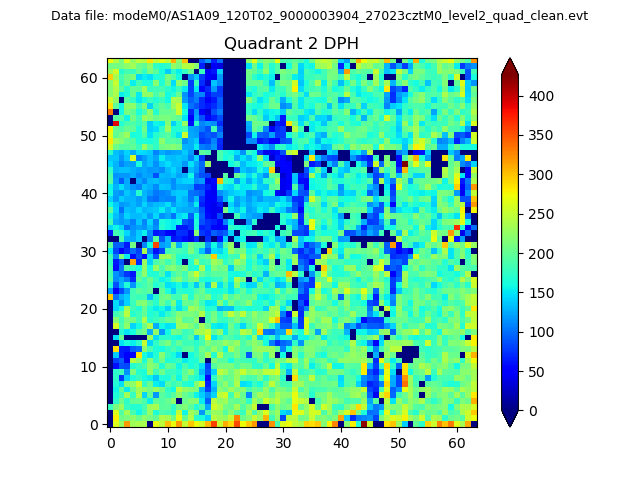
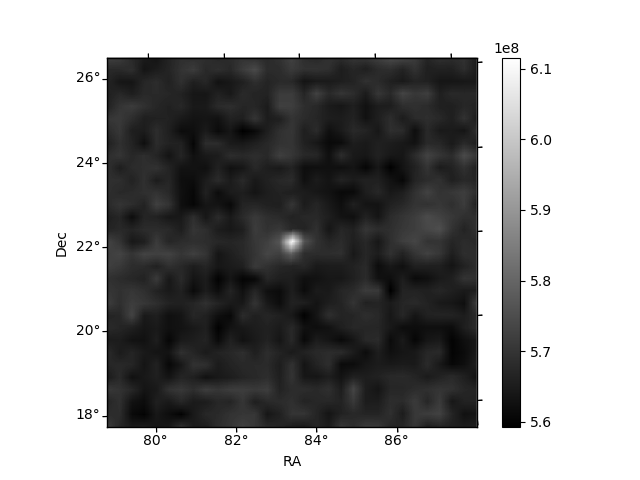
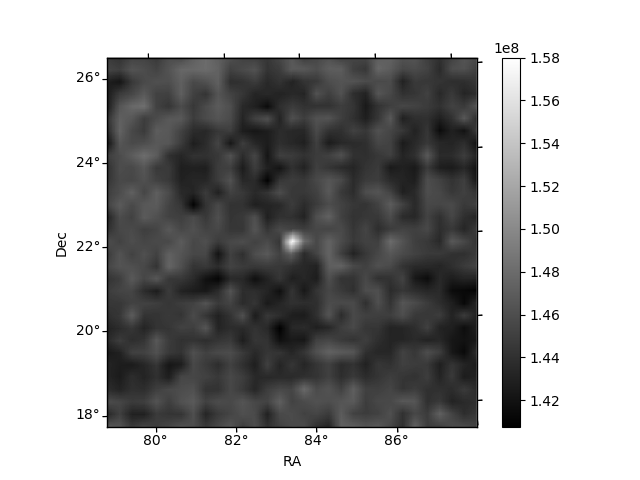
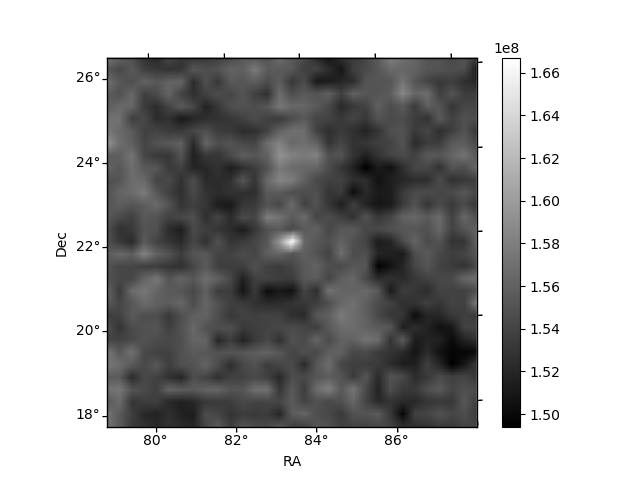
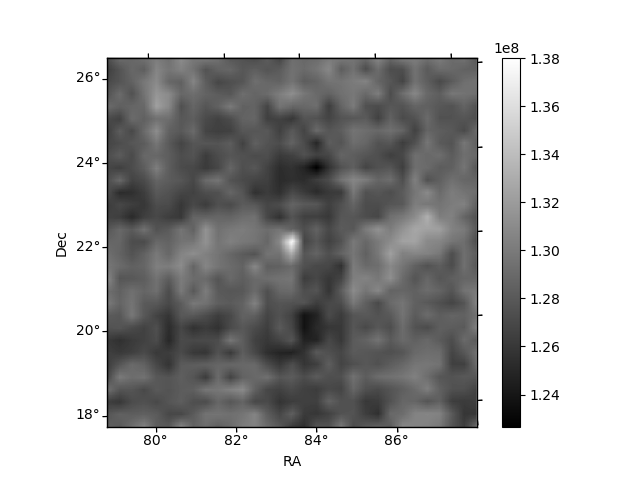
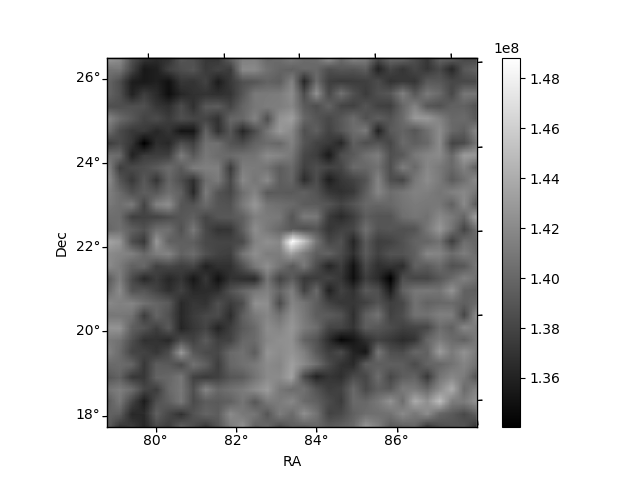
Histogram calculated using DETX and DETY for each event in the final _common_clean file
| Quadrant A | 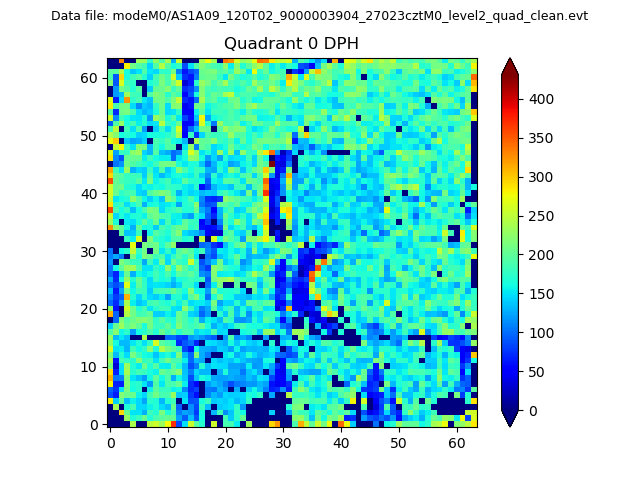 |
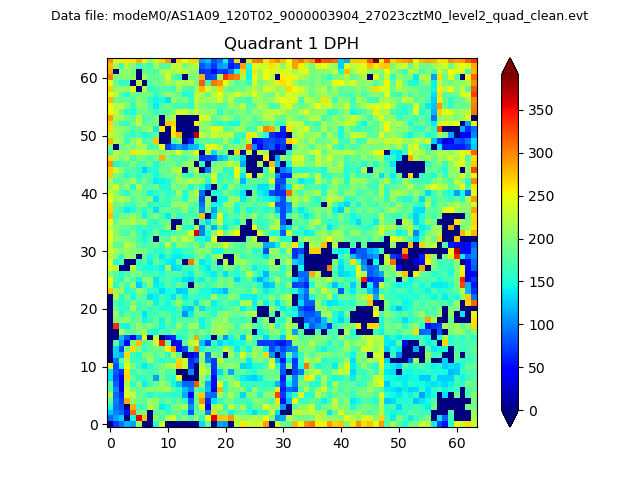 |
Quadrant B |
|---|---|---|---|
| Quadrant D | 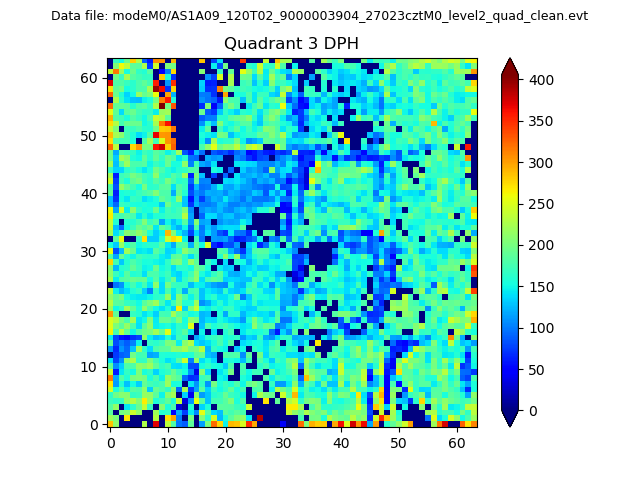 |
 |
Quadrant C |
| Plot type | Count rate plots | Images |
|---|---|---|
| Comparison with Poisson distribution Blue bars denote a histogram of data divided into 1 sec bins. Red curve is a Poisson curve with rate = median count rate of data. |
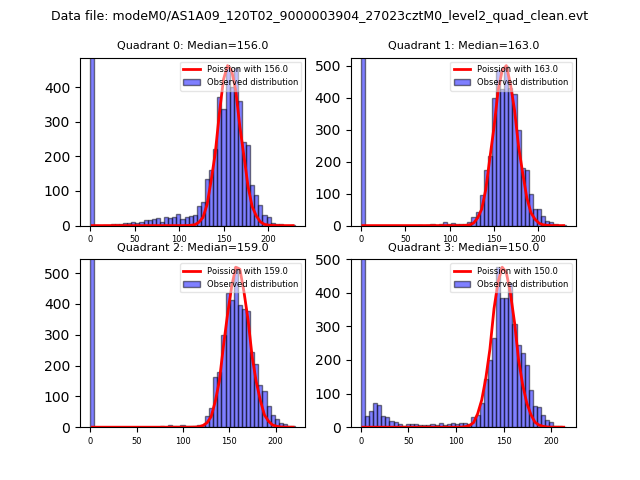 |
 |
| Quadrant-wise count rates Data is divided into 100 sec bins |
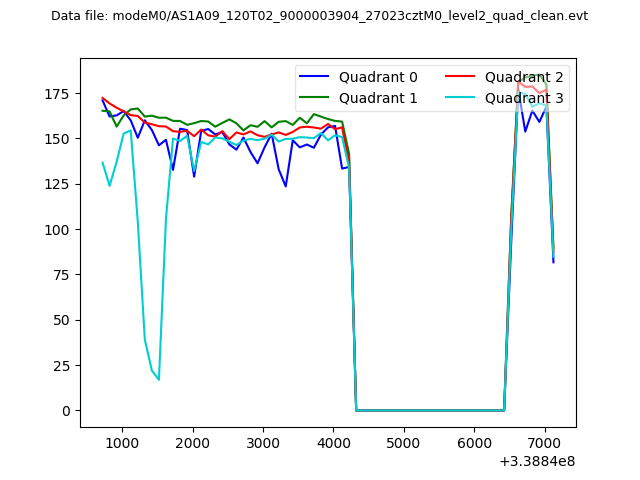 |
|
| Module-wise count rates for Quadrant A Data is divided into 100 sec bins |
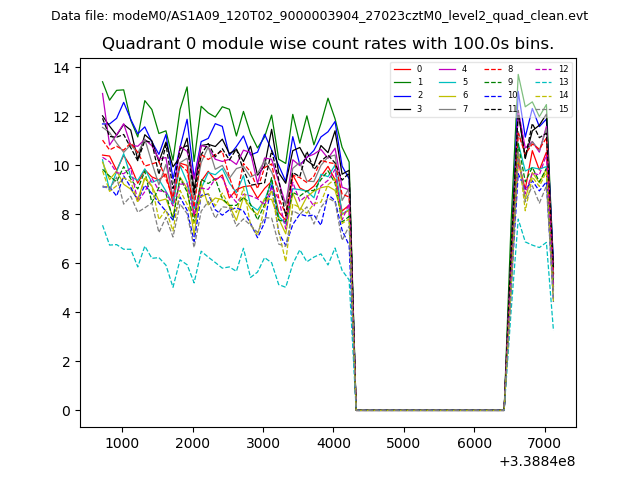 |
 |
| Module-wise count rates for Quadrant B Data is divided into 100 sec bins |
 |
 |
| Module-wise count rates for Quadrant C Data is divided into 100 sec bins |
 |
 |
| Module-wise count rates for Quadrant D Data is divided into 100 sec bins |
 |
 |
| Parameter | Plot |
|---|---|
| CZT HV Monitor | 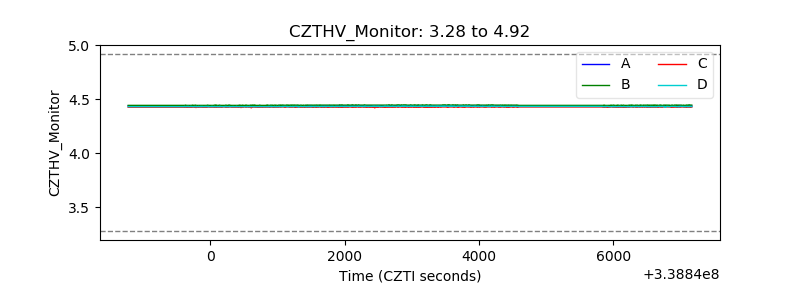 |
| D_VDD | 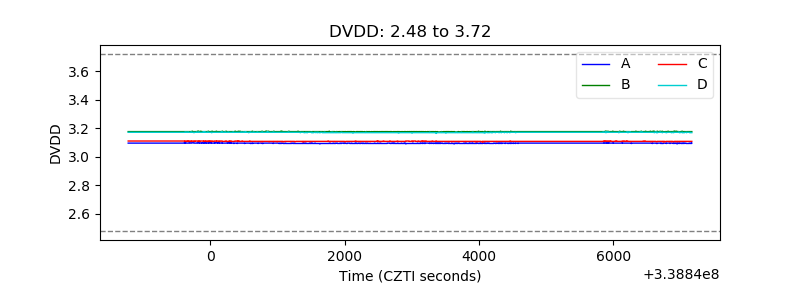 |
| Temperature 1 | 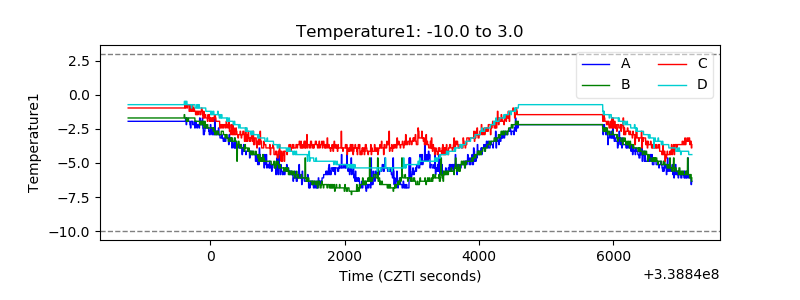 |
| Veto HV Monitor | 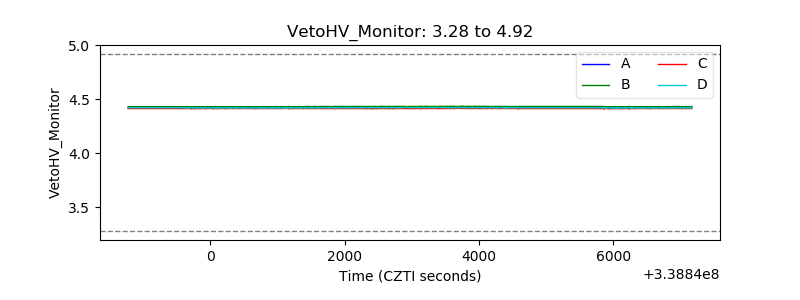 |
| Veto LLD | 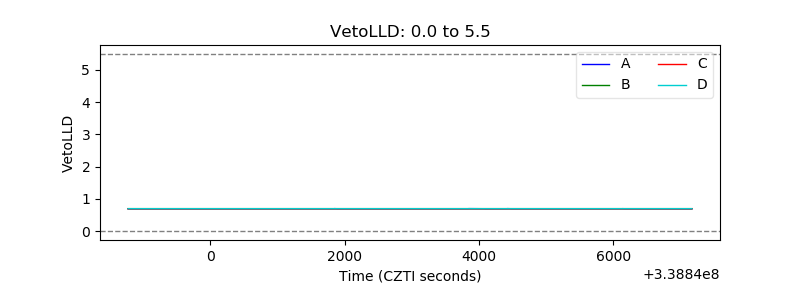 |
| Alpha Counter | 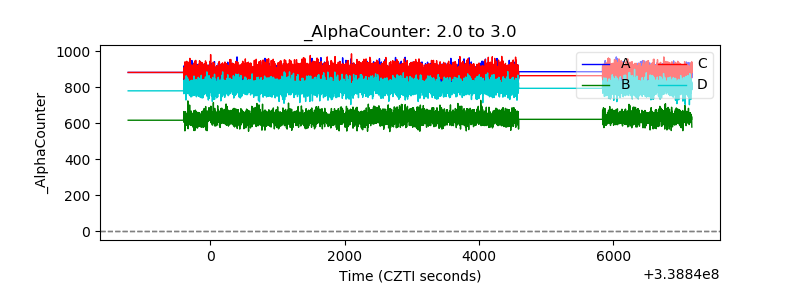 |
| _CPM_Rate | 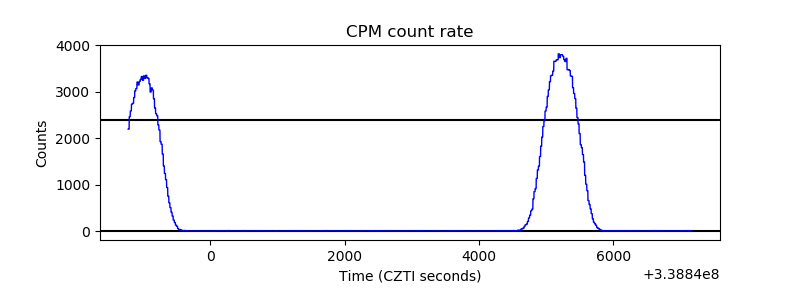 |
| CZT Counter | 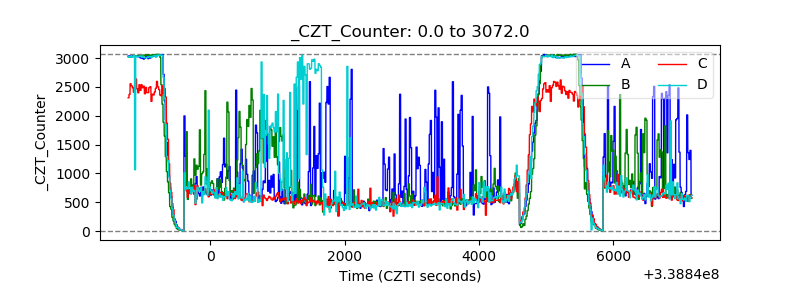 |
| +2.5 Volts monitor | 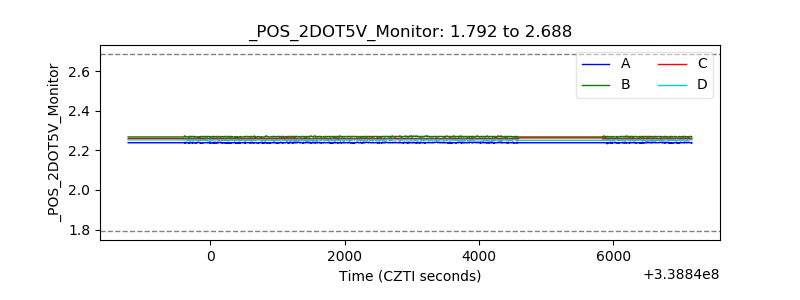 |
| +5 Volts monitor |  |
| _ROLL_ROT |  |
| _Roll_DEC |  |
| _Roll_RA | 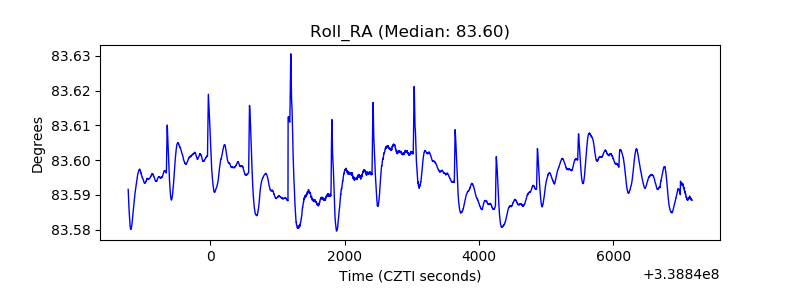 |
| Veto Counter |  |