| Param | Original file | Final file |
|---|---|---|
| Filename | modeM0/AS1A09_120T02_9000003904_27024cztM0_level2.evt | modeM0/AS1A09_120T02_9000003904_27024cztM0_level2_quad_clean.evt |
| Size (bytes) | 647,164,800 | 109,681,920 |
| Size | 617.2 MB | 104.6 MB |
| Events in quadrant A | 6,482,152 | 673,989 |
| Events in quadrant B | 4,445,403 | 767,002 |
| Events in quadrant C | 3,512,462 | 742,578 |
| Events in quadrant D | 4,745,788 | 710,636 |
| Mode M9 | |||
|---|---|---|---|
| Quadrant | BADHDUFLAG | Total packets | Discarded packets |
| A | 0 | 14 | 0 |
| B | 0 | 15 | 0 |
| C | 0 | 15 | 0 |
| D | 0 | 15 | 0 |
| Mode M0 | |||
|---|---|---|---|
| Quadrant | BADHDUFLAG | Total packets | Discarded packets |
| A | 0 | 23503 | 0 |
| B | 0 | 17270 | 0 |
| C | 0 | 14361 | 0 |
| D | 0 | 18161 | 0 |
| Quadrant | Total seconds | Saturated seconds | Saturation percentage |
|---|---|---|---|
| A | 6123 | 1067 | 17.426098% |
| B | 6123 | 267 | 4.360608% |
| C | 6123 | 130 | 2.123142% |
| D | 6123 | 369 | 6.026458% |
Noise dominated data is calculated using 1-second bins in cleaned event files. If a bin has >2000 counts, and if more than 50% of those come from <1% of pixels, then it is considered to be noise-dominated and hence unusable.
| Quadrant | # 1 sec bins | Bins with >0 counts | Bins with >2000 counts | High rate bins dominated by noise | Noise dominated (total time) | Noise dominated (detector-on time) | Marked lightcurve |
|---|---|---|---|---|---|---|---|
| A | 7473 | 6123 | 836 | 836 | 11.19% | 13.65% | 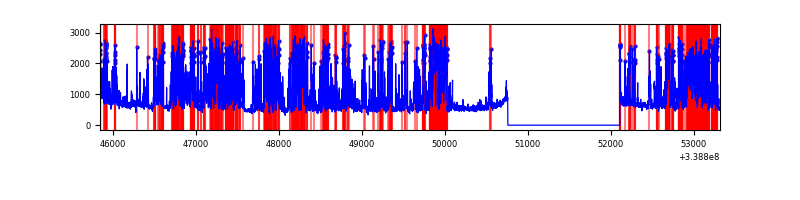 |
| B | 7473 | 6123 | 82 | 82 | 1.10% | 1.34% | 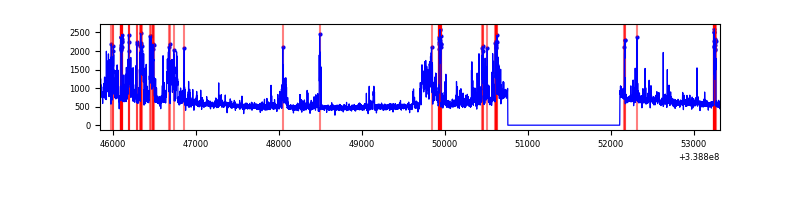 |
| C | 7473 | 6123 | 15 | 15 | 0.20% | 0.24% | 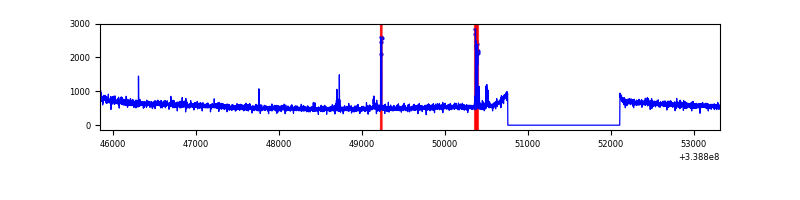 |
| D | 7473 | 6123 | 339 | 339 | 4.54% | 5.54% |  |
Top three noisy pixels from each quadrant. If the there are fewer than three noisy pixels in the level2.evt file, extra rows are filled as -1
| Pixel properties | Quadrant properties | ||||||
|---|---|---|---|---|---|---|---|
| Quadrant | DetID | PixID | Counts | Sigma | Mean | Median | Sigma |
| A | 14 | 235 | 3153637 | 19633.29 | 807 | 797 | 160.6 |
| A | 6 | 16 | 188417 | 1168.34 | 807 | 797 | 160.6 |
| A | 8 | 192 | 29291 | 177.44 | 807 | 797 | 160.6 |
| B | 0 | 189 | 1059691 | 6535.11 | 864 | 845 | 162.0 |
| B | 12 | 111 | 18688 | 110.13 | 864 | 845 | 162.0 |
| B | 0 | 219 | 17069 | 100.13 | 864 | 845 | 162.0 |
| C | 14 | 238 | 137870 | 693.55 | 848 | 858 | 197.6 |
| C | 15 | 208 | 68000 | 339.87 | 848 | 858 | 197.6 |
| C | 13 | 61 | 5648 | 24.25 | 848 | 858 | 197.6 |
| D | 1 | 52 | 1151523 | 5904.22 | 816 | 797 | 194.9 |
| D | 12 | 233 | 416014 | 2130.42 | 816 | 797 | 194.9 |
| D | 2 | 250 | 71320 | 361.84 | 816 | 797 | 194.9 |
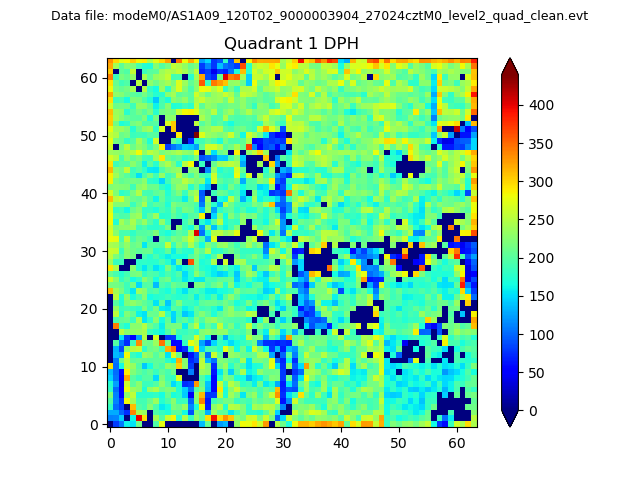
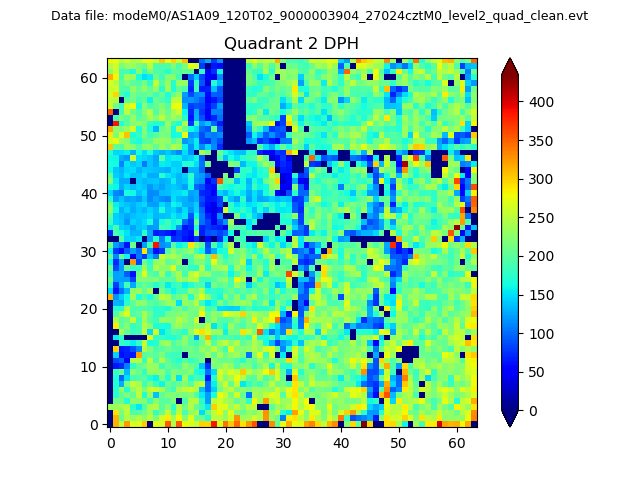
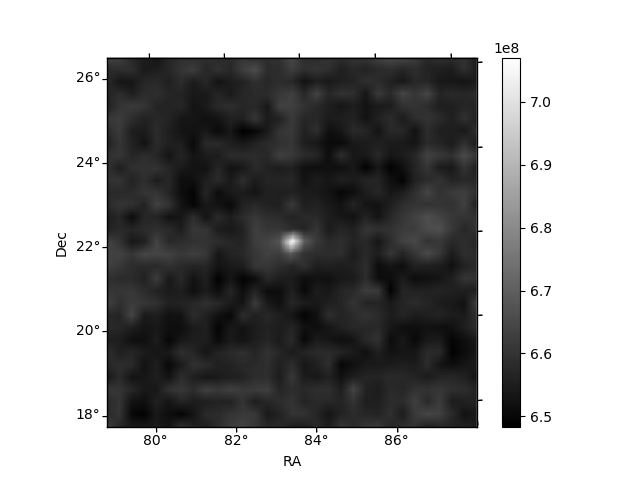
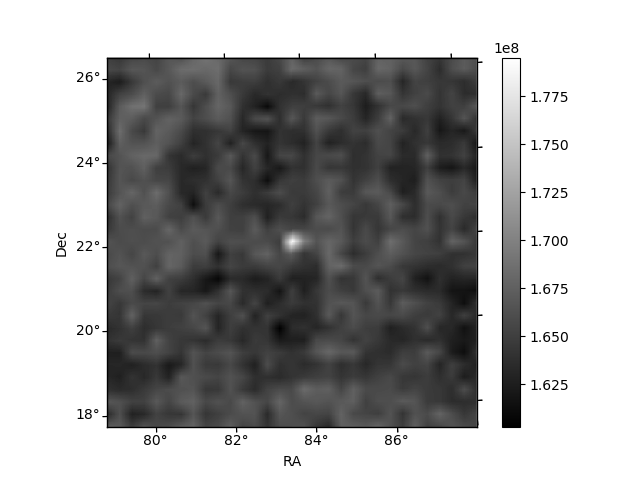
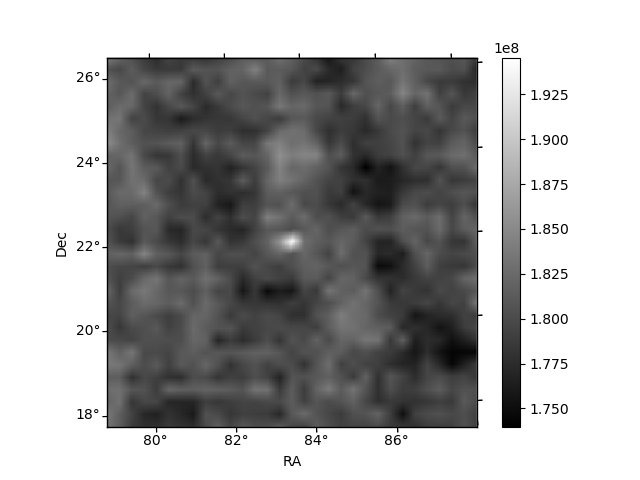
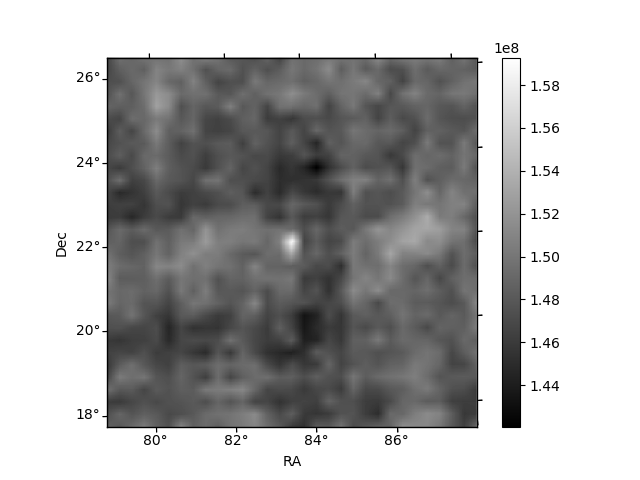
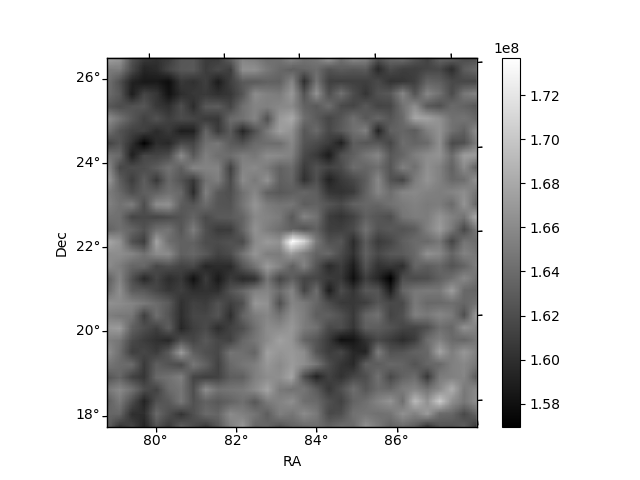
Histogram calculated using DETX and DETY for each event in the final _common_clean file
| Quadrant A | 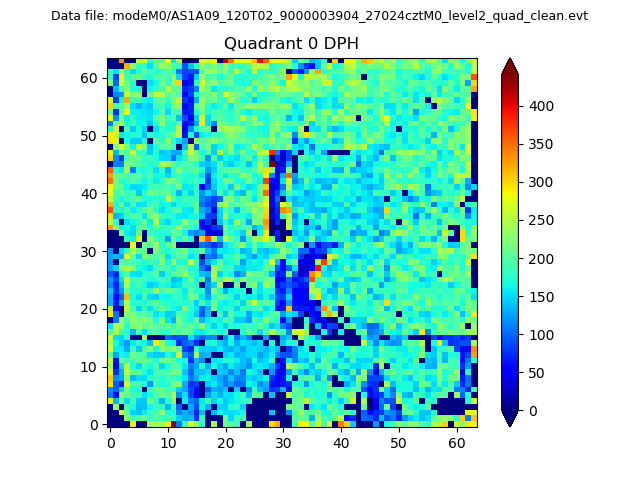 |
 |
Quadrant B |
|---|---|---|---|
| Quadrant D | 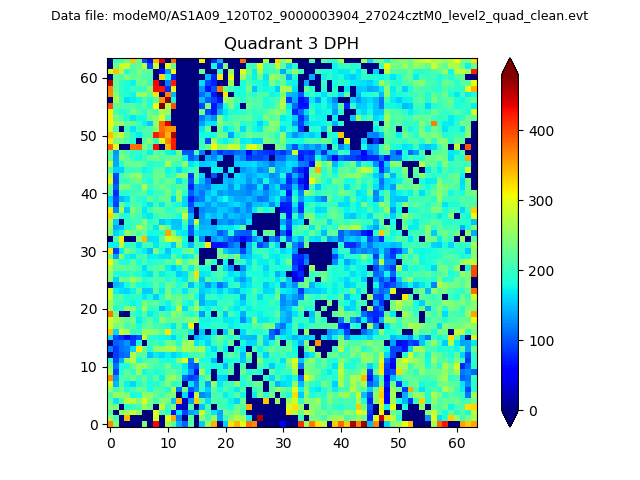 |
 |
Quadrant C |
| Plot type | Count rate plots | Images |
|---|---|---|
| Comparison with Poisson distribution Blue bars denote a histogram of data divided into 1 sec bins. Red curve is a Poisson curve with rate = median count rate of data. |
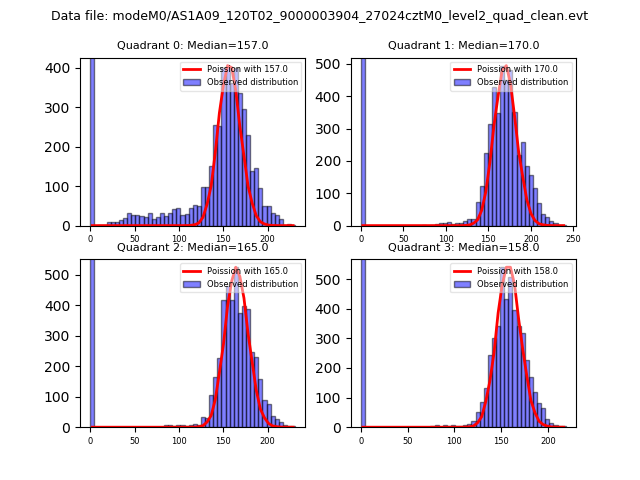 |
 |
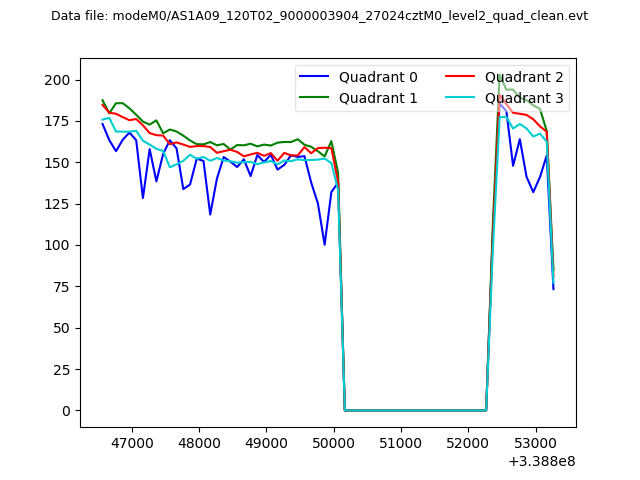
| Quadrant-wise count rates Data is divided into 100 sec bins |
 |
|
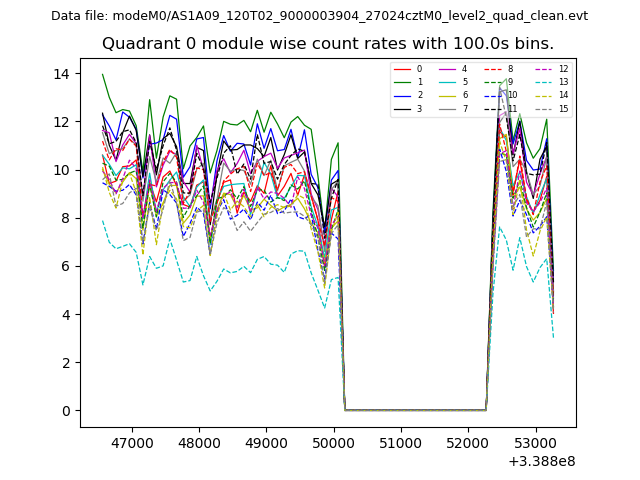
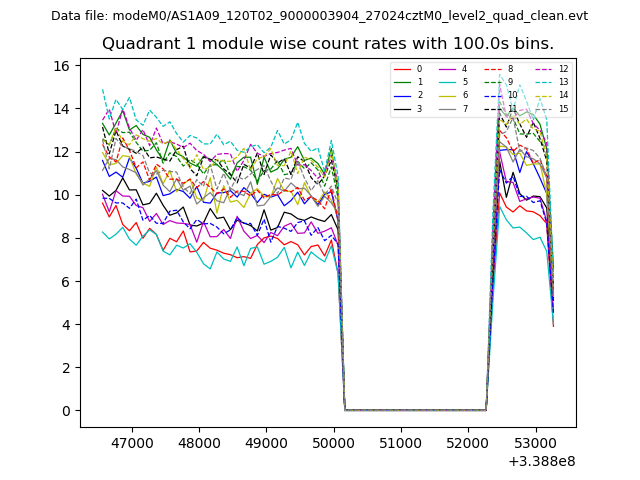
| Module-wise count rates for Quadrant A Data is divided into 100 sec bins |
 |
 |
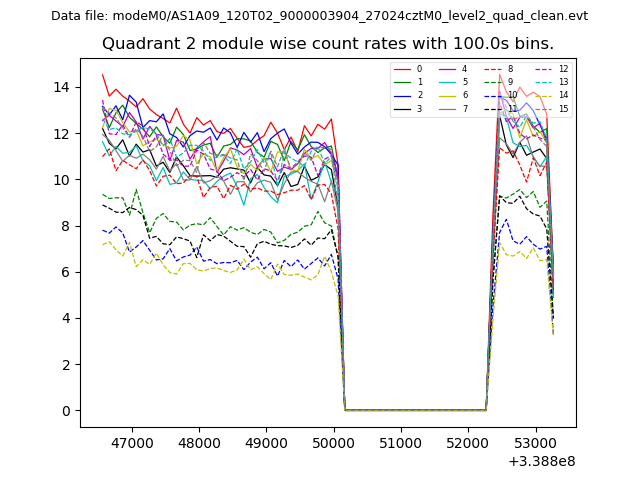
| Module-wise count rates for Quadrant B Data is divided into 100 sec bins |
 |
 |
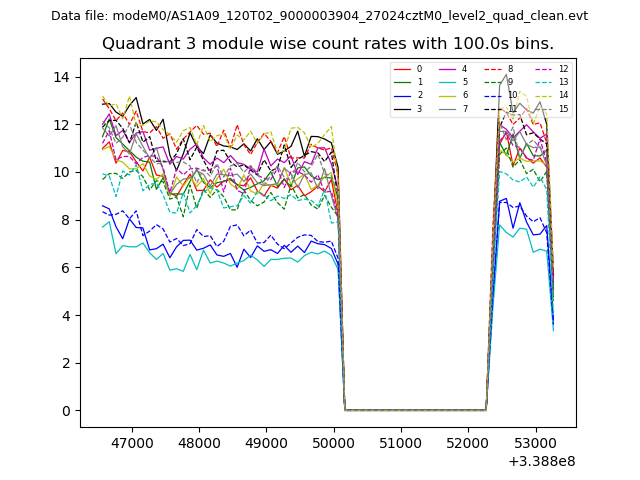
| Module-wise count rates for Quadrant C Data is divided into 100 sec bins |
 |
 |
| Module-wise count rates for Quadrant D Data is divided into 100 sec bins |
 |
 |
| Parameter | Plot |
|---|---|
| CZT HV Monitor |  |
| D_VDD | 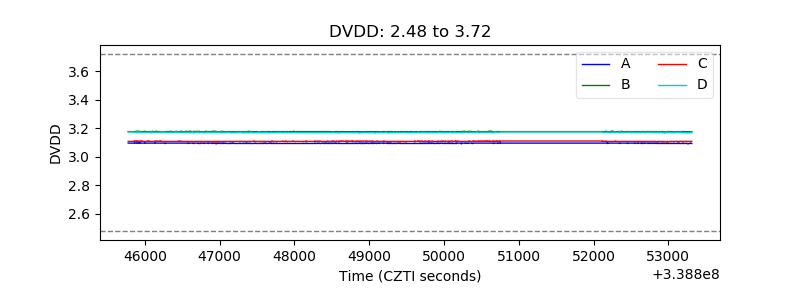 |
| Temperature 1 |  |
| Veto HV Monitor | 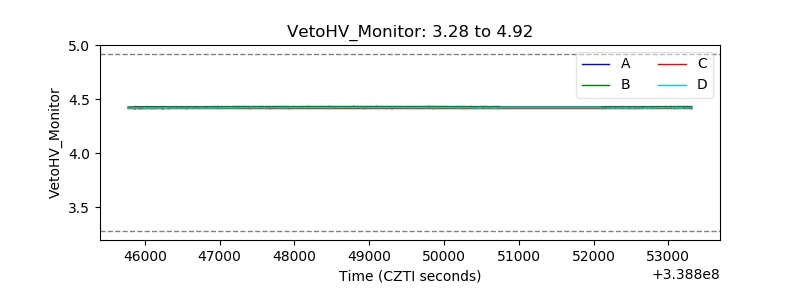 |
| Veto LLD |  |
| Alpha Counter | 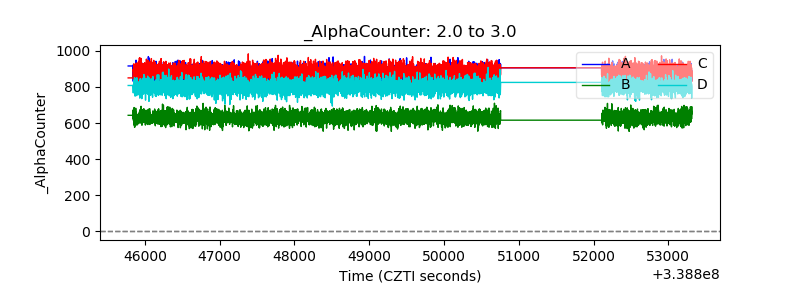 |
| _CPM_Rate | 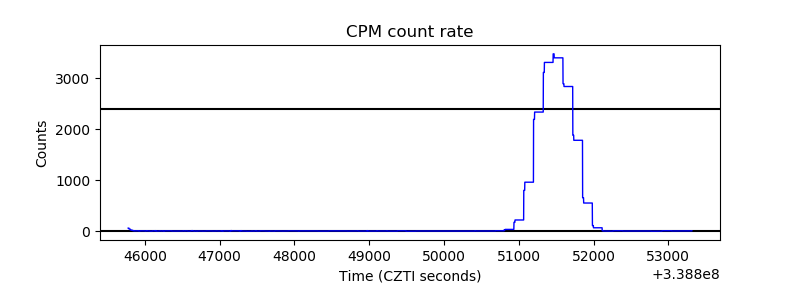 |
| CZT Counter | 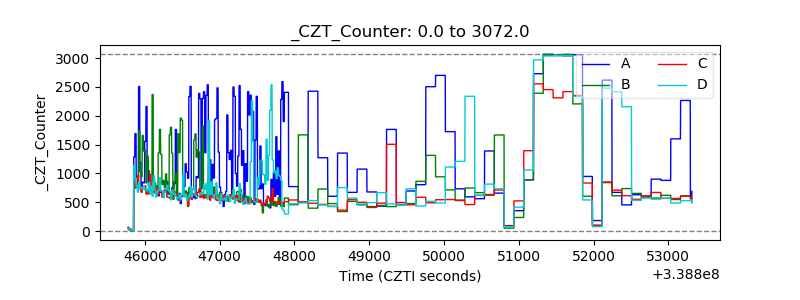 |
| +2.5 Volts monitor |  |
| +5 Volts monitor |  |
| _ROLL_ROT | 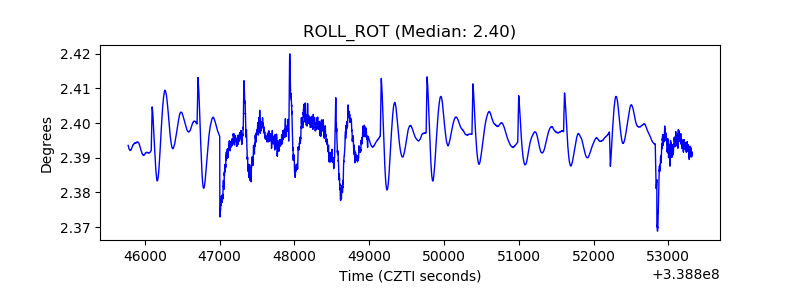 |
| _Roll_DEC | 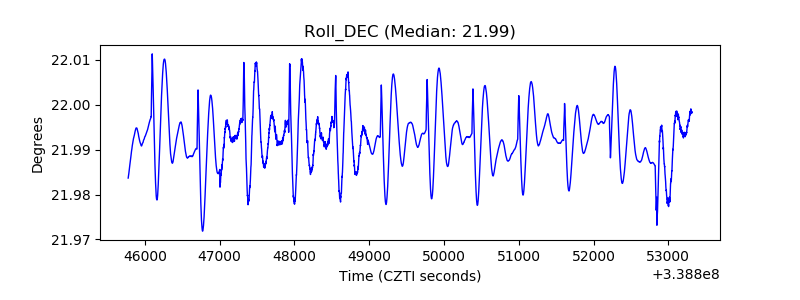 |
| _Roll_RA | 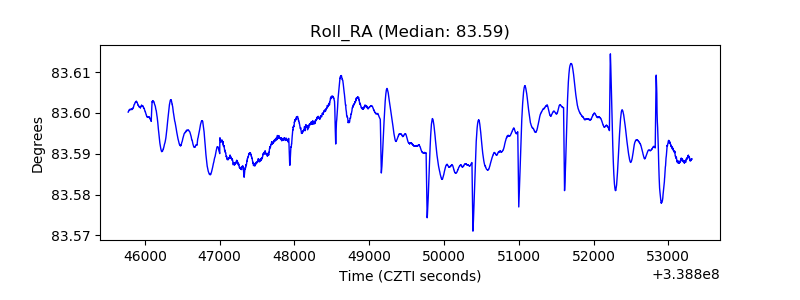 |
| Veto Counter | 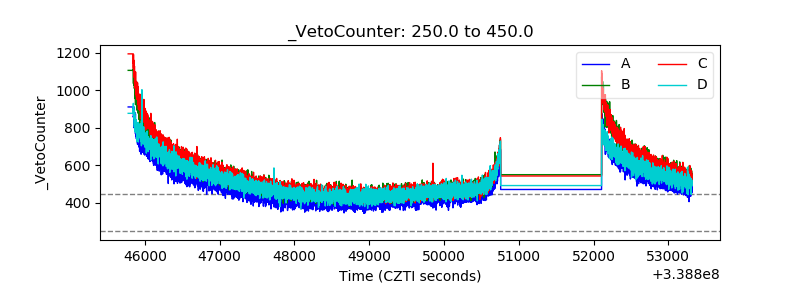 |