| Param | Original file | Final file |
|---|---|---|
| Filename | modeM0/AS1A09_120T02_9000003904_27025cztM0_level2.evt | modeM0/AS1A09_120T02_9000003904_27025cztM0_level2_quad_clean.evt |
| Size (bytes) | 601,125,120 | 115,338,240 |
| Size | 573.3 MB | 110.0 MB |
| Events in quadrant A | 7,240,217 | 670,319 |
| Events in quadrant B | 3,731,830 | 838,464 |
| Events in quadrant C | 3,245,529 | 802,113 |
| Events in quadrant D | 3,582,020 | 763,761 |
| Mode M9 | |||
|---|---|---|---|
| Quadrant | BADHDUFLAG | Total packets | Discarded packets |
| A | 0 | 13 | 0 |
| B | 0 | 13 | 0 |
| C | 0 | 13 | 0 |
| D | 0 | 13 | 0 |
| Mode M0 | |||
|---|---|---|---|
| Quadrant | BADHDUFLAG | Total packets | Discarded packets |
| A | 0 | 25609 | 0 |
| B | 0 | 14906 | 0 |
| C | 0 | 13293 | 0 |
| D | 0 | 14501 | 0 |
| Quadrant | Total seconds | Saturated seconds | Saturation percentage |
|---|---|---|---|
| A | 5983 | 1784 | 29.817817% |
| B | 5983 | 168 | 2.807956% |
| C | 5984 | 103 | 1.721257% |
| D | 5984 | 131 | 2.189171% |
Noise dominated data is calculated using 1-second bins in cleaned event files. If a bin has >2000 counts, and if more than 50% of those come from <1% of pixels, then it is considered to be noise-dominated and hence unusable.
| Quadrant | # 1 sec bins | Bins with >0 counts | Bins with >2000 counts | High rate bins dominated by noise | Noise dominated (total time) | Noise dominated (detector-on time) | Marked lightcurve |
|---|---|---|---|---|---|---|---|
| A | 7288 | 5983 | 1407 | 1407 | 19.31% | 23.52% | 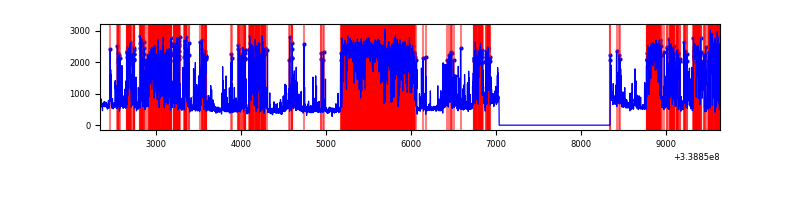 |
| B | 7288 | 5983 | 33 | 33 | 0.45% | 0.55% | 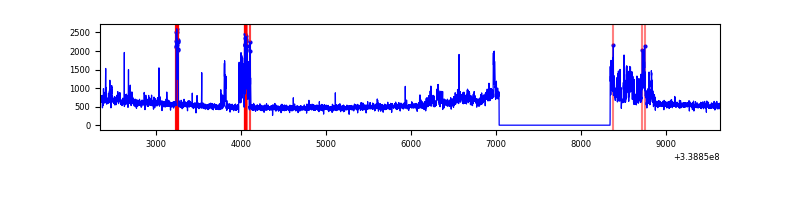 |
| C | 7289 | 5984 | 0 | 0 | 0.00% | 0.00% | 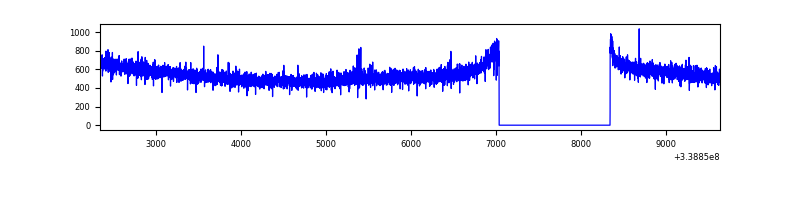 |
| D | 7289 | 5984 | 62 | 62 | 0.85% | 1.04% | 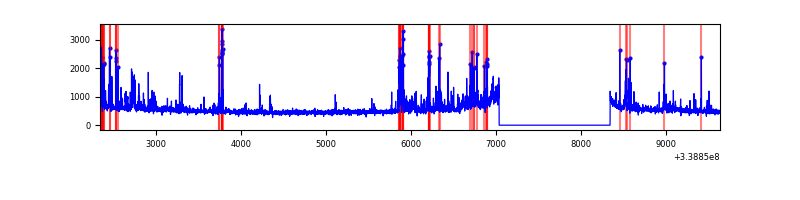 |
Top three noisy pixels from each quadrant. If the there are fewer than three noisy pixels in the level2.evt file, extra rows are filled as -1
| Pixel properties | Quadrant properties | ||||||
|---|---|---|---|---|---|---|---|
| Quadrant | DetID | PixID | Counts | Sigma | Mean | Median | Sigma |
| A | 14 | 235 | 4341412 | 30658.17 | 706 | 695 | 141.6 |
| A | 6 | 16 | 171779 | 1208.35 | 706 | 695 | 141.6 |
| A | 13 | 254 | 8583 | 55.71 | 706 | 695 | 141.6 |
| B | 0 | 189 | 511864 | 3344.77 | 819 | 803 | 152.8 |
| B | 12 | 111 | 17784 | 111.13 | 819 | 803 | 152.8 |
| B | 11 | 111 | 15824 | 98.31 | 819 | 803 | 152.8 |
| C | 14 | 238 | 129328 | 686.15 | 798 | 809 | 187.3 |
| C | 14 | 225 | 6772 | 31.84 | 798 | 809 | 187.3 |
| C | 13 | 61 | 5131 | 23.07 | 798 | 809 | 187.3 |
| D | 1 | 52 | 384834 | 2033.47 | 790 | 775 | 188.9 |
| D | 2 | 250 | 127520 | 671.08 | 790 | 775 | 188.9 |
| D | 12 | 233 | 64223 | 335.94 | 790 | 775 | 188.9 |
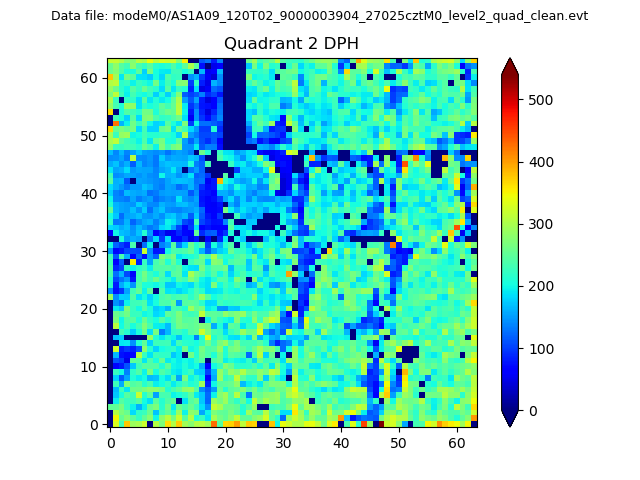
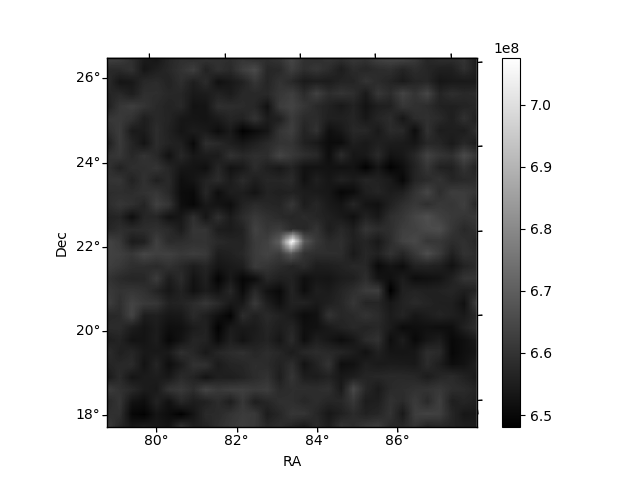
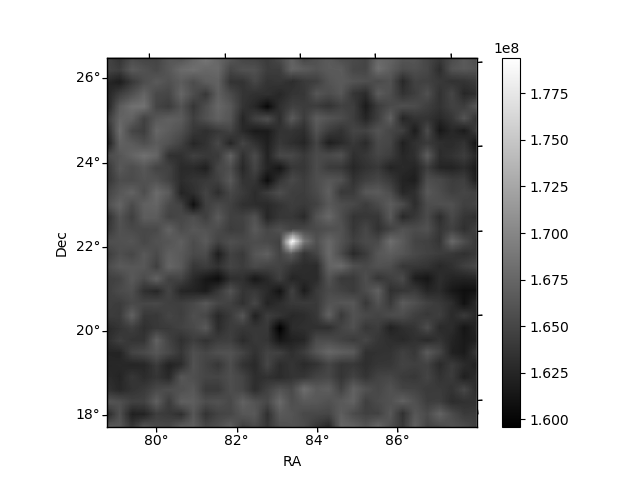
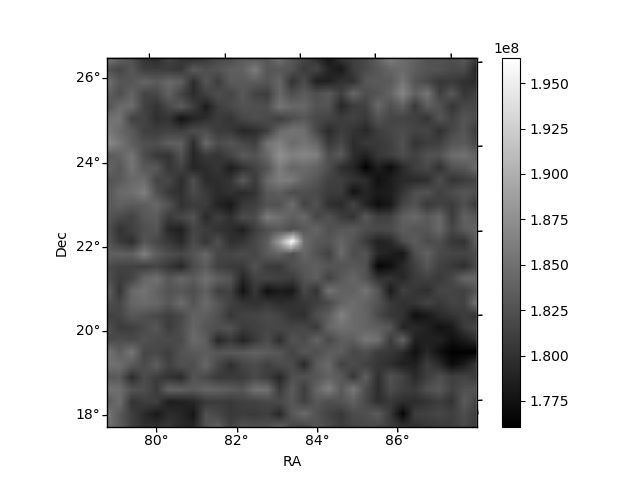
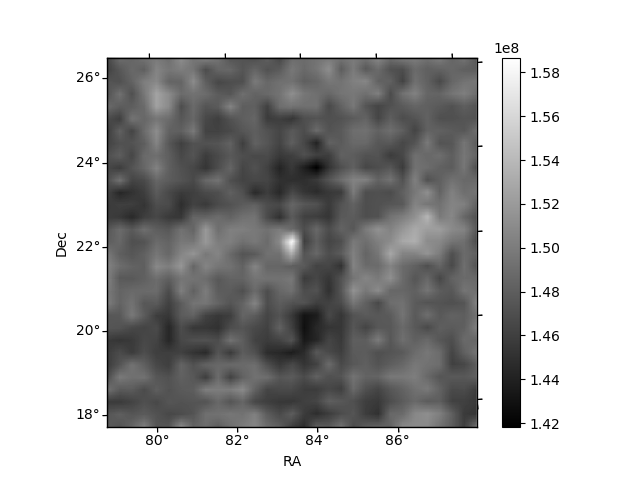
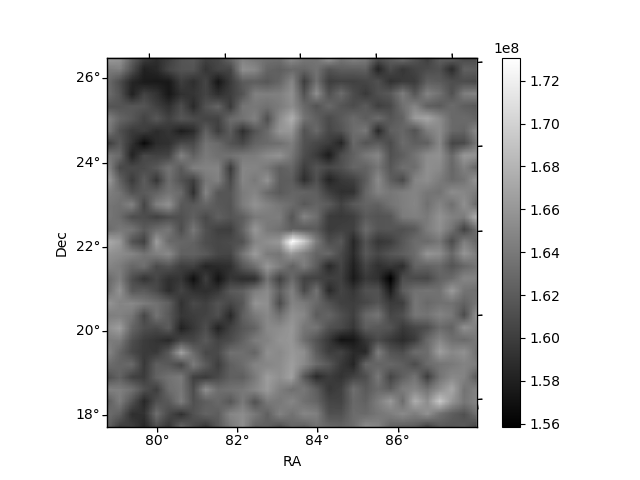
Histogram calculated using DETX and DETY for each event in the final _common_clean file
| Quadrant A | 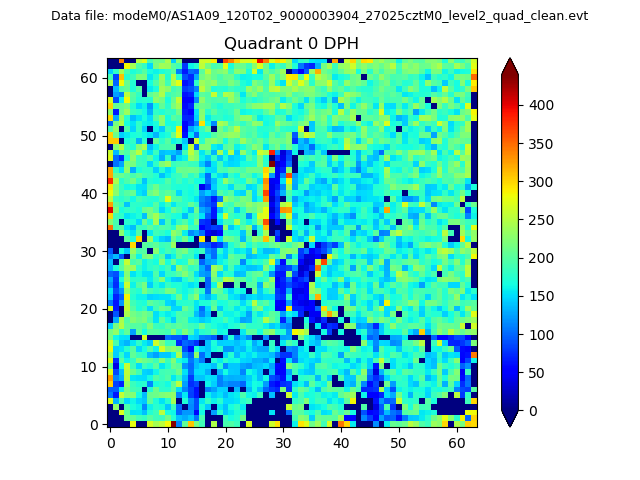 |
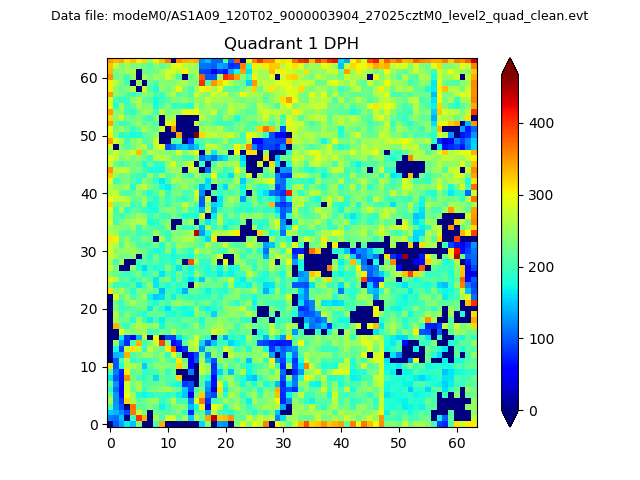 |
Quadrant B |
|---|---|---|---|
| Quadrant D | 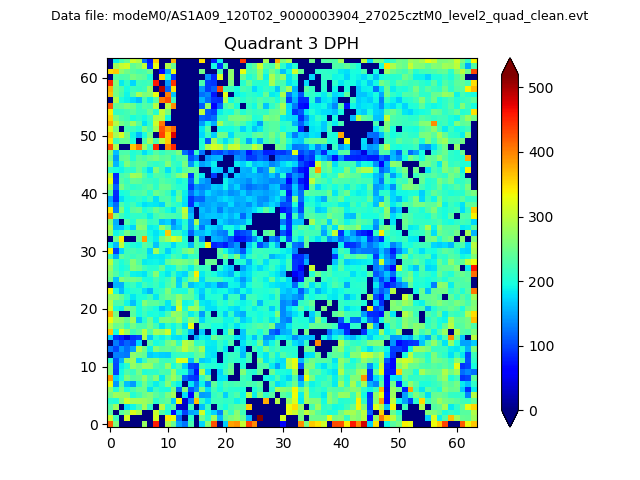 |
 |
Quadrant C |
| Plot type | Count rate plots | Images |
|---|---|---|
| Comparison with Poisson distribution Blue bars denote a histogram of data divided into 1 sec bins. Red curve is a Poisson curve with rate = median count rate of data. |
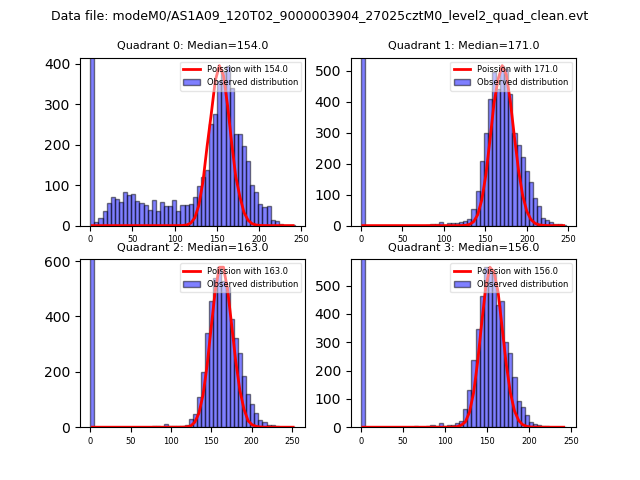 |
 |
| Quadrant-wise count rates Data is divided into 100 sec bins |
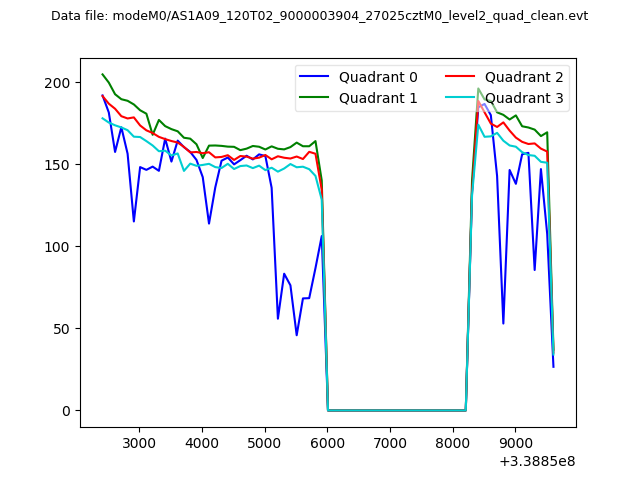 |
|
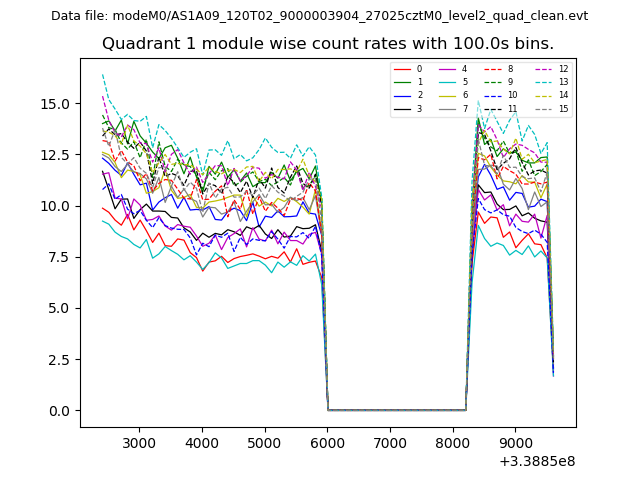
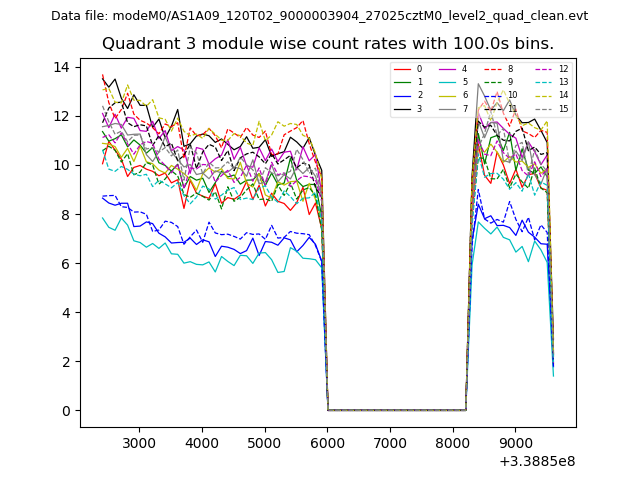
| Module-wise count rates for Quadrant A Data is divided into 100 sec bins |
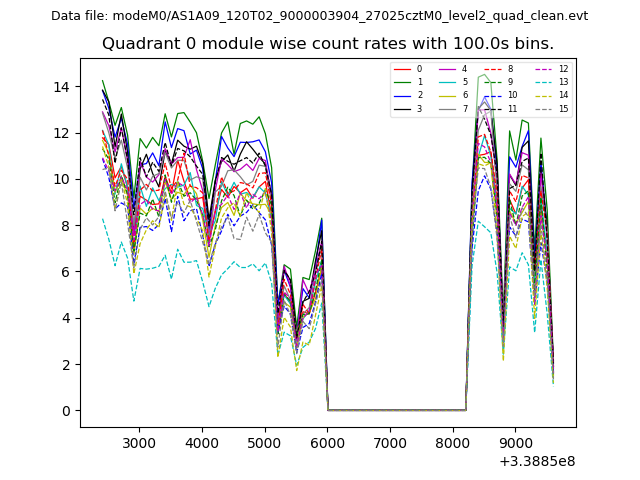 |
 |
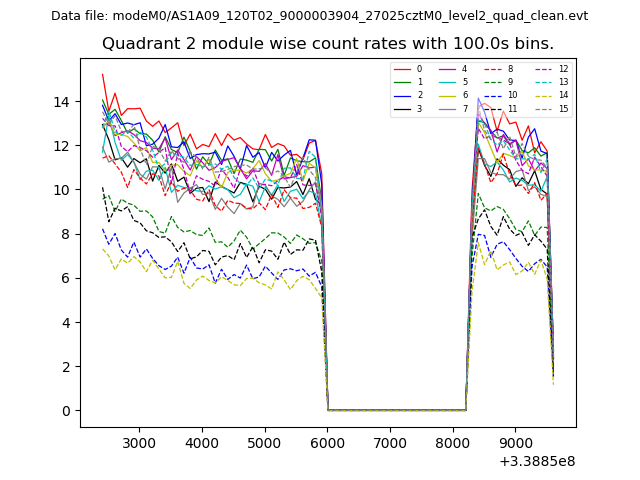
| Module-wise count rates for Quadrant B Data is divided into 100 sec bins |
 |
 |
| Module-wise count rates for Quadrant C Data is divided into 100 sec bins |
 |
 |
| Module-wise count rates for Quadrant D Data is divided into 100 sec bins |
 |
 |
| Parameter | Plot |
|---|---|
| CZT HV Monitor | 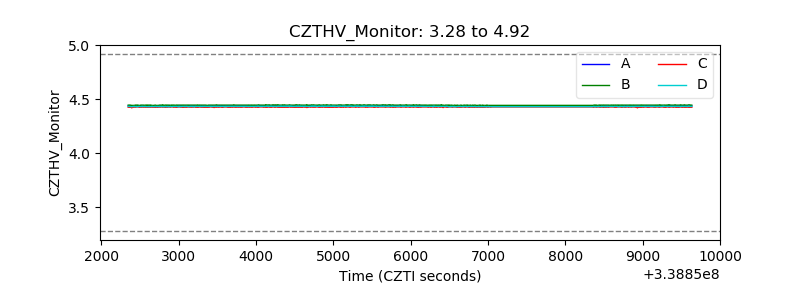 |
| D_VDD | 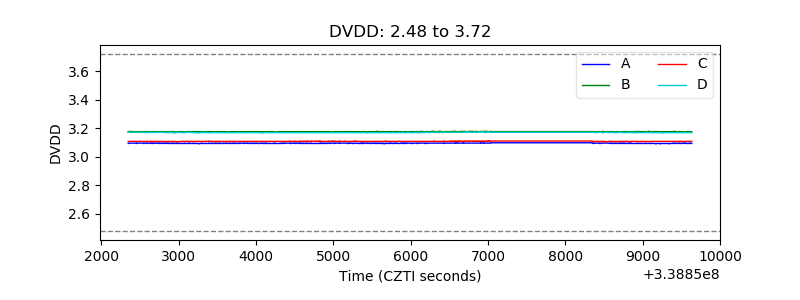 |
| Temperature 1 | 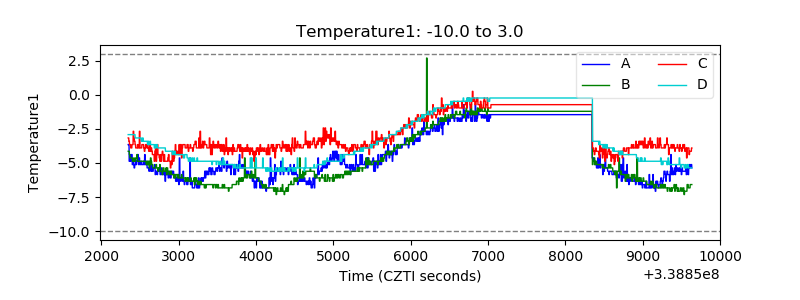 |
| Veto HV Monitor | 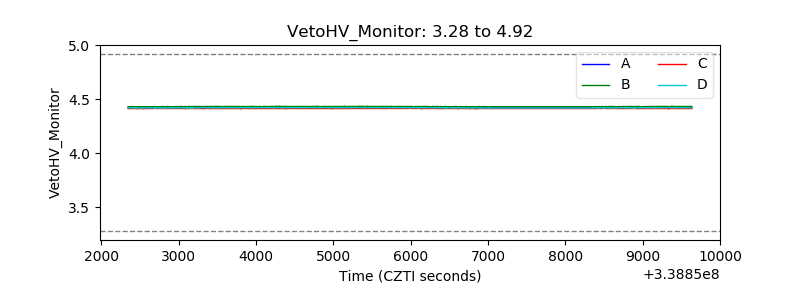 |
| Veto LLD |  |
| Alpha Counter | 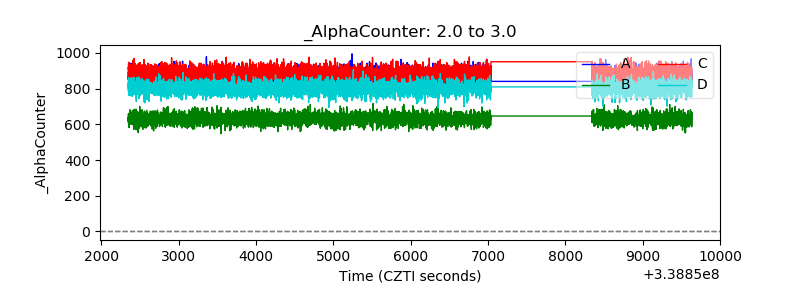 |
| _CPM_Rate | 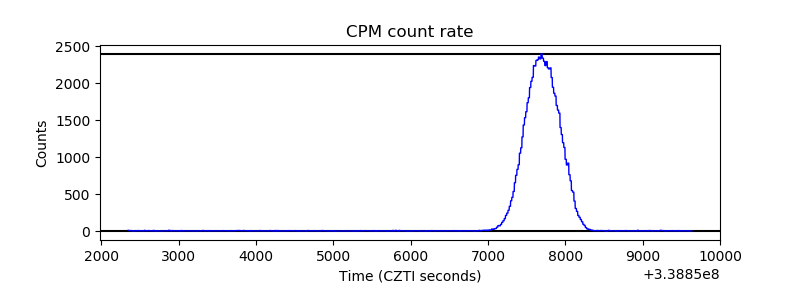 |
| CZT Counter | 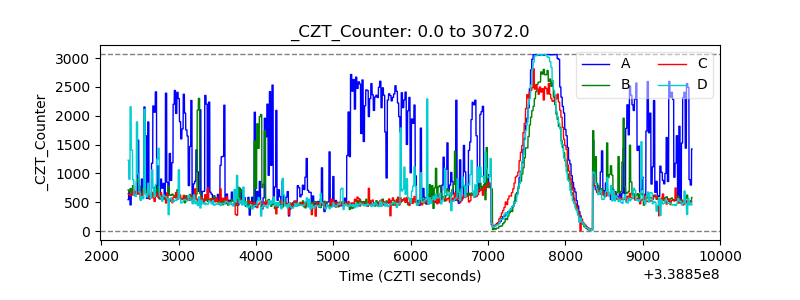 |
| +2.5 Volts monitor |  |
| +5 Volts monitor | 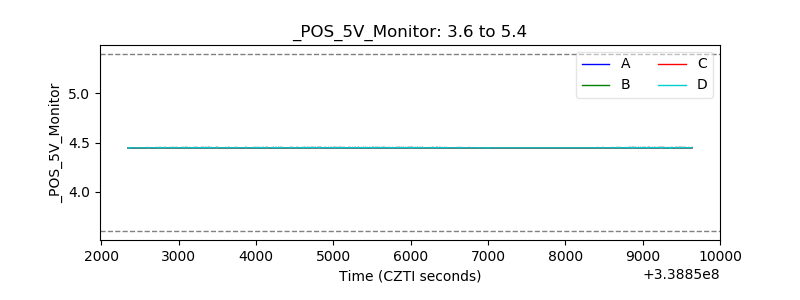 |
| _ROLL_ROT | 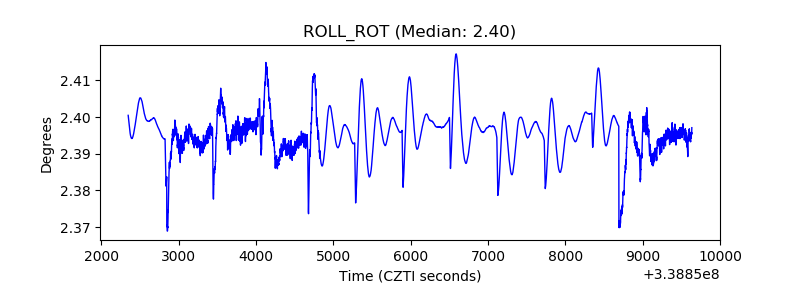 |
| _Roll_DEC | 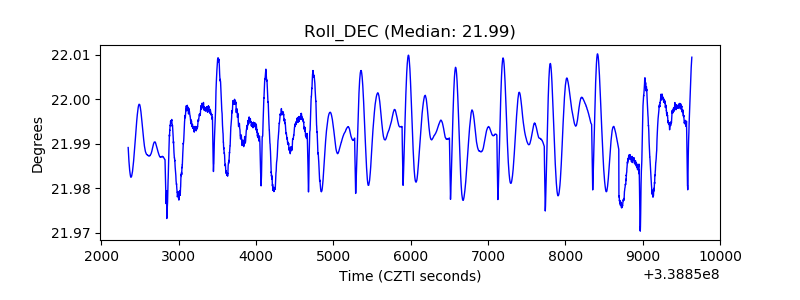 |
| _Roll_RA | 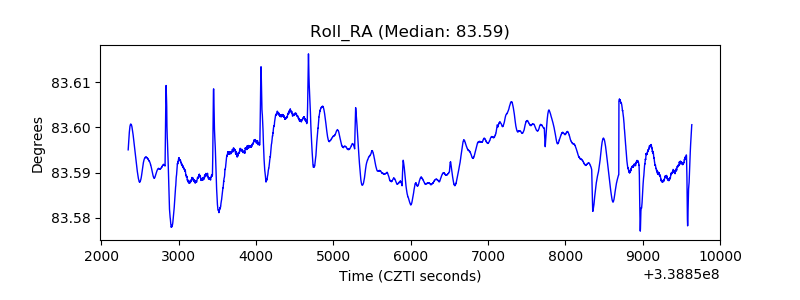 |
| Veto Counter | 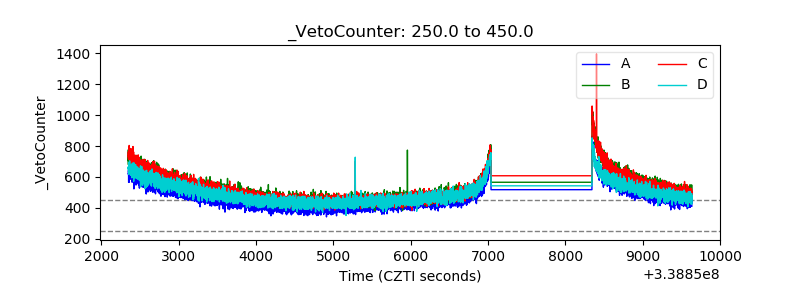 |