| Param | Original file | Final file |
|---|---|---|
| Filename | modeM0/AS1A09_120T02_9000003904_27026cztM0_level2.evt | modeM0/AS1A09_120T02_9000003904_27026cztM0_level2_quad_clean.evt |
| Size (bytes) | 610,689,600 | 114,232,320 |
| Size | 582.4 MB | 108.9 MB |
| Events in quadrant A | 6,647,849 | 693,335 |
| Events in quadrant B | 3,590,824 | 810,658 |
| Events in quadrant C | 3,390,005 | 771,387 |
| Events in quadrant D | 4,430,133 | 734,928 |
| Mode M9 | |||
|---|---|---|---|
| Quadrant | BADHDUFLAG | Total packets | Discarded packets |
| A | 0 | 17 | 0 |
| B | 0 | 18 | 0 |
| C | 0 | 18 | 0 |
| D | 0 | 18 | 0 |
| Mode M0 | |||
|---|---|---|---|
| Quadrant | BADHDUFLAG | Total packets | Discarded packets |
| A | 0 | 24111 | 0 |
| B | 0 | 14542 | 0 |
| C | 0 | 13943 | 0 |
| D | 0 | 17261 | 0 |
| Quadrant | Total seconds | Saturated seconds | Saturation percentage |
|---|---|---|---|
| A | 6433 | 1274 | 19.804135% |
| B | 6433 | 104 | 1.616664% |
| C | 6433 | 104 | 1.616664% |
| D | 6433 | 438 | 6.808643% |
Noise dominated data is calculated using 1-second bins in cleaned event files. If a bin has >2000 counts, and if more than 50% of those come from <1% of pixels, then it is considered to be noise-dominated and hence unusable.
| Quadrant | # 1 sec bins | Bins with >0 counts | Bins with >2000 counts | High rate bins dominated by noise | Noise dominated (total time) | Noise dominated (detector-on time) | Marked lightcurve |
|---|---|---|---|---|---|---|---|
| A | 7623 | 6433 | 974 | 974 | 12.78% | 15.14% | 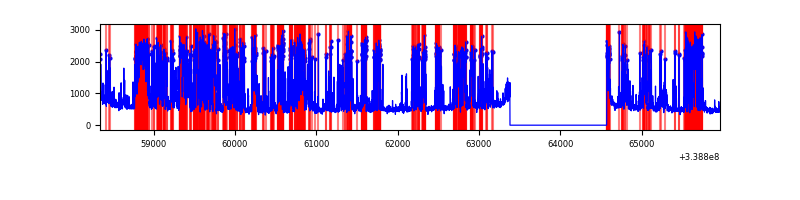 |
| B | 7623 | 6434 | 3 | 3 | 0.04% | 0.05% | 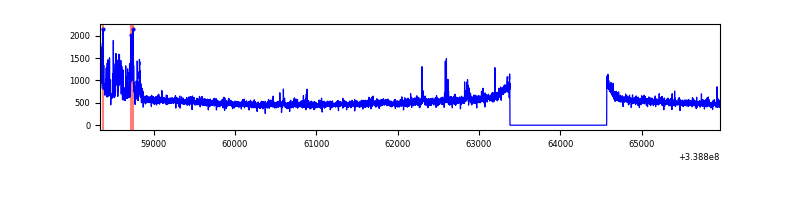 |
| C | 7623 | 6434 | 0 | 0 | 0.00% | 0.00% | 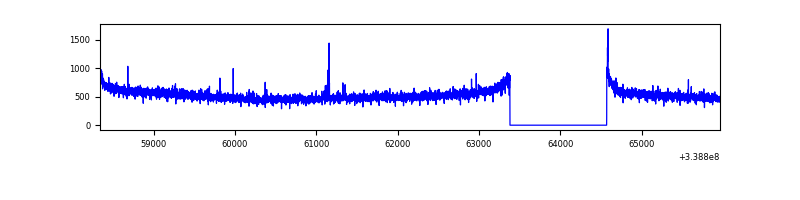 |
| D | 7623 | 6433 | 313 | 313 | 4.11% | 4.87% | 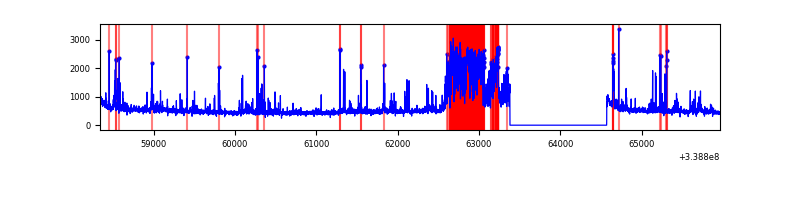 |
Top three noisy pixels from each quadrant. If the there are fewer than three noisy pixels in the level2.evt file, extra rows are filled as -1
| Pixel properties | Quadrant properties | ||||||
|---|---|---|---|---|---|---|---|
| Quadrant | DetID | PixID | Counts | Sigma | Mean | Median | Sigma |
| A | 14 | 235 | 3573925 | 22858.56 | 779 | 767 | 156.3 |
| A | 6 | 16 | 55337 | 349.1 | 779 | 767 | 156.3 |
| A | 8 | 192 | 16691 | 101.87 | 779 | 767 | 156.3 |
| B | 0 | 189 | 188494 | 1149.39 | 861 | 843 | 163.3 |
| B | 0 | 219 | 21698 | 127.74 | 861 | 843 | 163.3 |
| B | 12 | 111 | 19023 | 111.36 | 861 | 843 | 163.3 |
| C | 14 | 238 | 133719 | 679.72 | 830 | 840 | 195.5 |
| C | 15 | 208 | 11195 | 52.97 | 830 | 840 | 195.5 |
| C | 14 | 225 | 8056 | 36.91 | 830 | 840 | 195.5 |
| D | 12 | 233 | 843703 | 4395.42 | 807 | 789 | 191.8 |
| D | 1 | 52 | 456620 | 2376.95 | 807 | 789 | 191.8 |
| D | 2 | 250 | 63688 | 327.99 | 807 | 789 | 191.8 |
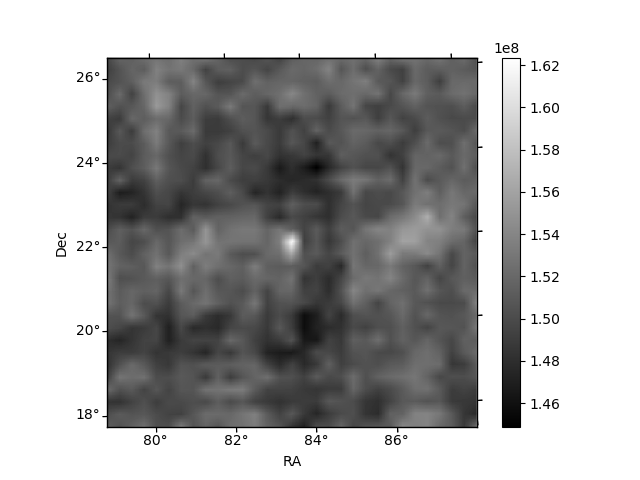
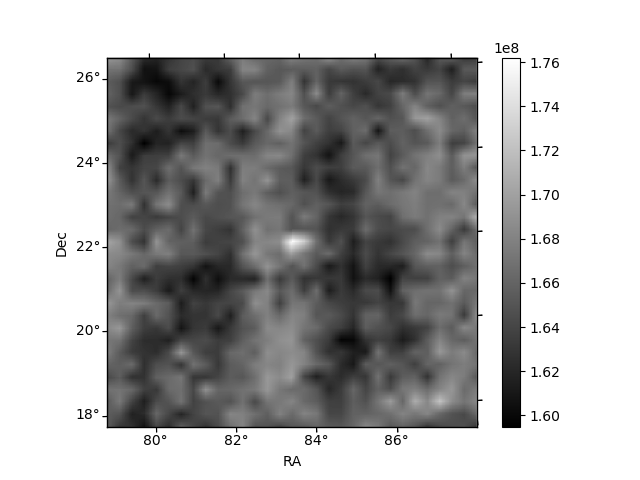
Histogram calculated using DETX and DETY for each event in the final _common_clean file
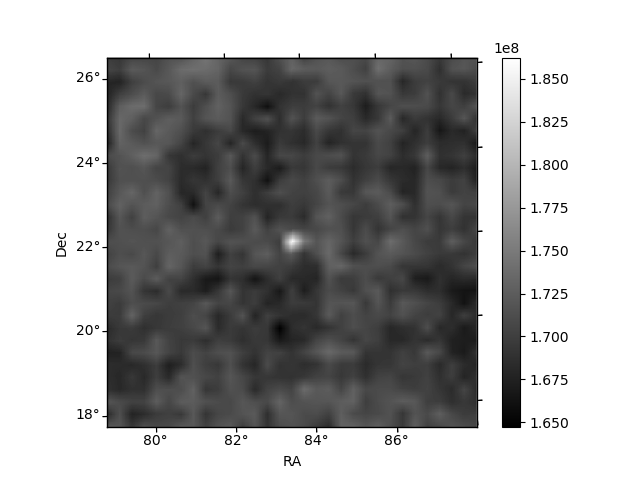
| Quadrant A |  |
 |
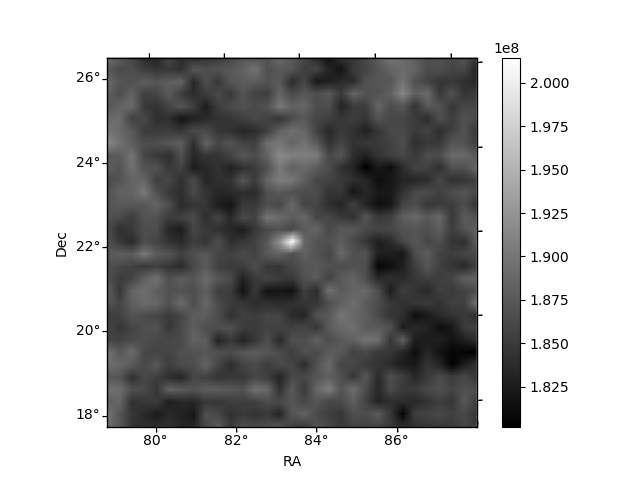
Quadrant B |
|---|---|---|---|
| Quadrant D |  |
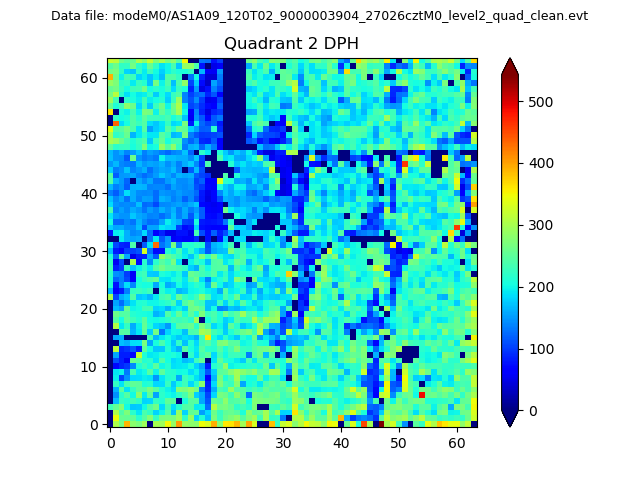 |
Quadrant C |
| Plot type | Count rate plots | Images |
|---|---|---|
| Comparison with Poisson distribution Blue bars denote a histogram of data divided into 1 sec bins. Red curve is a Poisson curve with rate = median count rate of data. |
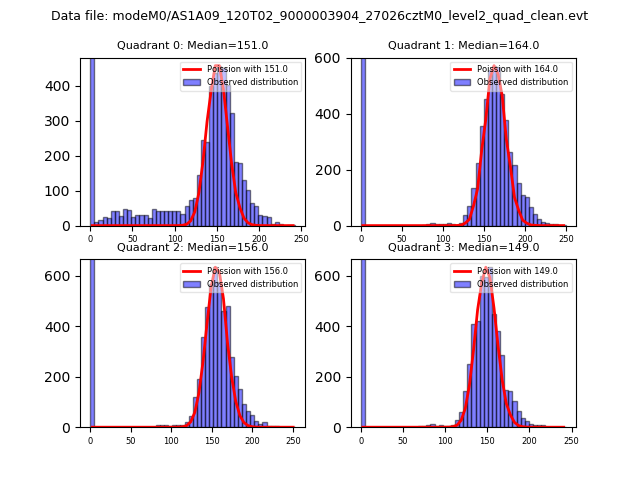 |
 |
| Quadrant-wise count rates Data is divided into 100 sec bins |
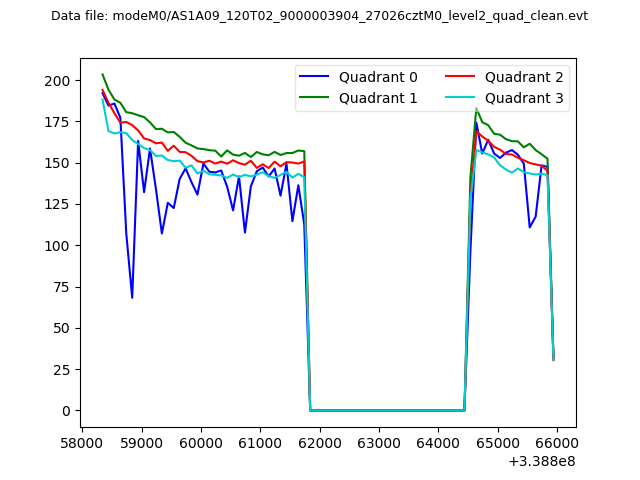 |
|
| Module-wise count rates for Quadrant A Data is divided into 100 sec bins |
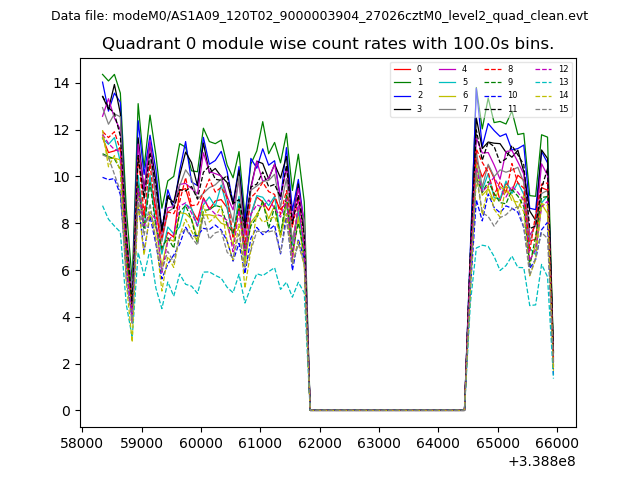 |
 |
| Module-wise count rates for Quadrant B Data is divided into 100 sec bins |
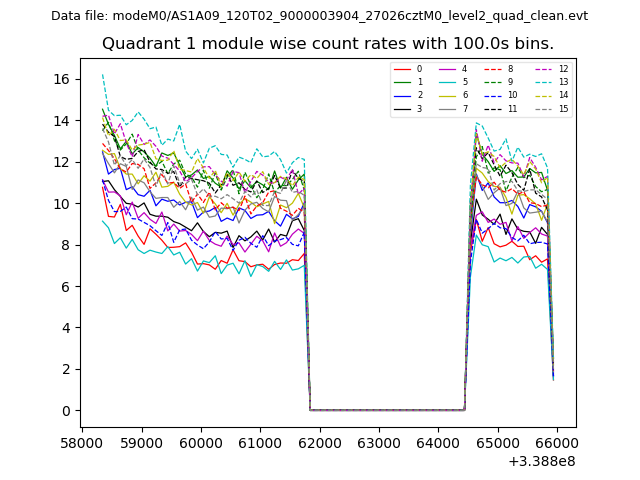 |
 |
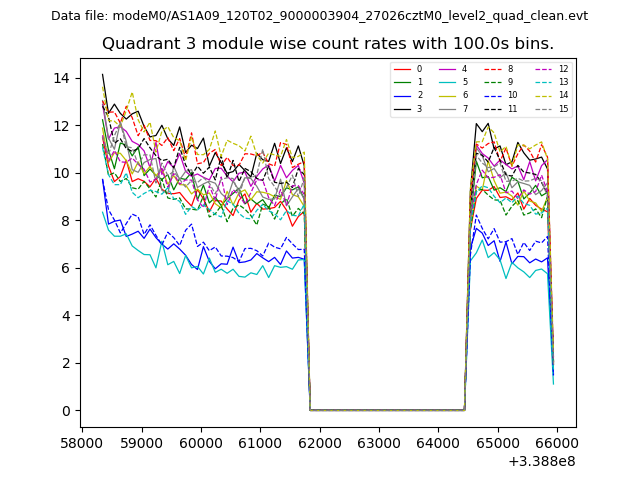
| Module-wise count rates for Quadrant C Data is divided into 100 sec bins |
 |
 |
| Module-wise count rates for Quadrant D Data is divided into 100 sec bins |
 |
 |
| Parameter | Plot |
|---|---|
| CZT HV Monitor |  |
| D_VDD | 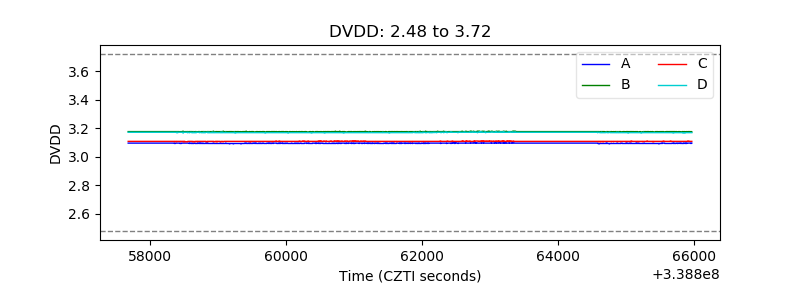 |
| Temperature 1 | 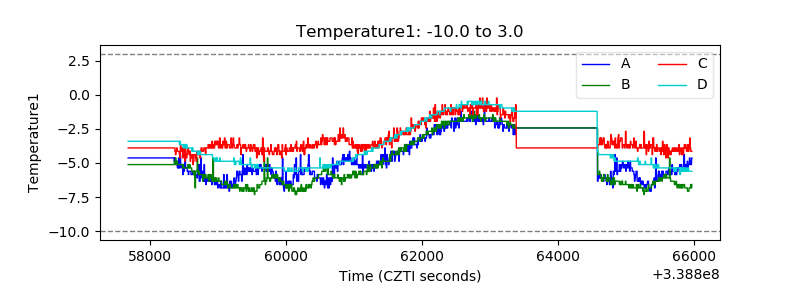 |
| Veto HV Monitor | 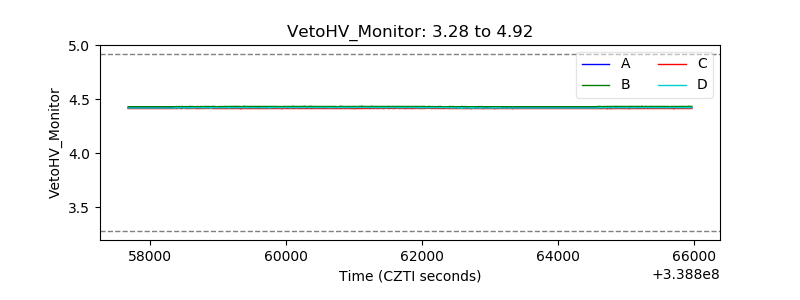 |
| Veto LLD | 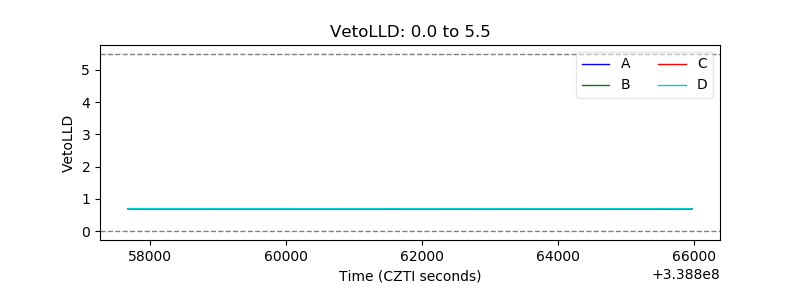 |
| Alpha Counter | 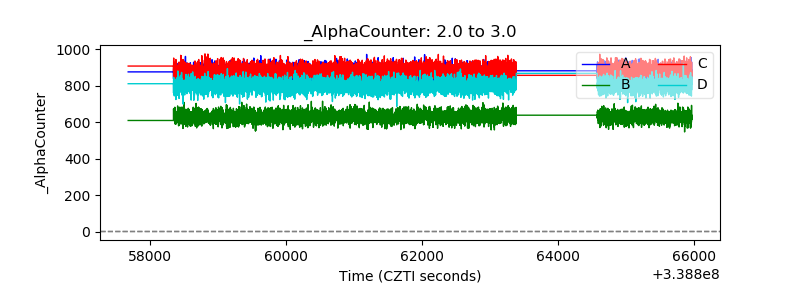 |
| _CPM_Rate | 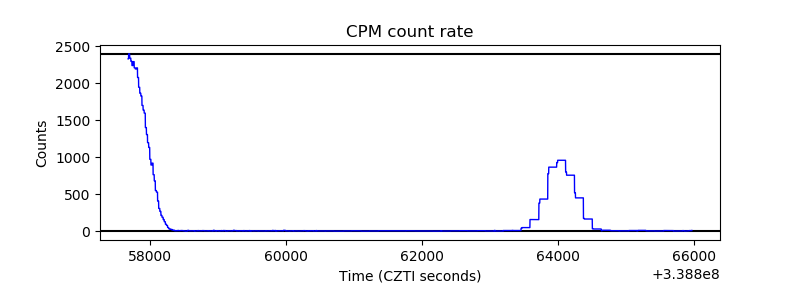 |
| CZT Counter | 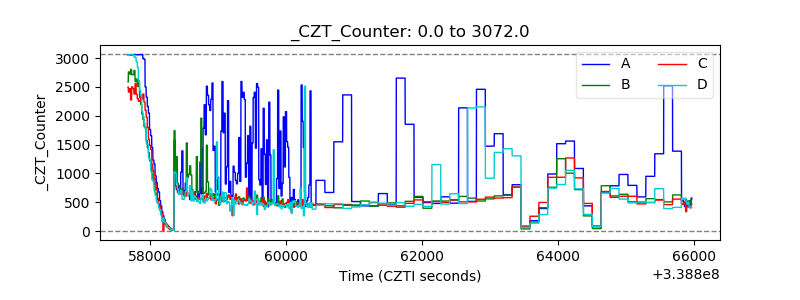 |
| +2.5 Volts monitor |  |
| +5 Volts monitor |  |
| _ROLL_ROT | 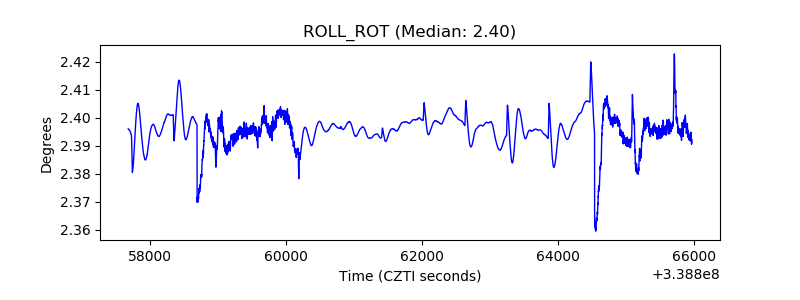 |
| _Roll_DEC | 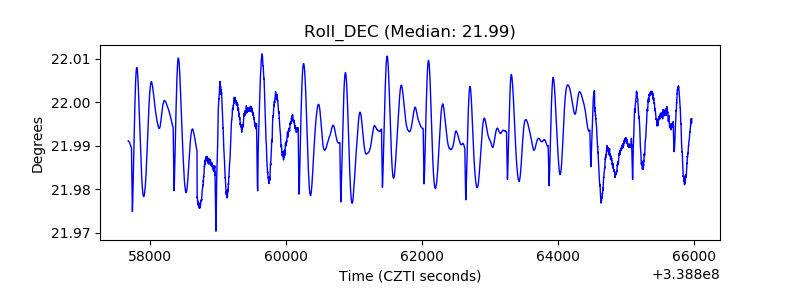 |
| _Roll_RA | 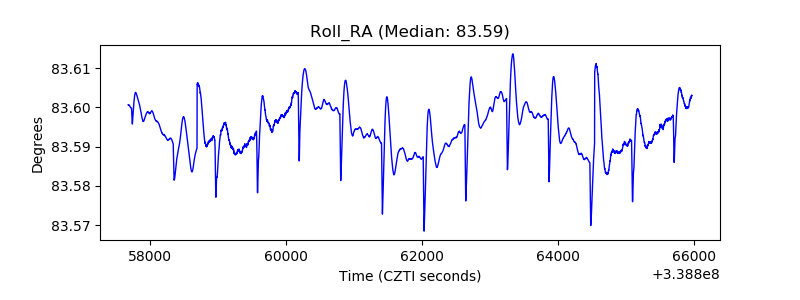 |
| Veto Counter |  |