| Param | Original file | Final file |
|---|---|---|
| Filename | modeM0/AS1A09_120T02_9000003904_27027cztM0_level2.evt | modeM0/AS1A09_120T02_9000003904_27027cztM0_level2_quad_clean.evt |
| Size (bytes) | 583,208,640 | 103,576,320 |
| Size | 556.2 MB | 98.8 MB |
| Events in quadrant A | 5,544,377 | 644,560 |
| Events in quadrant B | 3,452,901 | 708,881 |
| Events in quadrant C | 3,397,919 | 674,703 |
| Events in quadrant D | 4,811,521 | 639,489 |
| Mode M9 | |||
|---|---|---|---|
| Quadrant | BADHDUFLAG | Total packets | Discarded packets |
| A | 0 | 15 | 0 |
| B | 0 | 16 | 0 |
| C | 0 | 16 | 0 |
| D | 0 | 16 | 0 |
| Mode M0 | |||
|---|---|---|---|
| Quadrant | BADHDUFLAG | Total packets | Discarded packets |
| A | 0 | 20868 | 0 |
| B | 0 | 14282 | 0 |
| C | 0 | 14140 | 0 |
| D | 0 | 18778 | 0 |
| Quadrant | Total seconds | Saturated seconds | Saturation percentage |
|---|---|---|---|
| A | 6731 | 563 | 8.364285% |
| B | 6731 | 71 | 1.054821% |
| C | 6731 | 100 | 1.485663% |
| D | 6730 | 280 | 4.160475% |
Noise dominated data is calculated using 1-second bins in cleaned event files. If a bin has >2000 counts, and if more than 50% of those come from <1% of pixels, then it is considered to be noise-dominated and hence unusable.
| Quadrant | # 1 sec bins | Bins with >0 counts | Bins with >2000 counts | High rate bins dominated by noise | Noise dominated (total time) | Noise dominated (detector-on time) | Marked lightcurve |
|---|---|---|---|---|---|---|---|
| A | 7661 | 6732 | 488 | 488 | 6.37% | 7.25% | 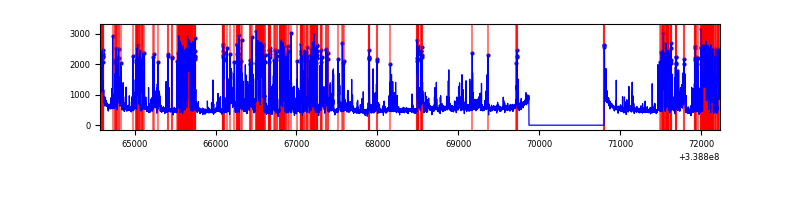 |
| B | 7661 | 6732 | 5 | 5 | 0.07% | 0.07% | 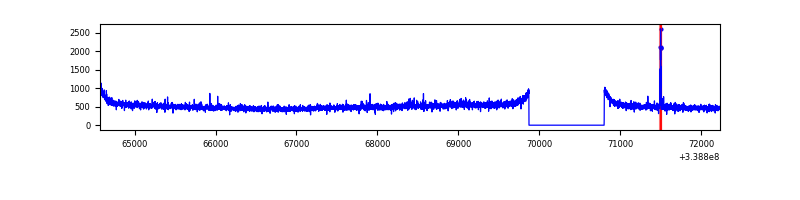 |
| C | 7661 | 6732 | 0 | 0 | 0.00% | 0.00% | 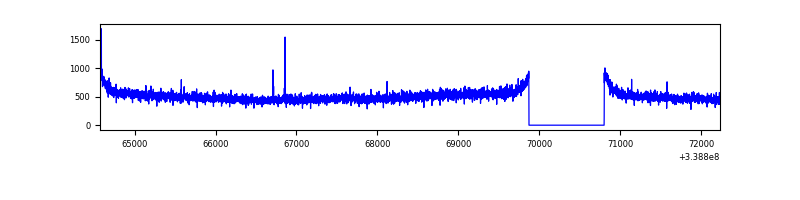 |
| D | 7659 | 6730 | 215 | 215 | 2.81% | 3.19% | 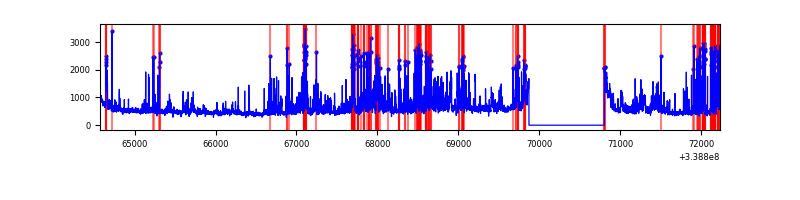 |
Top three noisy pixels from each quadrant. If the there are fewer than three noisy pixels in the level2.evt file, extra rows are filled as -1
| Pixel properties | Quadrant properties | ||||||
|---|---|---|---|---|---|---|---|
| Quadrant | DetID | PixID | Counts | Sigma | Mean | Median | Sigma |
| A | 14 | 235 | 2288755 | 13616.29 | 836 | 821 | 168.0 |
| A | 8 | 192 | 23058 | 132.34 | 836 | 821 | 168.0 |
| A | 13 | 254 | 10318 | 56.52 | 836 | 821 | 168.0 |
| B | 12 | 111 | 19854 | 113.75 | 868 | 850 | 167.1 |
| B | 15 | 222 | 19138 | 109.46 | 868 | 850 | 167.1 |
| B | 0 | 219 | 18993 | 108.6 | 868 | 850 | 167.1 |
| C | 14 | 238 | 134222 | 675.96 | 835 | 844 | 197.3 |
| C | 15 | 208 | 6156 | 26.92 | 835 | 844 | 197.3 |
| C | 14 | 225 | 5768 | 24.95 | 835 | 844 | 197.3 |
| D | 1 | 52 | 1548565 | 7840.98 | 821 | 801 | 197.4 |
| D | 12 | 233 | 107491 | 540.49 | 821 | 801 | 197.4 |
| D | 2 | 250 | 42138 | 209.41 | 821 | 801 | 197.4 |
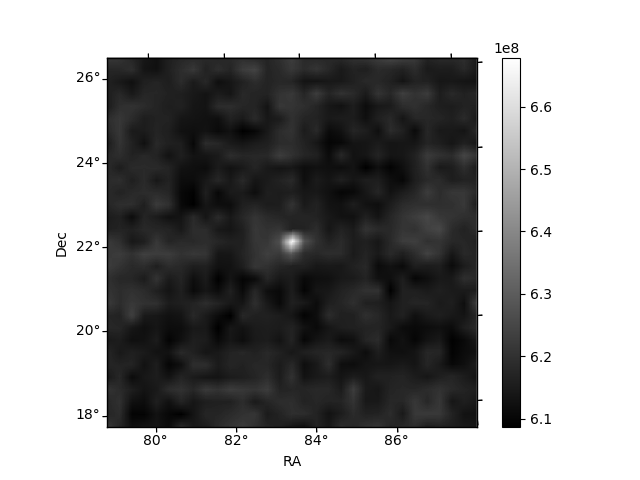
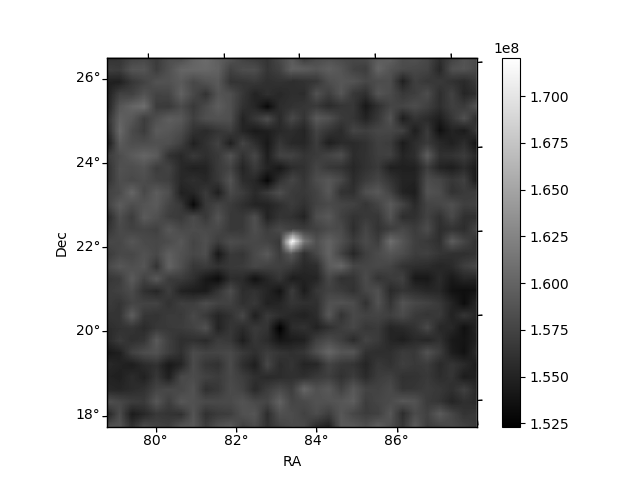
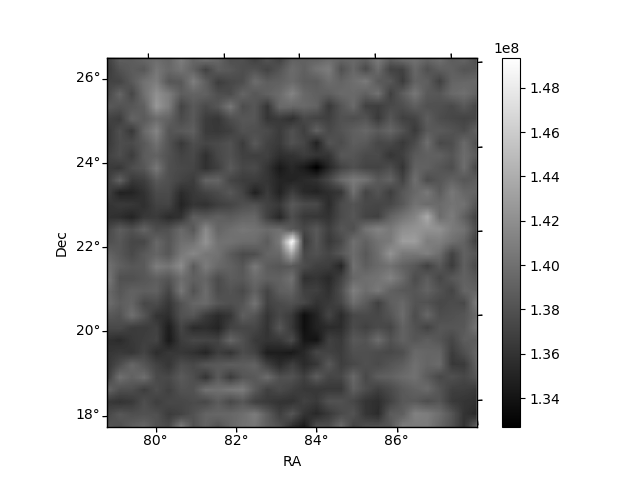
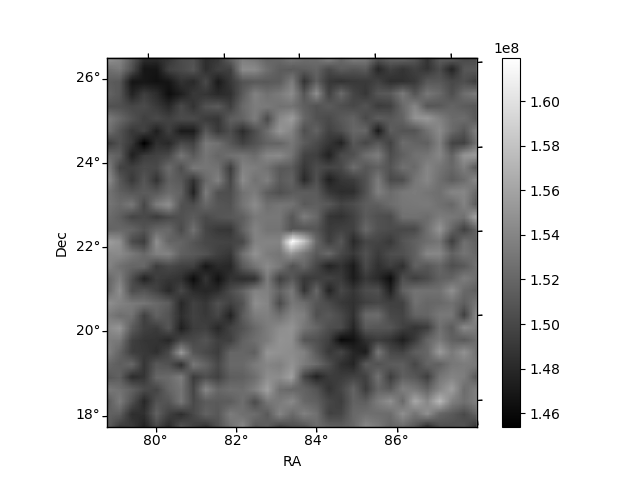
Histogram calculated using DETX and DETY for each event in the final _common_clean file
| Quadrant A | 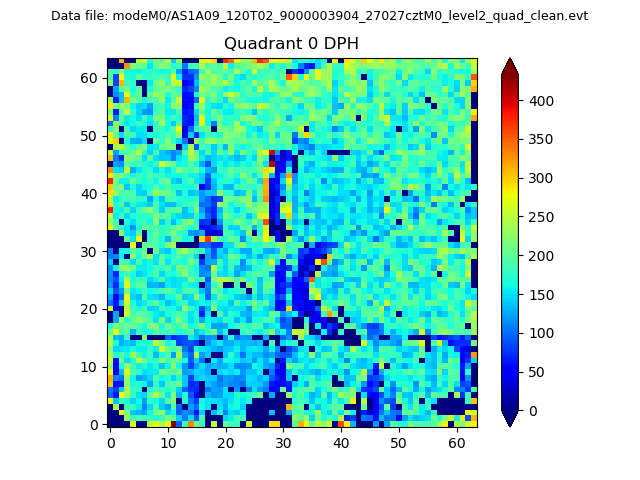 |
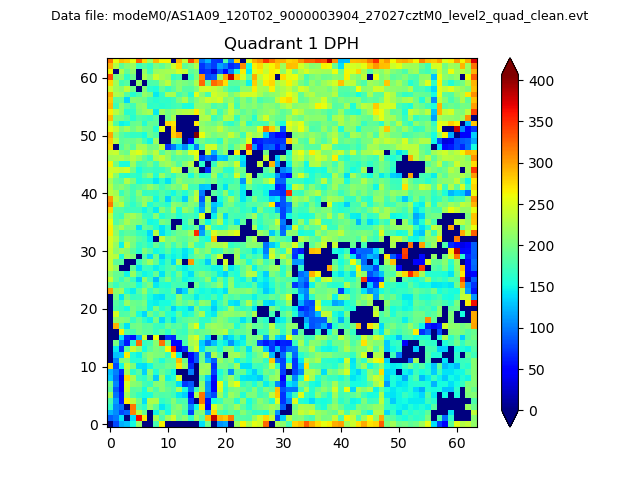 |
Quadrant B |
|---|---|---|---|
| Quadrant D | 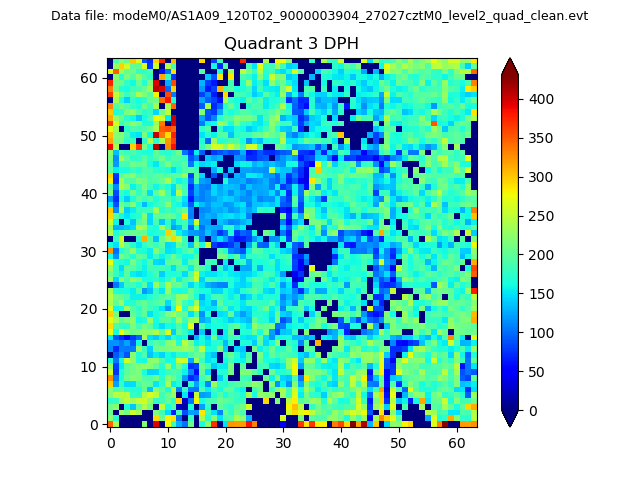 |
 |
Quadrant C |
| Plot type | Count rate plots | Images |
|---|---|---|
| Comparison with Poisson distribution Blue bars denote a histogram of data divided into 1 sec bins. Red curve is a Poisson curve with rate = median count rate of data. |
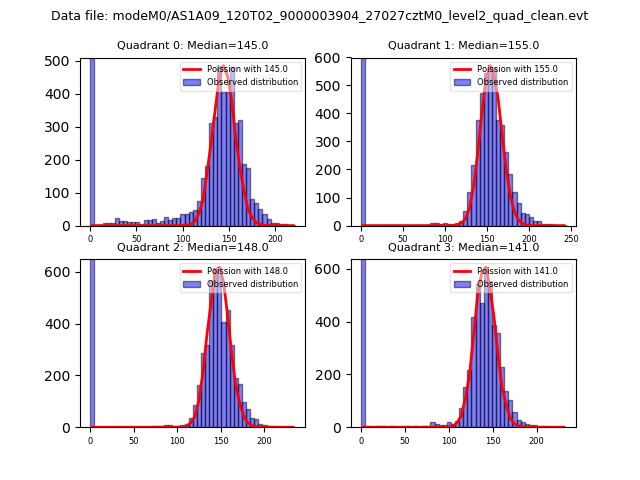 |
 |
| Quadrant-wise count rates Data is divided into 100 sec bins |
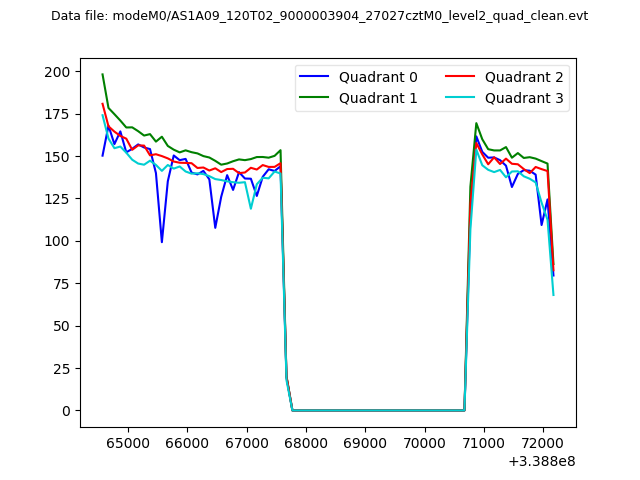 |
|
| Module-wise count rates for Quadrant A Data is divided into 100 sec bins |
 |
 |
| Module-wise count rates for Quadrant B Data is divided into 100 sec bins |
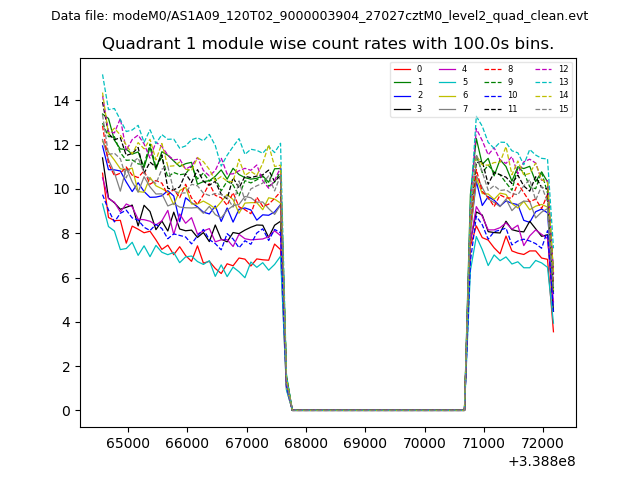 |
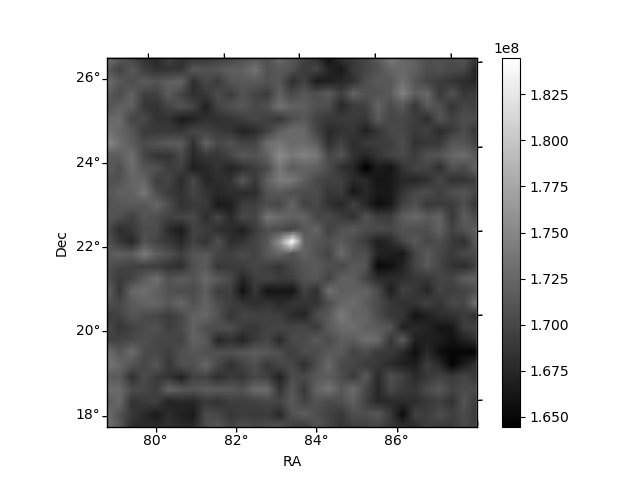 |
| Module-wise count rates for Quadrant C Data is divided into 100 sec bins |
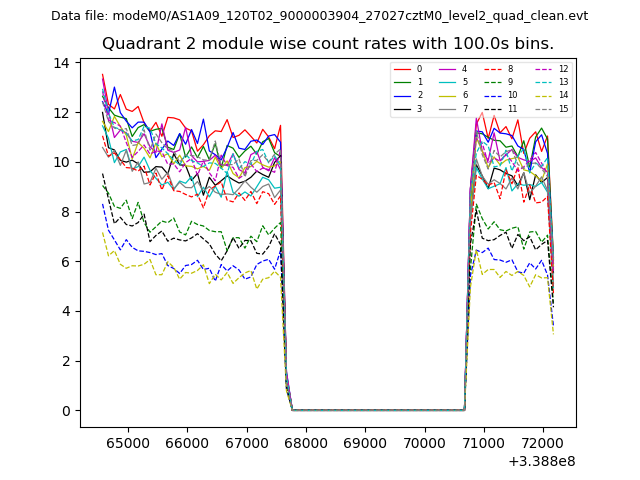 |
 |
| Module-wise count rates for Quadrant D Data is divided into 100 sec bins |
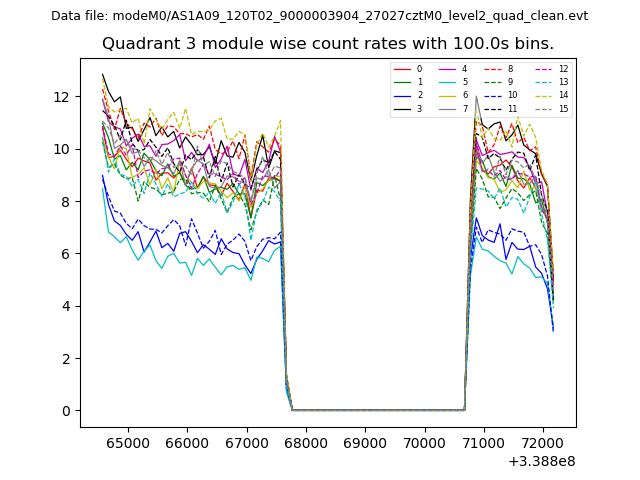 |
 |
| Parameter | Plot |
|---|---|
| CZT HV Monitor | 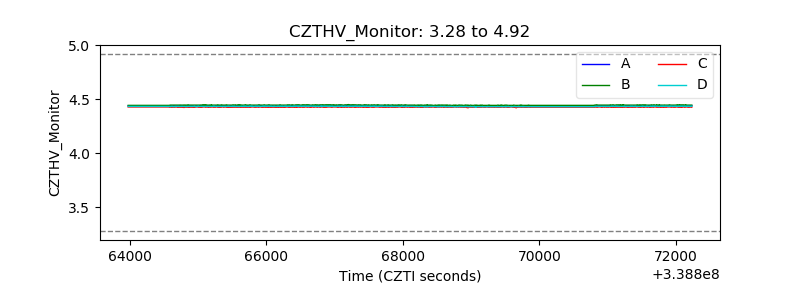 |
| D_VDD | 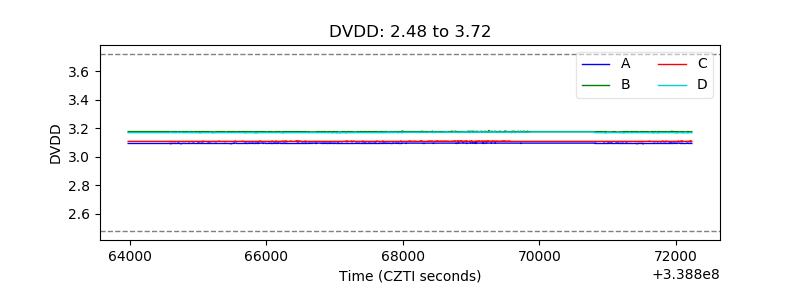 |
| Temperature 1 | 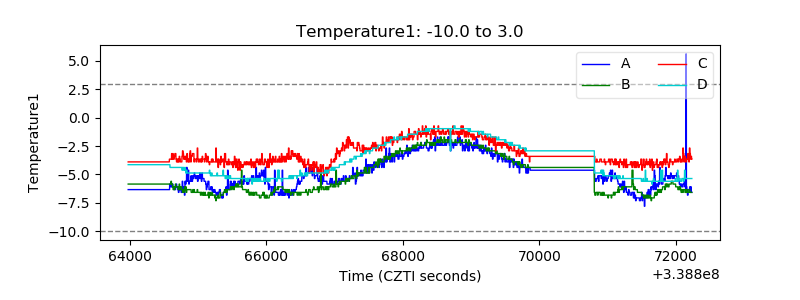 |
| Veto HV Monitor | 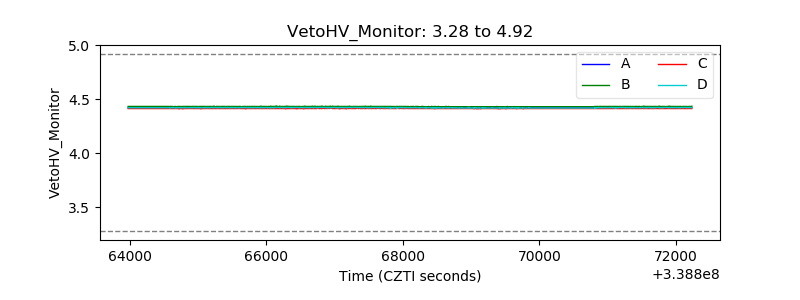 |
| Veto LLD | 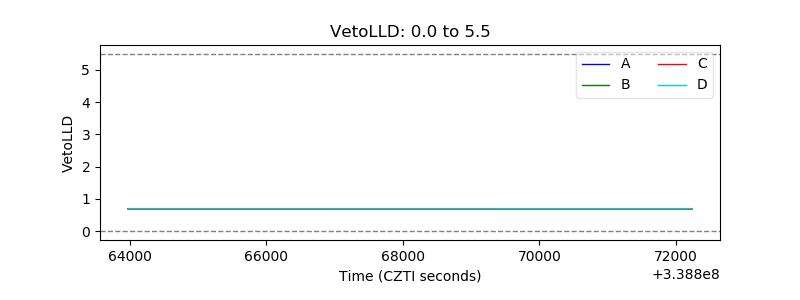 |
| Alpha Counter | 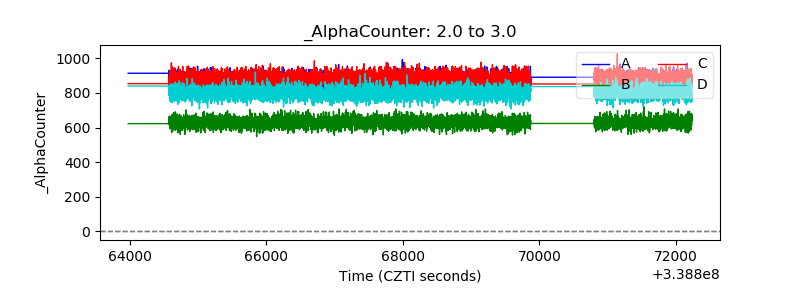 |
| _CPM_Rate | 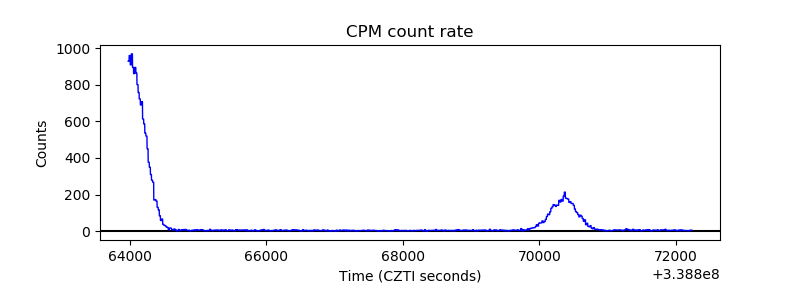 |
| CZT Counter | 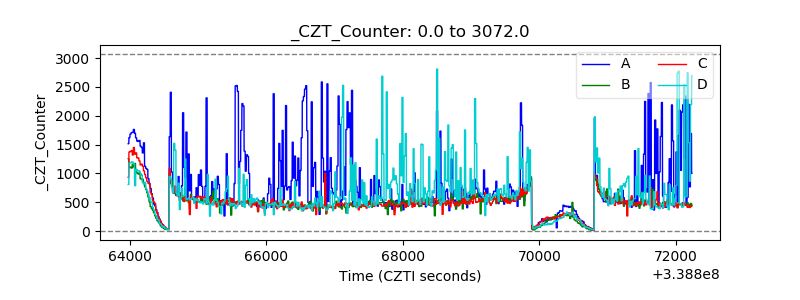 |
| +2.5 Volts monitor | 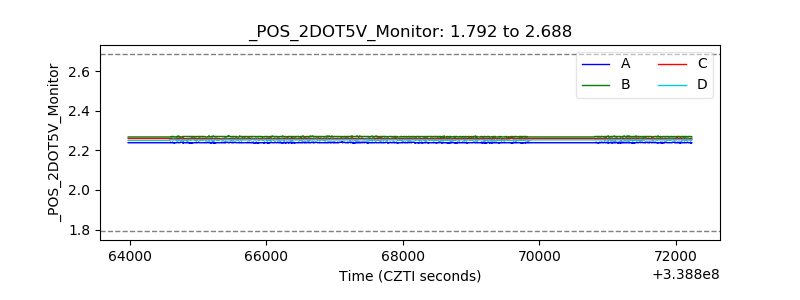 |
| +5 Volts monitor | 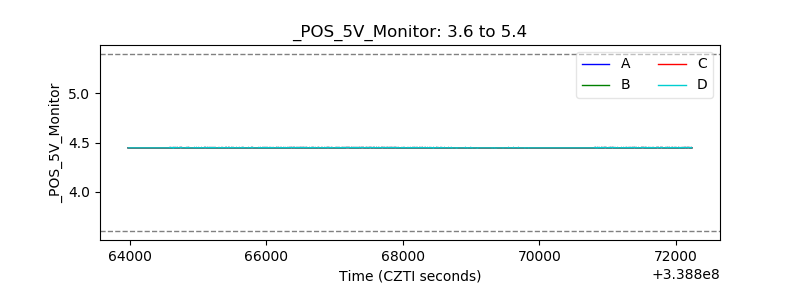 |
| _ROLL_ROT | 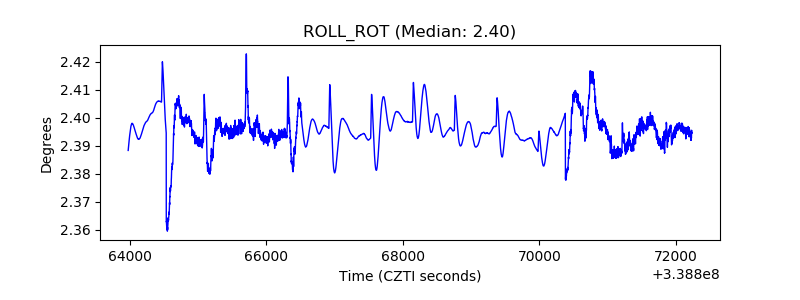 |
| _Roll_DEC | 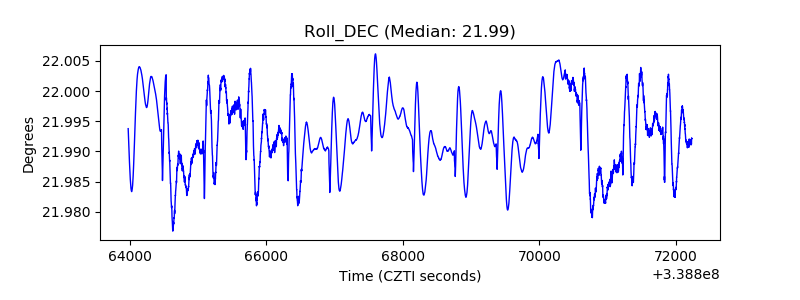 |
| _Roll_RA | 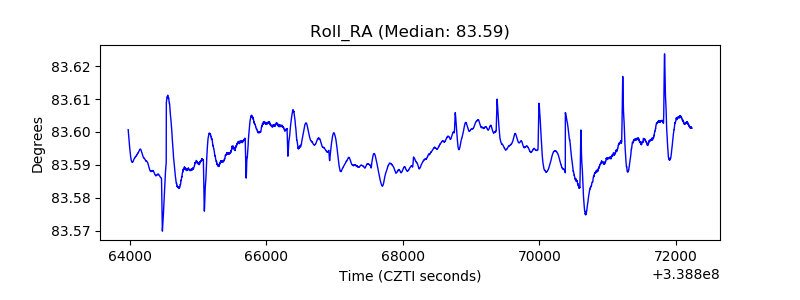 |
| Veto Counter | 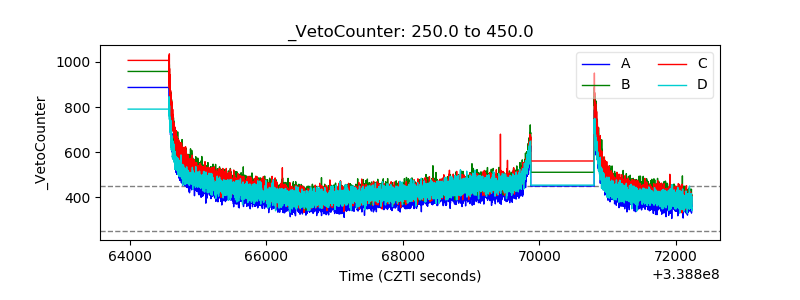 |