| Param | Original file | Final file |
|---|---|---|
| Filename | modeM0/AS1A09_120T02_9000003904_27028cztM0_level2.evt | modeM0/AS1A09_120T02_9000003904_27028cztM0_level2_quad_clean.evt |
| Size (bytes) | 671,374,080 | 114,707,520 |
| Size | 640.3 MB | 109.4 MB |
| Events in quadrant A | 5,517,547 | 726,165 |
| Events in quadrant B | 3,804,276 | 778,509 |
| Events in quadrant C | 3,705,512 | 748,387 |
| Events in quadrant D | 6,798,966 | 700,216 |
| Mode M9 | |||
|---|---|---|---|
| Quadrant | BADHDUFLAG | Total packets | Discarded packets |
| A | 0 | 5 | 0 |
| B | 0 | 5 | 0 |
| C | 0 | 5 | 0 |
| D | 0 | 5 | 0 |
| Mode M0 | |||
|---|---|---|---|
| Quadrant | BADHDUFLAG | Total packets | Discarded packets |
| A | 0 | 21260 | 0 |
| B | 0 | 15891 | 0 |
| C | 0 | 15660 | 0 |
| D | 0 | 25376 | 0 |
| Quadrant | Total seconds | Saturated seconds | Saturation percentage |
|---|---|---|---|
| A | 7478 | 598 | 7.996791% |
| B | 7479 | 78 | 1.042920% |
| C | 7479 | 90 | 1.203369% |
| D | 7479 | 1035 | 13.838748% |
Noise dominated data is calculated using 1-second bins in cleaned event files. If a bin has >2000 counts, and if more than 50% of those come from <1% of pixels, then it is considered to be noise-dominated and hence unusable.
| Quadrant | # 1 sec bins | Bins with >0 counts | Bins with >2000 counts | High rate bins dominated by noise | Noise dominated (total time) | Noise dominated (detector-on time) | Marked lightcurve |
|---|---|---|---|---|---|---|---|
| A | 7973 | 7478 | 410 | 410 | 5.14% | 5.48% | 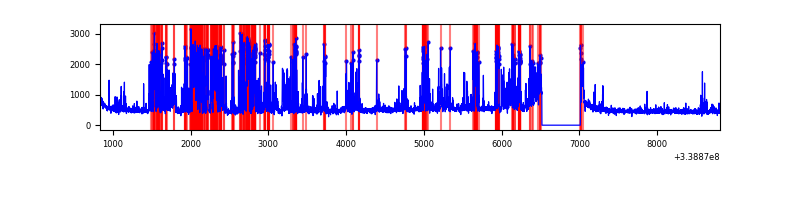 |
| B | 7974 | 7479 | 7 | 7 | 0.09% | 0.09% | 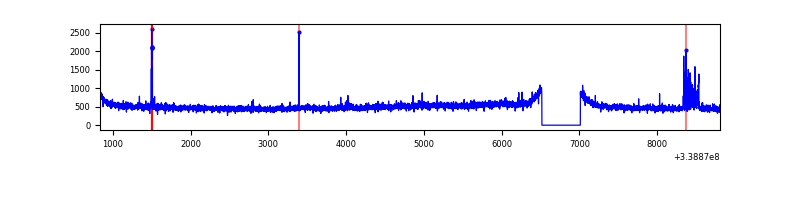 |
| C | 7974 | 7480 | 6 | 6 | 0.08% | 0.08% | 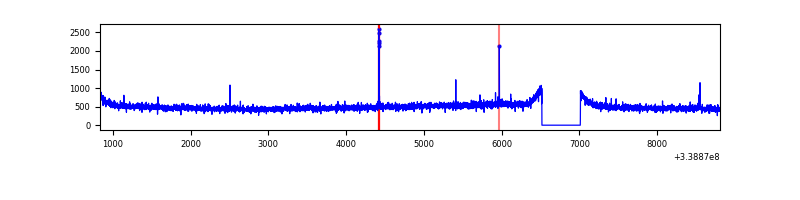 |
| D | 7974 | 7480 | 1009 | 1009 | 12.65% | 13.49% | 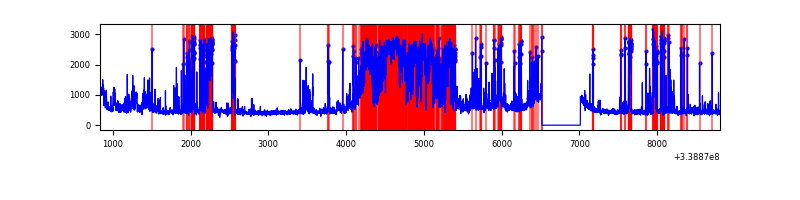 |
Top three noisy pixels from each quadrant. If the there are fewer than three noisy pixels in the level2.evt file, extra rows are filled as -1
| Pixel properties | Quadrant properties | ||||||
|---|---|---|---|---|---|---|---|
| Quadrant | DetID | PixID | Counts | Sigma | Mean | Median | Sigma |
| A | 14 | 235 | 1965329 | 10650.29 | 910 | 894 | 184.4 |
| A | 13 | 170 | 17733 | 91.29 | 910 | 894 | 184.4 |
| A | 8 | 192 | 13115 | 66.26 | 910 | 894 | 184.4 |
| B | 10 | 246 | 61036 | 329.91 | 943 | 922 | 182.2 |
| B | 0 | 219 | 24780 | 130.93 | 943 | 922 | 182.2 |
| B | 15 | 222 | 21970 | 115.51 | 943 | 922 | 182.2 |
| C | 14 | 238 | 145152 | 668.46 | 909 | 915 | 215.8 |
| C | 15 | 208 | 23673 | 105.47 | 909 | 915 | 215.8 |
| C | 13 | 61 | 6332 | 25.1 | 909 | 915 | 215.8 |
| D | 1 | 52 | 1728624 | 8434.64 | 851 | 831 | 204.8 |
| D | 12 | 233 | 1637396 | 7989.29 | 851 | 831 | 204.8 |
| D | 2 | 250 | 190173 | 924.32 | 851 | 831 | 204.8 |
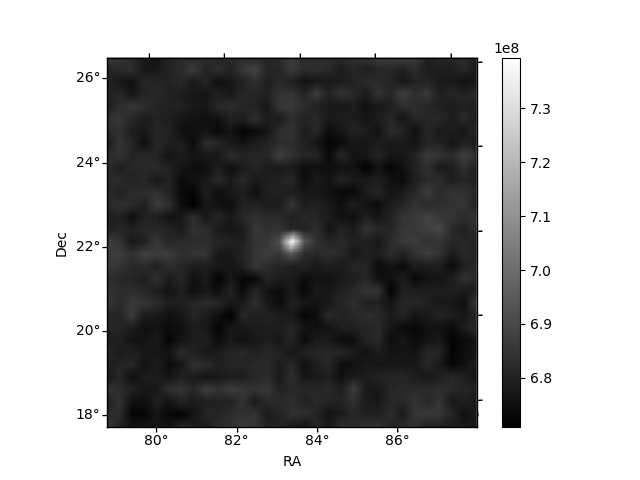
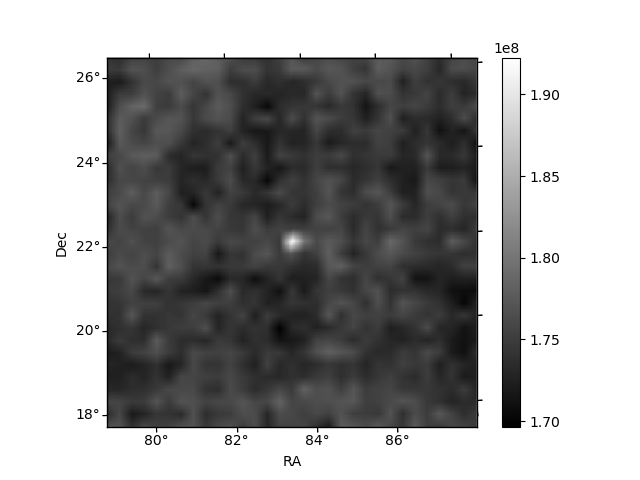
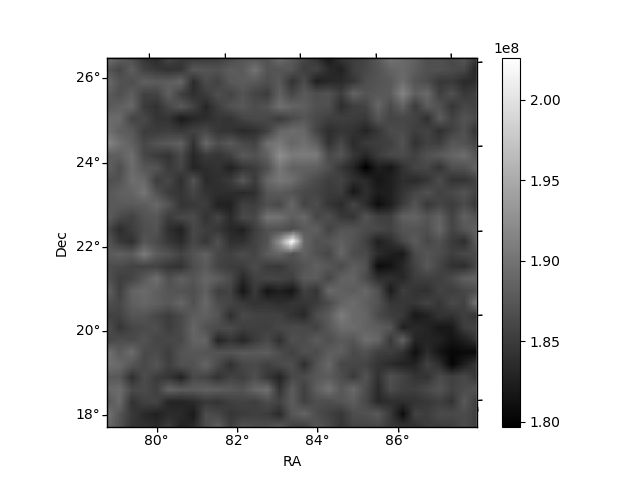
Histogram calculated using DETX and DETY for each event in the final _common_clean file
| Quadrant A |  |
 |
Quadrant B |
|---|---|---|---|
| Quadrant D |  |
 |
Quadrant C |
| Plot type | Count rate plots | Images |
|---|---|---|
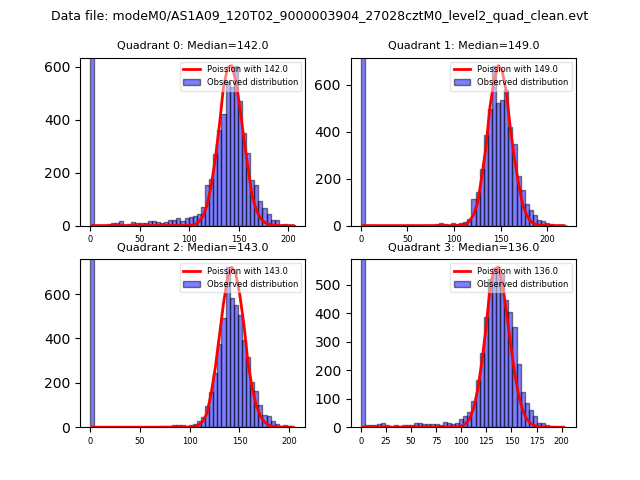
| Comparison with Poisson distribution Blue bars denote a histogram of data divided into 1 sec bins. Red curve is a Poisson curve with rate = median count rate of data. |
 |
 |
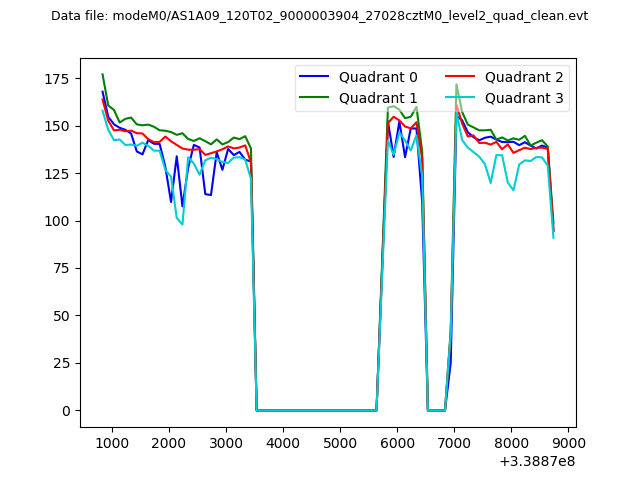
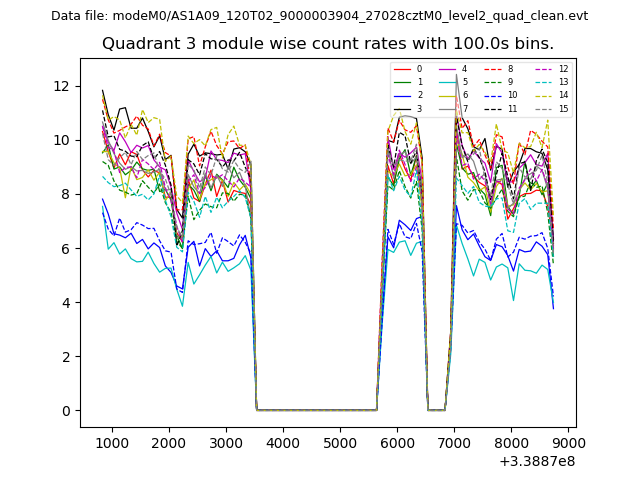
| Quadrant-wise count rates Data is divided into 100 sec bins |
 |
|
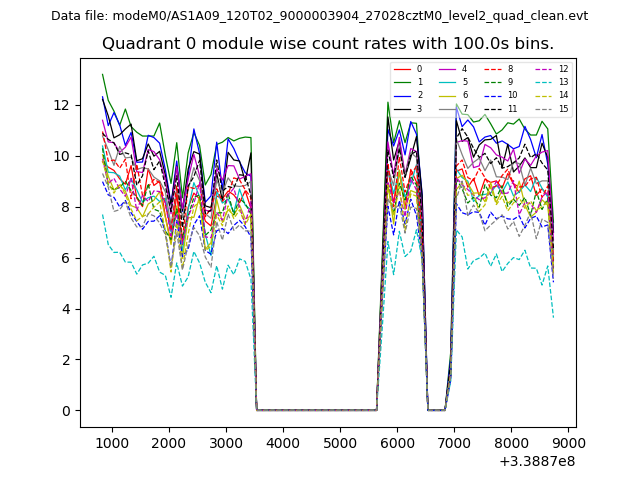
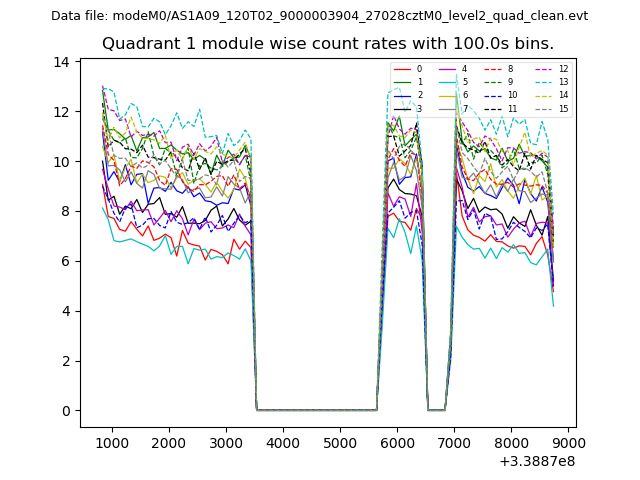
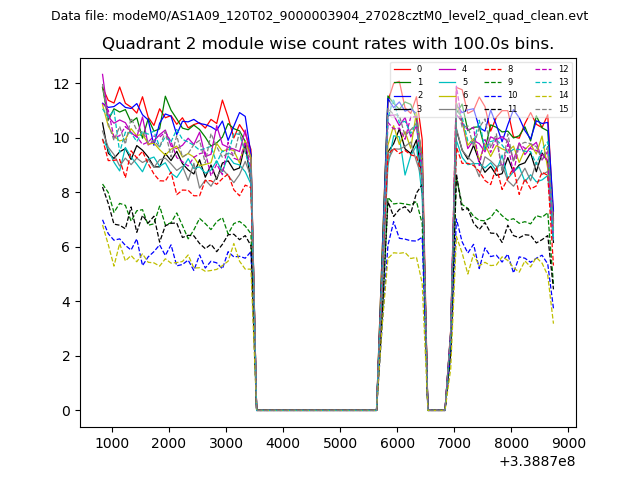
| Module-wise count rates for Quadrant A Data is divided into 100 sec bins |
 |
 |
| Module-wise count rates for Quadrant B Data is divided into 100 sec bins |
 |
 |
| Module-wise count rates for Quadrant C Data is divided into 100 sec bins |
 |
 |
| Module-wise count rates for Quadrant D Data is divided into 100 sec bins |
 |
 |
| Parameter | Plot |
|---|---|
| CZT HV Monitor | 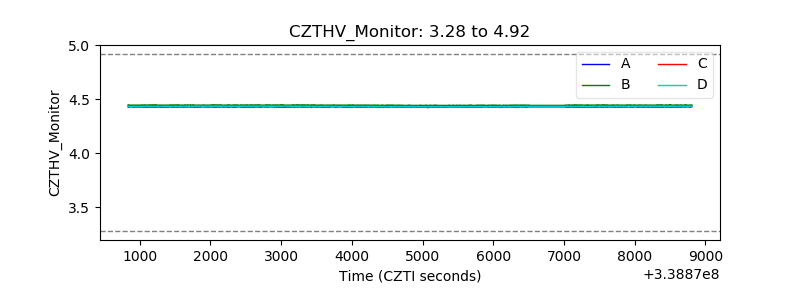 |
| D_VDD | 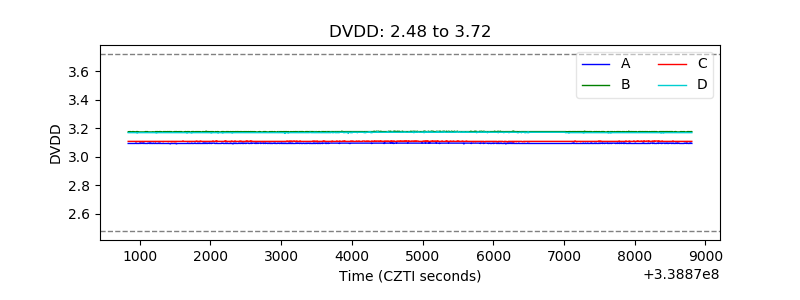 |
| Temperature 1 | 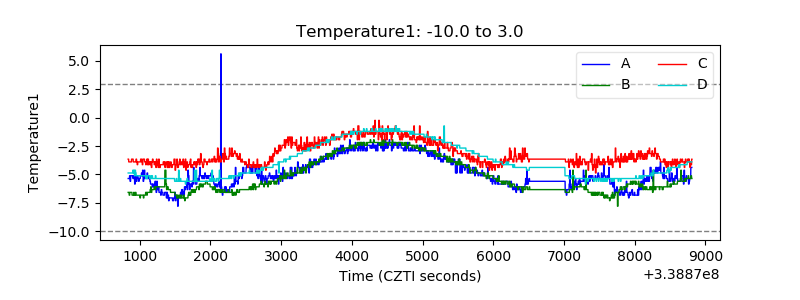 |
| Veto HV Monitor | 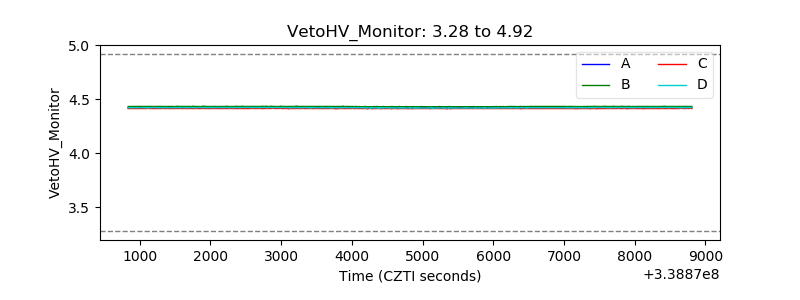 |
| Veto LLD | 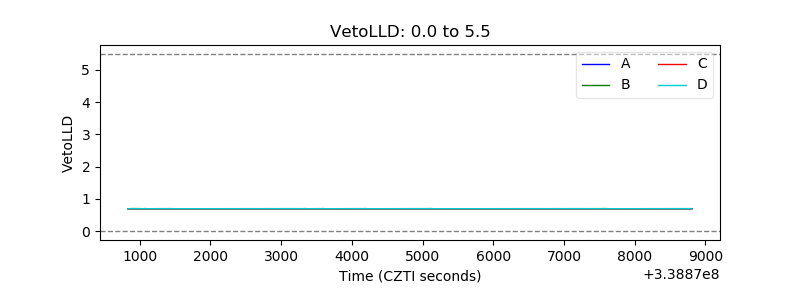 |
| Alpha Counter | 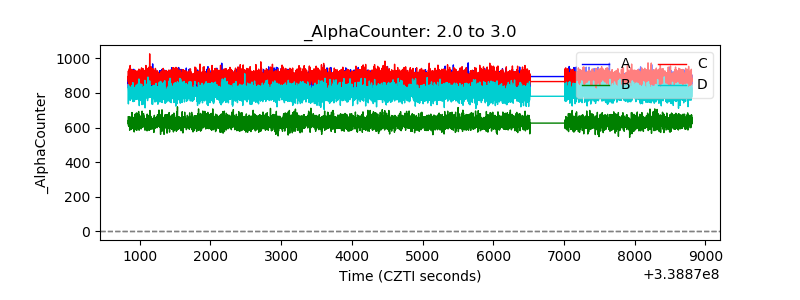 |
| _CPM_Rate | 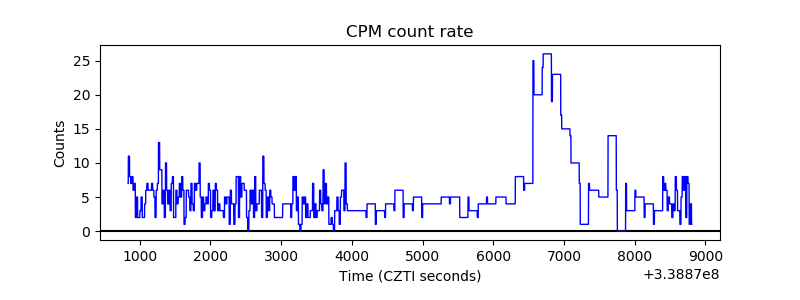 |
| CZT Counter |  |
| +2.5 Volts monitor |  |
| +5 Volts monitor |  |
| _ROLL_ROT | 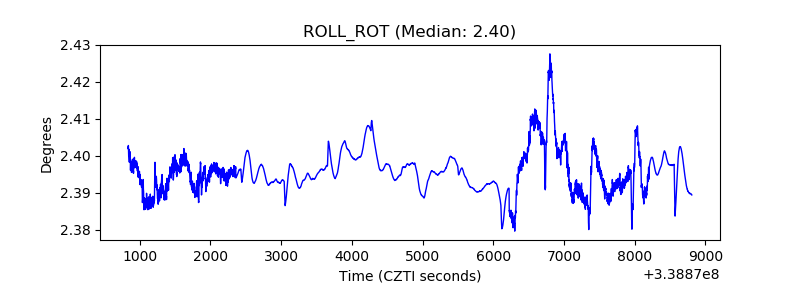 |
| _Roll_DEC | 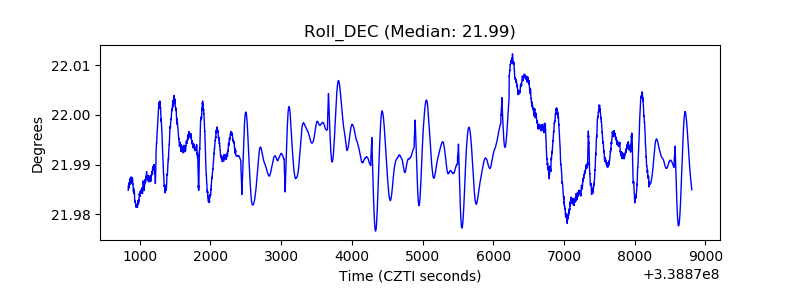 |
| _Roll_RA | 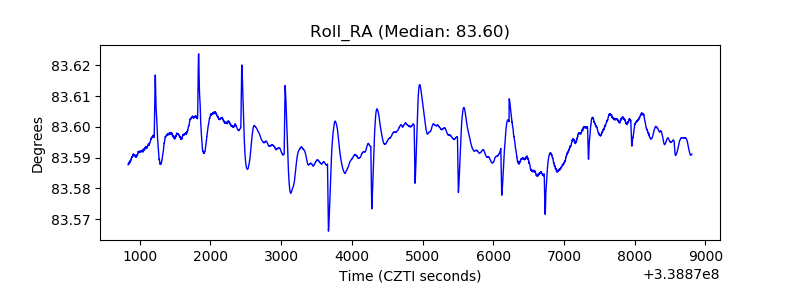 |
| Veto Counter | 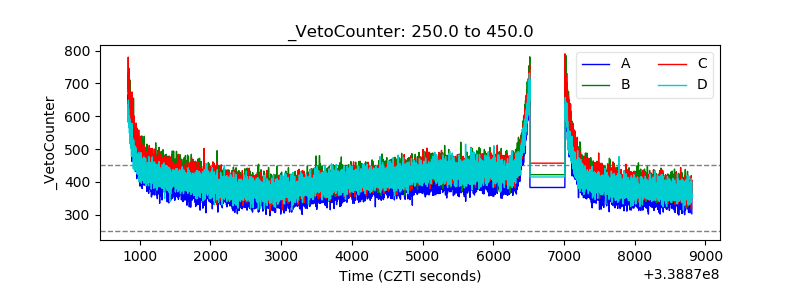 |