| Param | Original file | Final file |
|---|---|---|
| Filename | modeM0/AS1A09_120T02_9000003904_27029cztM0_level2.evt | modeM0/AS1A09_120T02_9000003904_27029cztM0_level2_quad_clean.evt |
| Size (bytes) | 620,472,960 | 112,268,160 |
| Size | 591.7 MB | 107.1 MB |
| Events in quadrant A | 5,613,492 | 701,181 |
| Events in quadrant B | 3,880,311 | 761,031 |
| Events in quadrant C | 3,648,837 | 733,186 |
| Events in quadrant D | 5,143,904 | 686,246 |
| Mode M9 | |||
|---|---|---|---|
| Quadrant | BADHDUFLAG | Total packets | Discarded packets |
| A | 0 | 1 | 0 |
| B | 0 | 1 | 0 |
| C | 0 | 1 | 0 |
| D | 0 | 1 | 0 |
| Mode M0 | |||
|---|---|---|---|
| Quadrant | BADHDUFLAG | Total packets | Discarded packets |
| A | 0 | 21589 | 0 |
| B | 0 | 16077 | 0 |
| C | 0 | 15436 | 0 |
| D | 0 | 20251 | 0 |
| Quadrant | Total seconds | Saturated seconds | Saturation percentage |
|---|---|---|---|
| A | 7435 | 842 | 11.324815% |
| B | 7436 | 182 | 2.447552% |
| C | 7436 | 166 | 2.232383% |
| D | 7436 | 484 | 6.508876% |
Noise dominated data is calculated using 1-second bins in cleaned event files. If a bin has >2000 counts, and if more than 50% of those come from <1% of pixels, then it is considered to be noise-dominated and hence unusable.
| Quadrant | # 1 sec bins | Bins with >0 counts | Bins with >2000 counts | High rate bins dominated by noise | Noise dominated (total time) | Noise dominated (detector-on time) | Marked lightcurve |
|---|---|---|---|---|---|---|---|
| A | 7590 | 7435 | 443 | 443 | 5.84% | 5.96% | 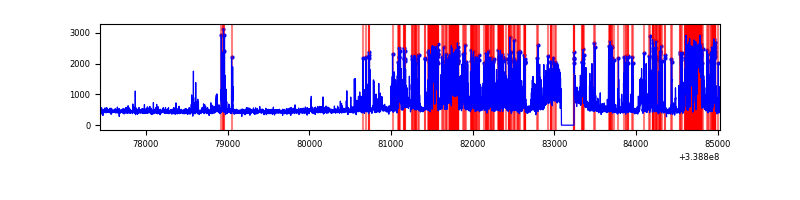 |
| B | 7591 | 7436 | 1 | 1 | 0.01% | 0.01% | 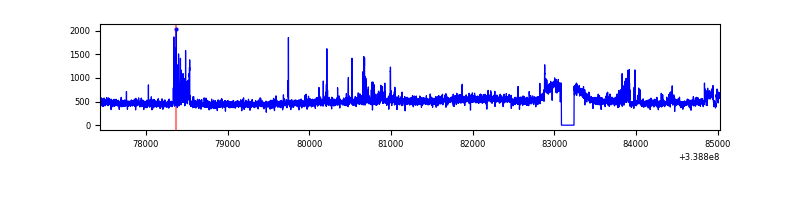 |
| C | 7591 | 7436 | 0 | 0 | 0.00% | 0.00% | 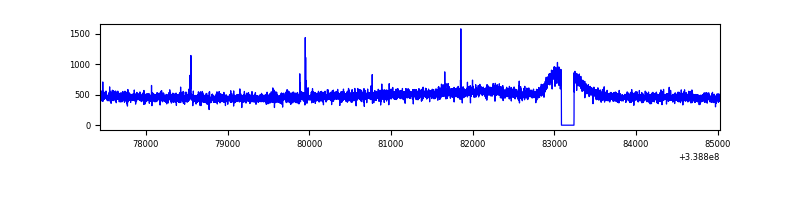 |
| D | 7591 | 7436 | 337 | 337 | 4.44% | 4.53% | 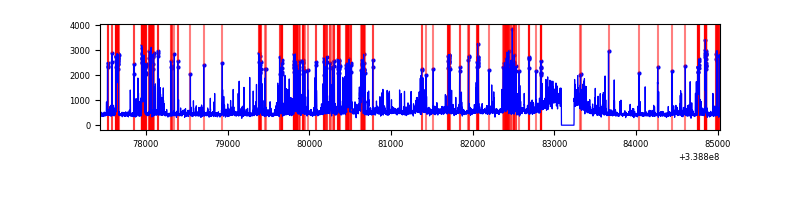 |
Top three noisy pixels from each quadrant. If the there are fewer than three noisy pixels in the level2.evt file, extra rows are filled as -1
| Pixel properties | Quadrant properties | ||||||
|---|---|---|---|---|---|---|---|
| Quadrant | DetID | PixID | Counts | Sigma | Mean | Median | Sigma |
| A | 14 | 235 | 2083657 | 11456.51 | 891 | 874 | 181.8 |
| A | 0 | 13 | 30507 | 163.0 | 891 | 874 | 181.8 |
| A | 13 | 170 | 25660 | 136.34 | 891 | 874 | 181.8 |
| B | 3 | 64 | 106423 | 584.63 | 926 | 903 | 180.5 |
| B | 10 | 246 | 79940 | 437.9 | 926 | 903 | 180.5 |
| B | 10 | 245 | 44783 | 243.11 | 926 | 903 | 180.5 |
| C | 14 | 238 | 142061 | 666.24 | 897 | 903 | 211.9 |
| C | 15 | 208 | 14626 | 64.77 | 897 | 903 | 211.9 |
| C | 13 | 61 | 6141 | 24.72 | 897 | 903 | 211.9 |
| D | 1 | 52 | 1403516 | 6629.17 | 883 | 861 | 211.6 |
| D | 12 | 233 | 281043 | 1324.18 | 883 | 861 | 211.6 |
| D | 2 | 250 | 98848 | 463.1 | 883 | 861 | 211.6 |
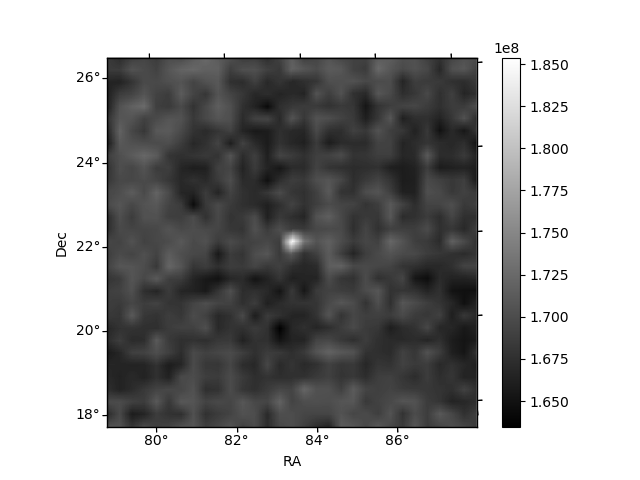
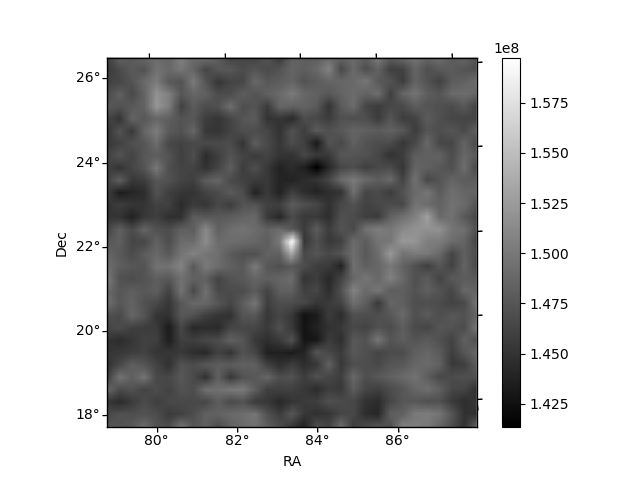
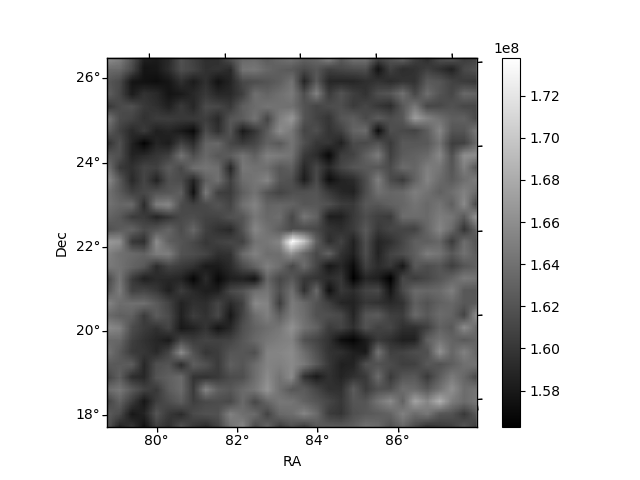
Histogram calculated using DETX and DETY for each event in the final _common_clean file
| Quadrant A |  |
 |
Quadrant B |
|---|---|---|---|
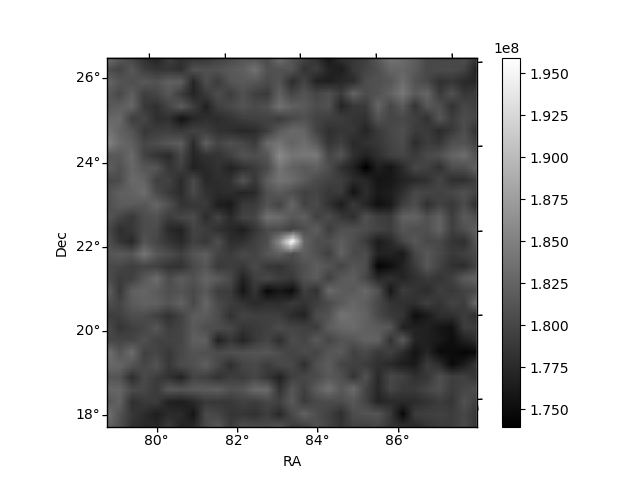
| Quadrant D |  |
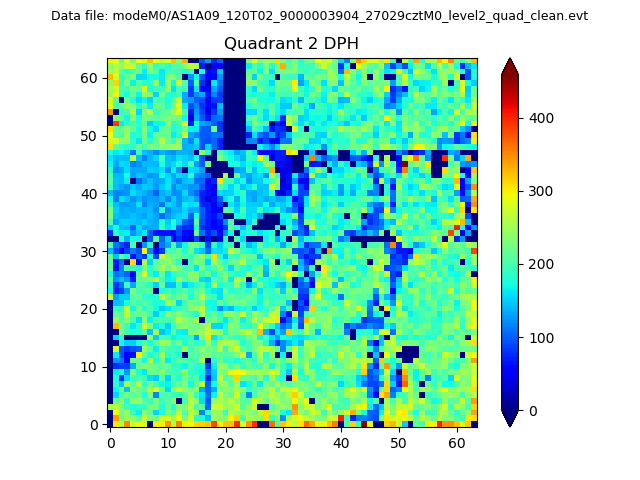 |
Quadrant C |
| Plot type | Count rate plots | Images |
|---|---|---|
| Comparison with Poisson distribution Blue bars denote a histogram of data divided into 1 sec bins. Red curve is a Poisson curve with rate = median count rate of data. |
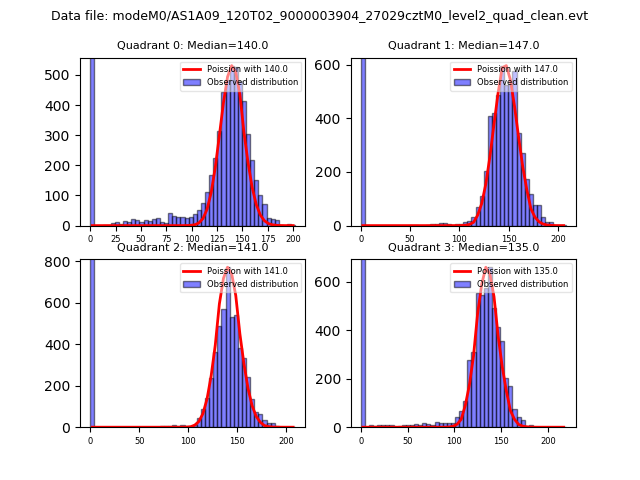 |
 |
| Quadrant-wise count rates Data is divided into 100 sec bins |
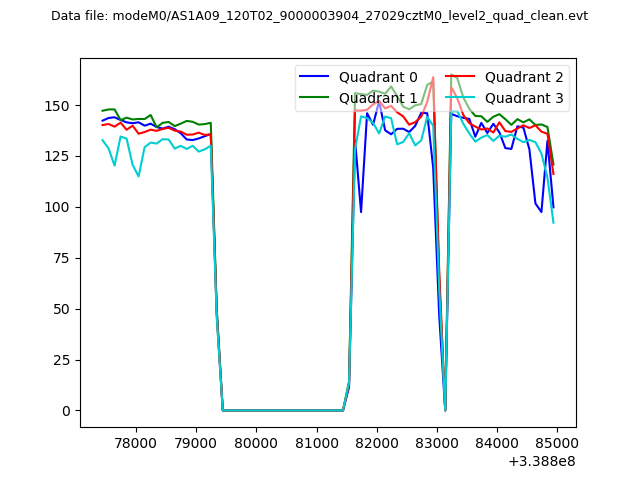 |
|
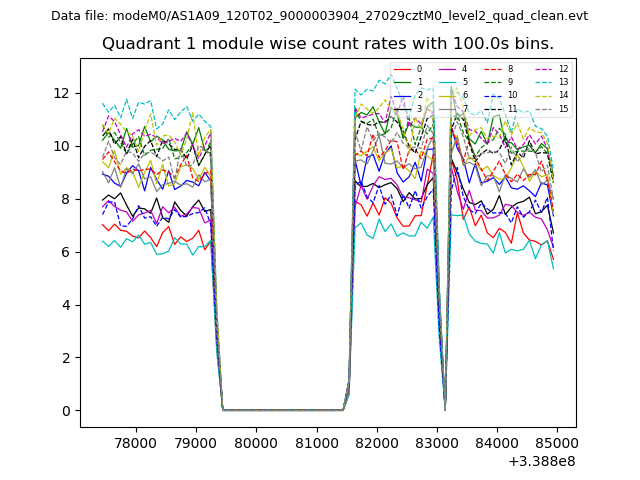
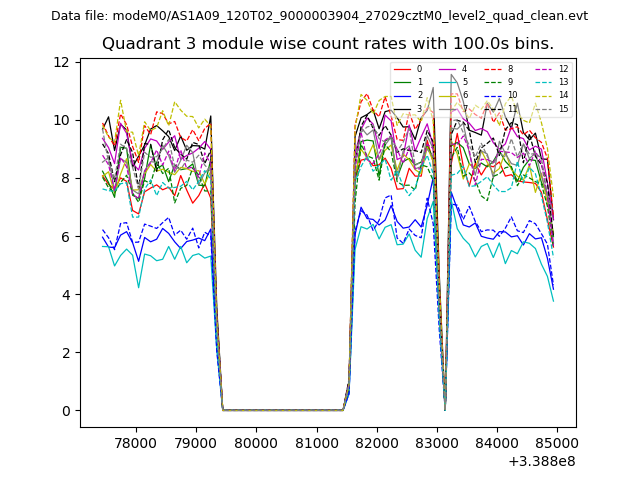
| Module-wise count rates for Quadrant A Data is divided into 100 sec bins |
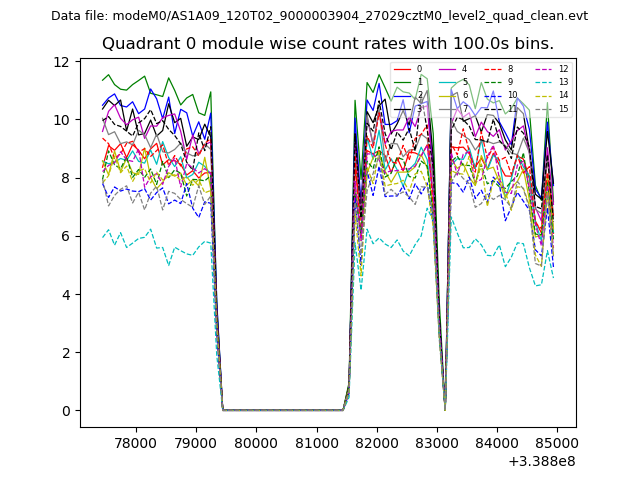 |
 |
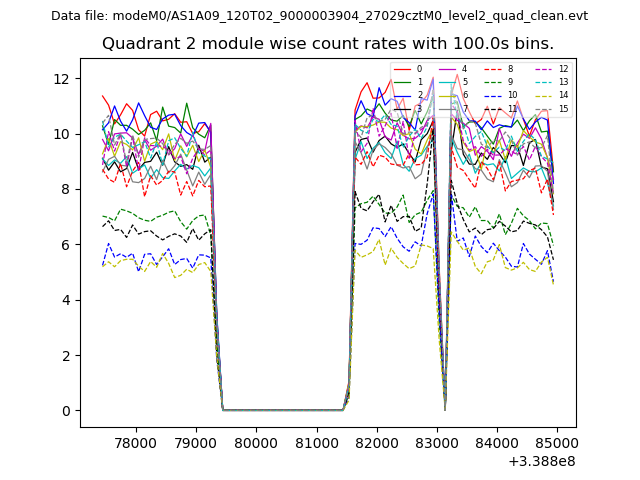
| Module-wise count rates for Quadrant B Data is divided into 100 sec bins |
 |
 |
| Module-wise count rates for Quadrant C Data is divided into 100 sec bins |
 |
 |
| Module-wise count rates for Quadrant D Data is divided into 100 sec bins |
 |
 |
| Parameter | Plot |
|---|---|
| CZT HV Monitor |  |
| D_VDD | 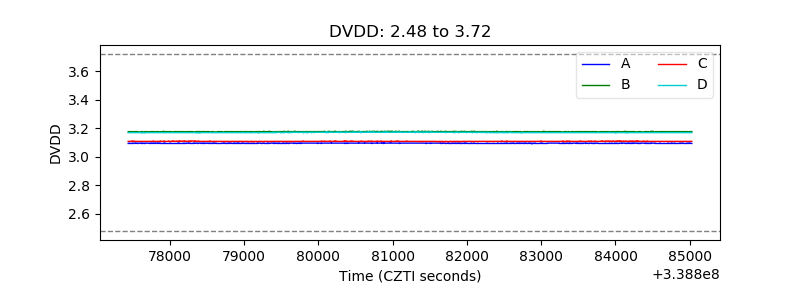 |
| Temperature 1 | 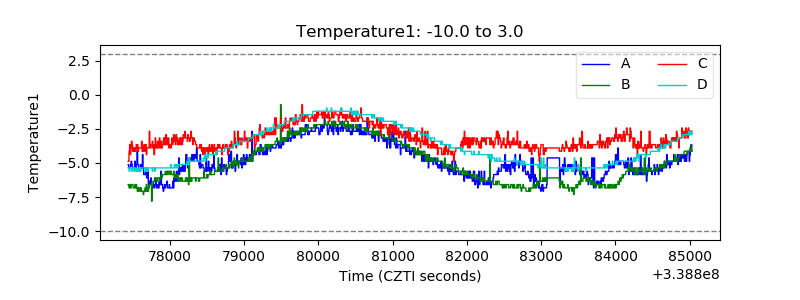 |
| Veto HV Monitor | 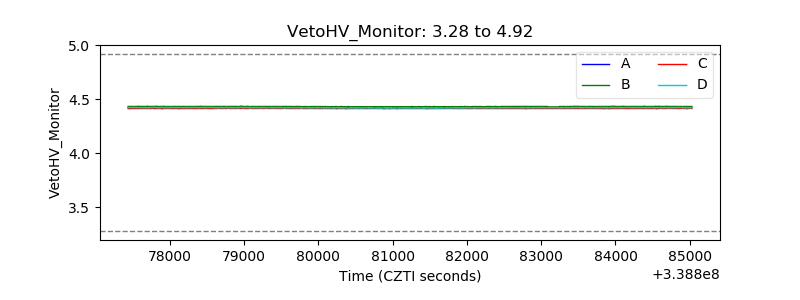 |
| Veto LLD | 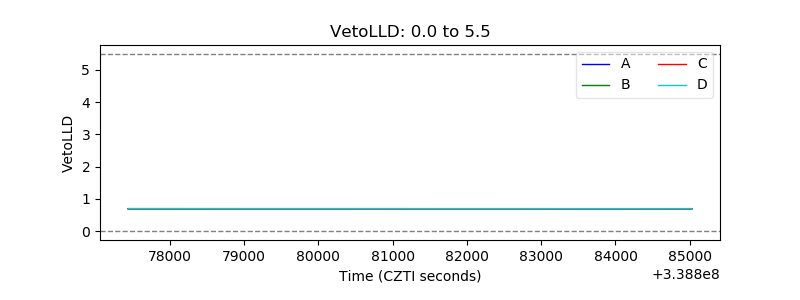 |
| Alpha Counter | 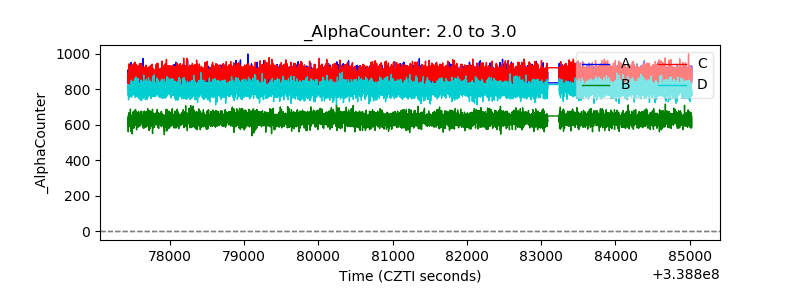 |
| _CPM_Rate | 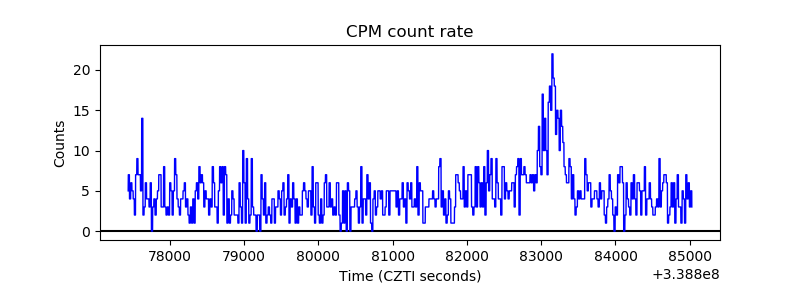 |
| CZT Counter | 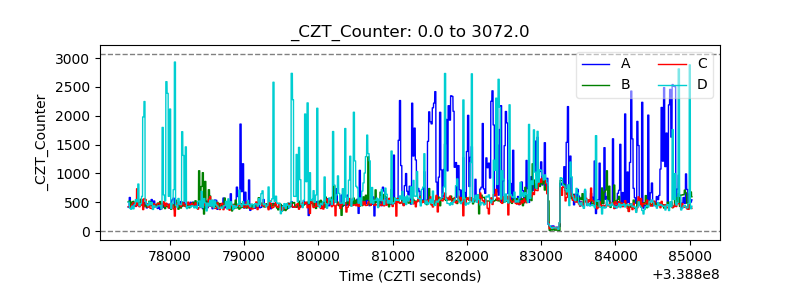 |
| +2.5 Volts monitor |  |
| +5 Volts monitor | 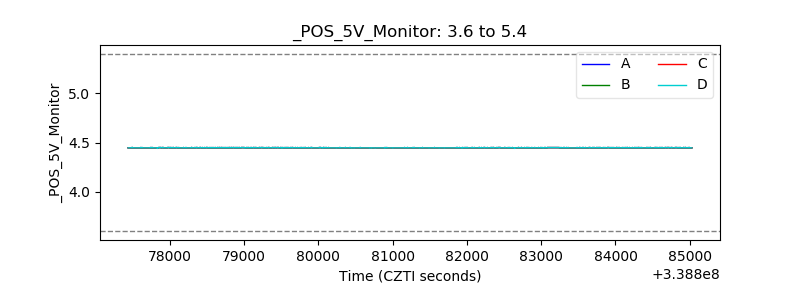 |
| _ROLL_ROT | 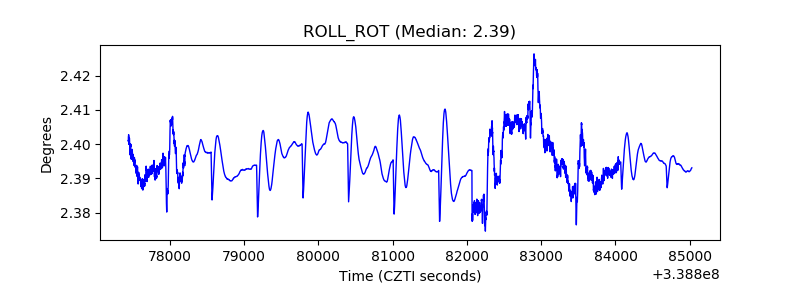 |
| _Roll_DEC | 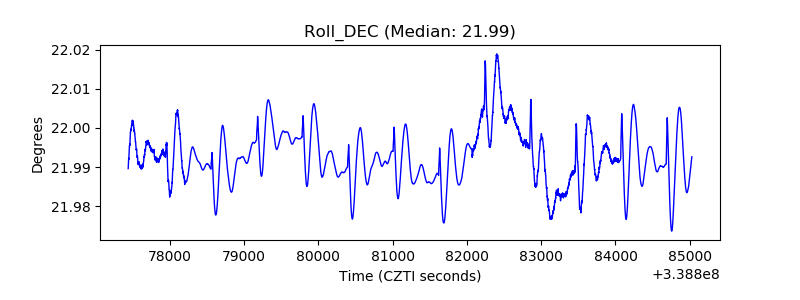 |
| _Roll_RA | 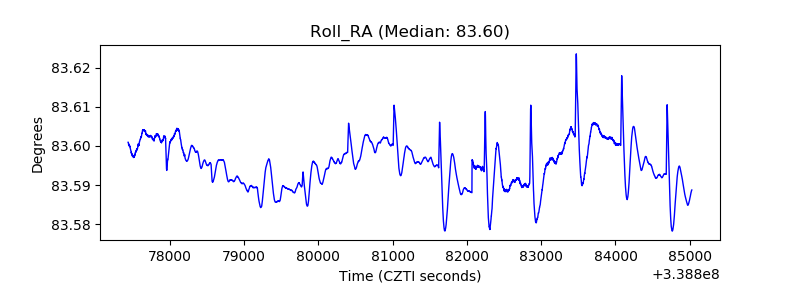 |
| Veto Counter | 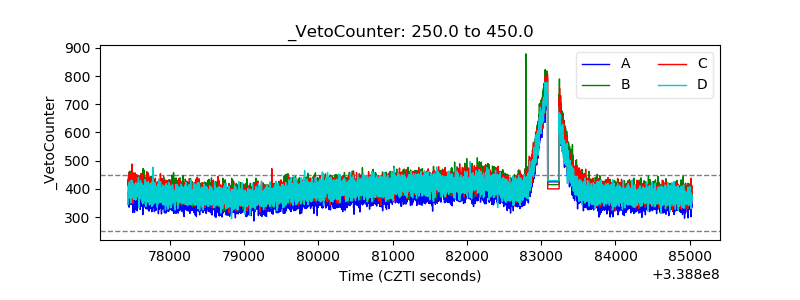 |