| Param | Original file | Final file |
|---|---|---|
| Filename | modeM0/AS1A09_120T02_9000003904_27030cztM0_level2.evt | modeM0/AS1A09_120T02_9000003904_27030cztM0_level2_quad_clean.evt |
| Size (bytes) | 643,020,480 | 94,475,520 |
| Size | 613.2 MB | 90.1 MB |
| Events in quadrant A | 8,093,509 | 514,278 |
| Events in quadrant B | 3,440,756 | 648,250 |
| Events in quadrant C | 3,283,977 | 623,870 |
| Events in quadrant D | 4,195,008 | 600,035 |
| Mode M9 | |||
|---|---|---|---|
| Quadrant | BADHDUFLAG | Total packets | Discarded packets |
| A | 0 | 4 | 0 |
| B | 0 | 4 | 0 |
| C | 0 | 4 | 0 |
| D | 0 | 4 | 0 |
| Mode M0 | |||
|---|---|---|---|
| Quadrant | BADHDUFLAG | Total packets | Discarded packets |
| A | 0 | 28544 | 0 |
| B | 0 | 14308 | 0 |
| C | 0 | 13911 | 0 |
| D | 0 | 16965 | 0 |
| Quadrant | Total seconds | Saturated seconds | Saturation percentage |
|---|---|---|---|
| A | 6800 | 1897 | 27.897059% |
| B | 6801 | 73 | 1.073372% |
| C | 6801 | 90 | 1.323335% |
| D | 6801 | 203 | 2.984855% |
Noise dominated data is calculated using 1-second bins in cleaned event files. If a bin has >2000 counts, and if more than 50% of those come from <1% of pixels, then it is considered to be noise-dominated and hence unusable.
| Quadrant | # 1 sec bins | Bins with >0 counts | Bins with >2000 counts | High rate bins dominated by noise | Noise dominated (total time) | Noise dominated (detector-on time) | Marked lightcurve |
|---|---|---|---|---|---|---|---|
| A | 7130 | 6800 | 1557 | 1557 | 21.84% | 22.90% | 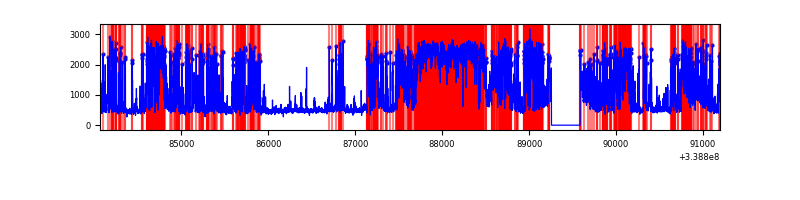 |
| B | 7131 | 6801 | 0 | 0 | 0.00% | 0.00% | 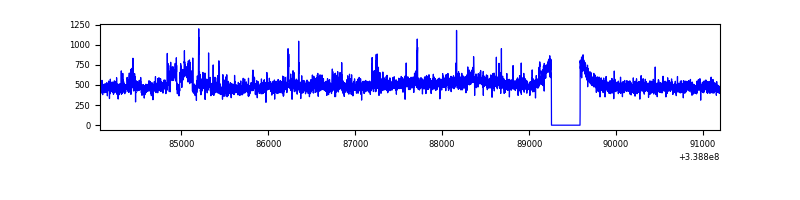 |
| C | 7131 | 6802 | 0 | 0 | 0.00% | 0.00% | 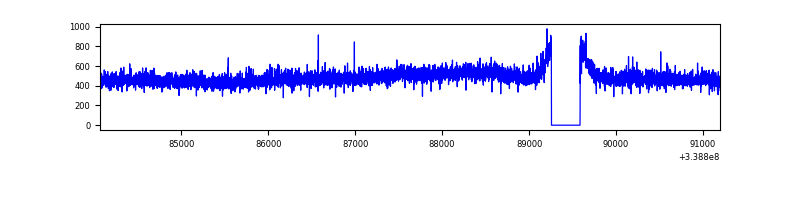 |
| D | 7131 | 6802 | 179 | 179 | 2.51% | 2.63% | 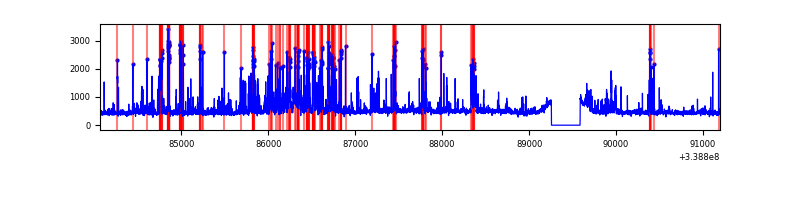 |
Top three noisy pixels from each quadrant. If the there are fewer than three noisy pixels in the level2.evt file, extra rows are filled as -1
| Pixel properties | Quadrant properties | ||||||
|---|---|---|---|---|---|---|---|
| Quadrant | DetID | PixID | Counts | Sigma | Mean | Median | Sigma |
| A | 14 | 235 | 5134747 | 34010.9 | 745 | 733 | 151.0 |
| A | 6 | 16 | 62038 | 406.12 | 745 | 733 | 151.0 |
| A | 0 | 13 | 14392 | 90.49 | 745 | 733 | 151.0 |
| B | 3 | 64 | 89040 | 544.3 | 837 | 817 | 162.1 |
| B | 3 | 112 | 25521 | 152.41 | 837 | 817 | 162.1 |
| B | 10 | 245 | 22909 | 136.3 | 837 | 817 | 162.1 |
| C | 14 | 238 | 130647 | 680.91 | 807 | 816 | 190.7 |
| C | 14 | 225 | 5563 | 24.9 | 807 | 816 | 190.7 |
| C | 13 | 61 | 5434 | 24.22 | 807 | 816 | 190.7 |
| D | 1 | 52 | 797053 | 4107.68 | 806 | 786 | 193.8 |
| D | 12 | 233 | 169467 | 870.17 | 806 | 786 | 193.8 |
| D | 2 | 250 | 103739 | 531.1 | 806 | 786 | 193.8 |
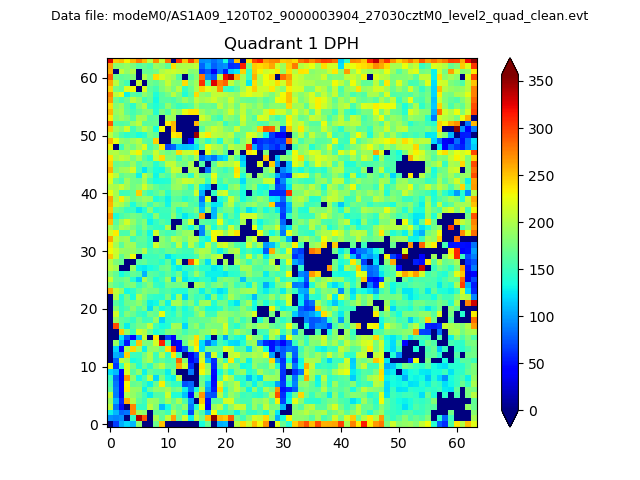
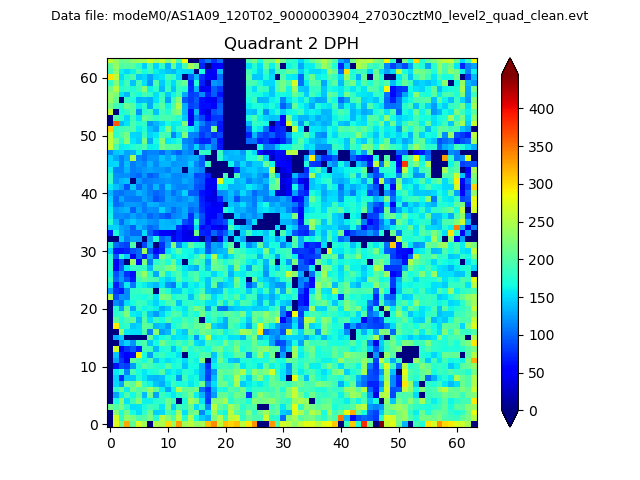
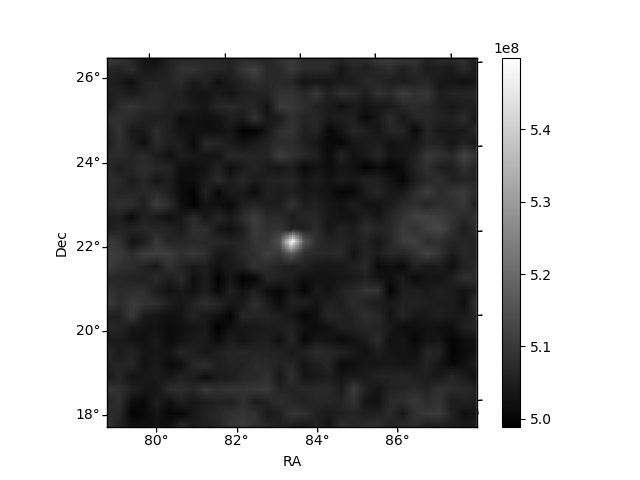
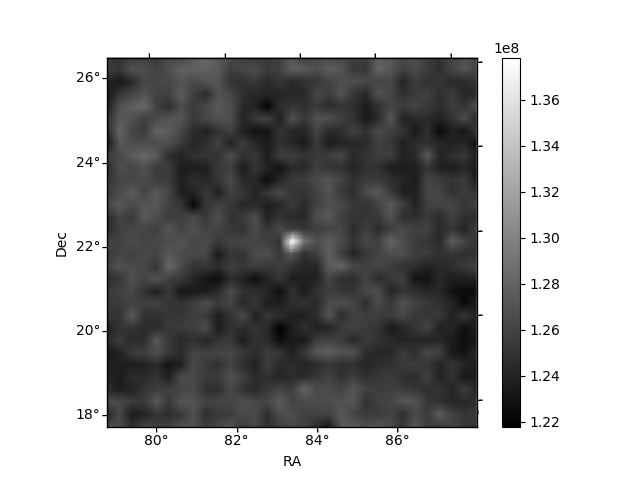
Histogram calculated using DETX and DETY for each event in the final _common_clean file
| Quadrant A |  |
 |
Quadrant B |
|---|---|---|---|
| Quadrant D | 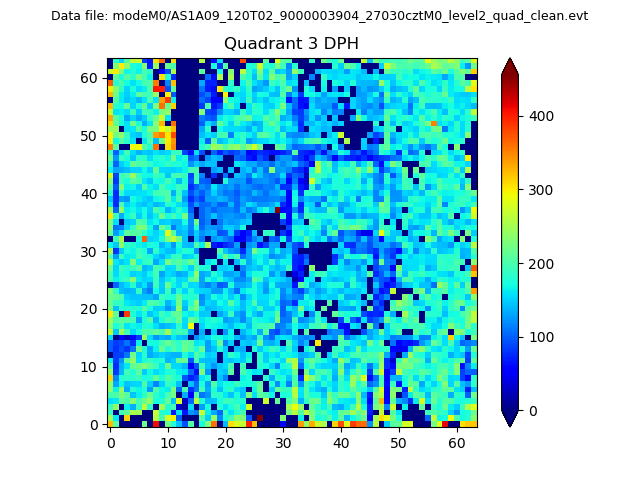 |
 |
Quadrant C |
| Plot type | Count rate plots | Images |
|---|---|---|
| Comparison with Poisson distribution Blue bars denote a histogram of data divided into 1 sec bins. Red curve is a Poisson curve with rate = median count rate of data. |
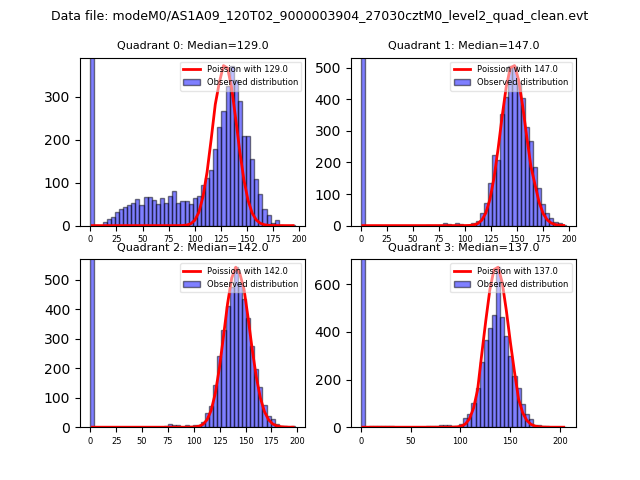 |
 |
| Quadrant-wise count rates Data is divided into 100 sec bins |
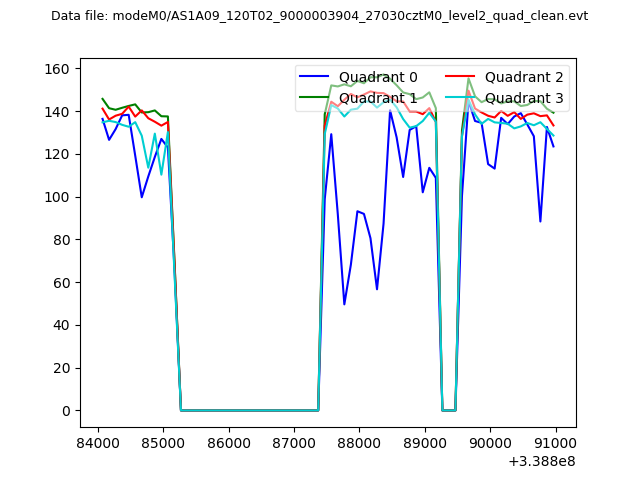 |
|
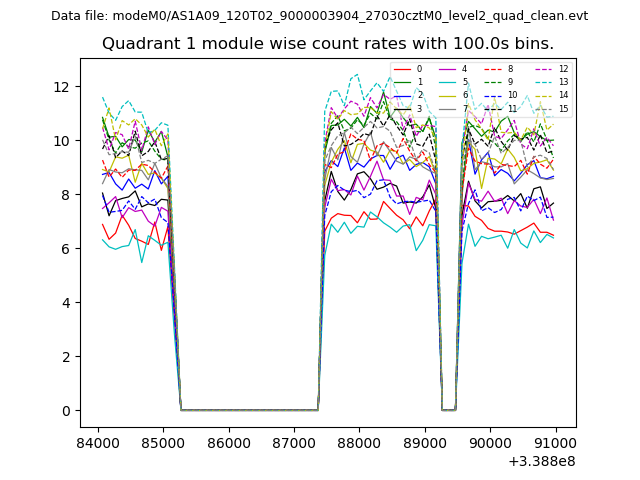
| Module-wise count rates for Quadrant A Data is divided into 100 sec bins |
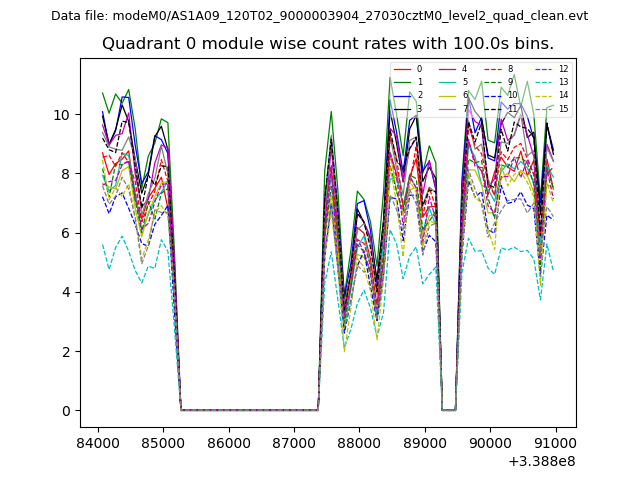 |
 |
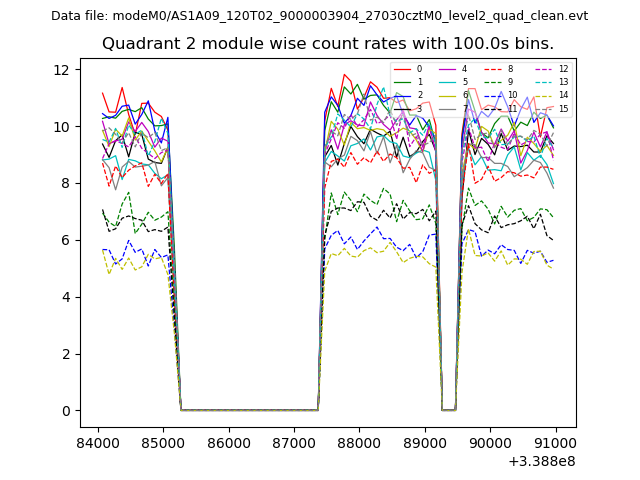
| Module-wise count rates for Quadrant B Data is divided into 100 sec bins |
 |
 |
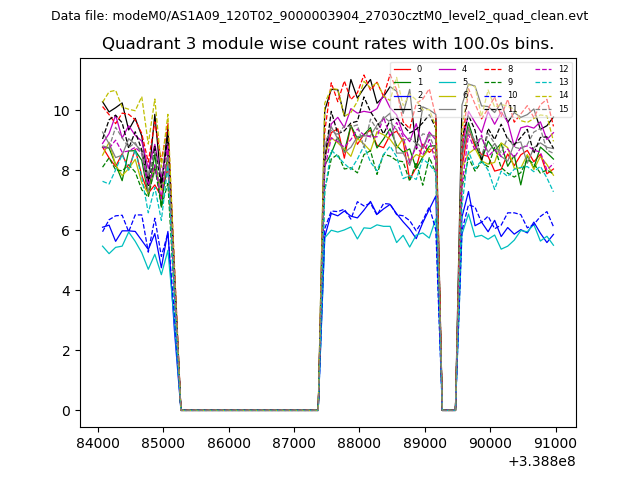
| Module-wise count rates for Quadrant C Data is divided into 100 sec bins |
 |
 |
| Module-wise count rates for Quadrant D Data is divided into 100 sec bins |
 |
 |
| Parameter | Plot |
|---|---|
| CZT HV Monitor |  |
| D_VDD | 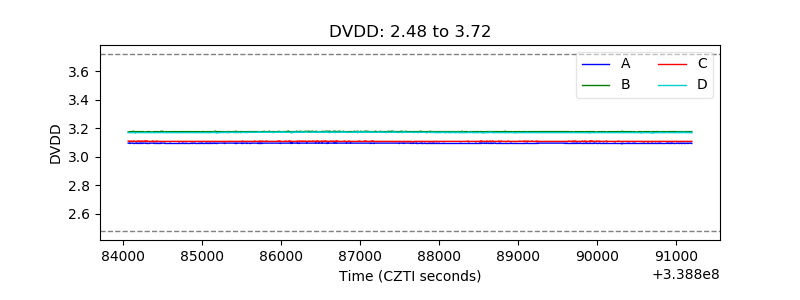 |
| Temperature 1 | 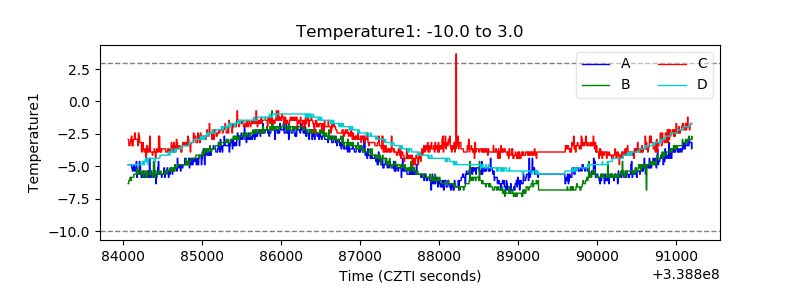 |
| Veto HV Monitor | 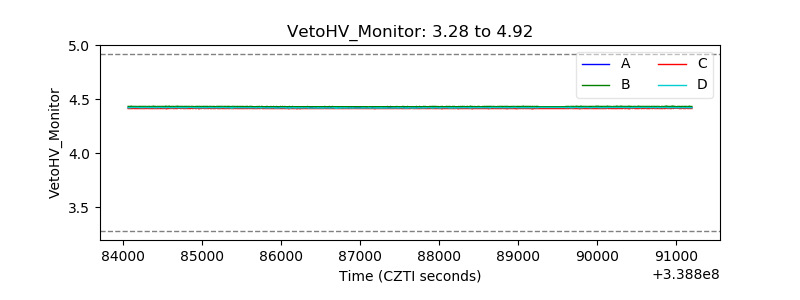 |
| Veto LLD | 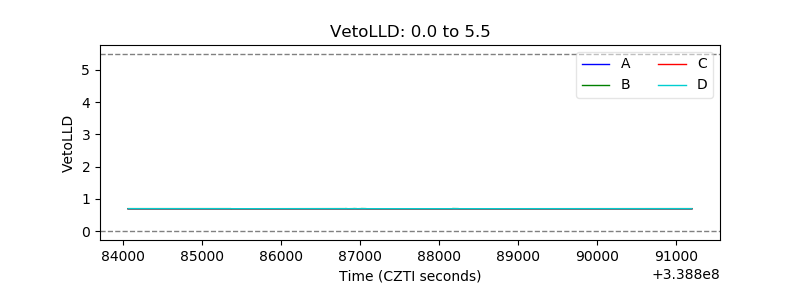 |
| Alpha Counter | 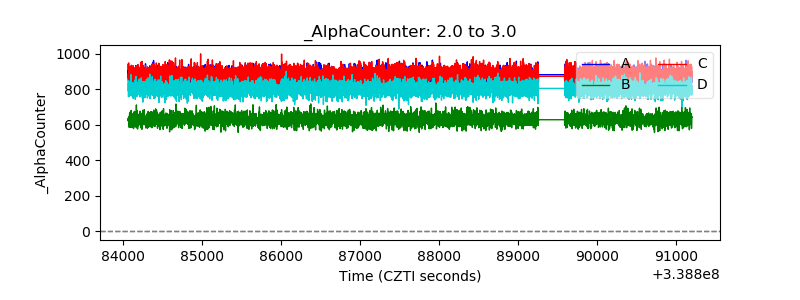 |
| _CPM_Rate | 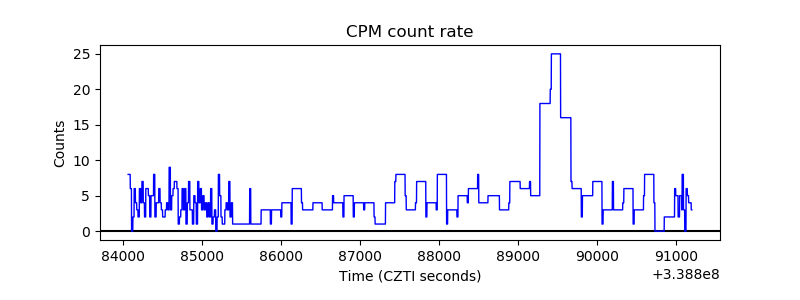 |
| CZT Counter | 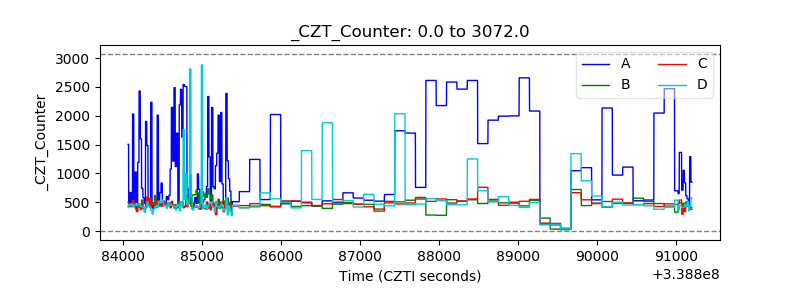 |
| +2.5 Volts monitor |  |
| +5 Volts monitor |  |
| _ROLL_ROT | 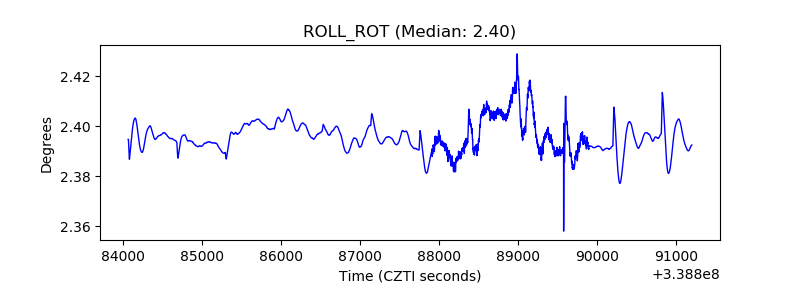 |
| _Roll_DEC | 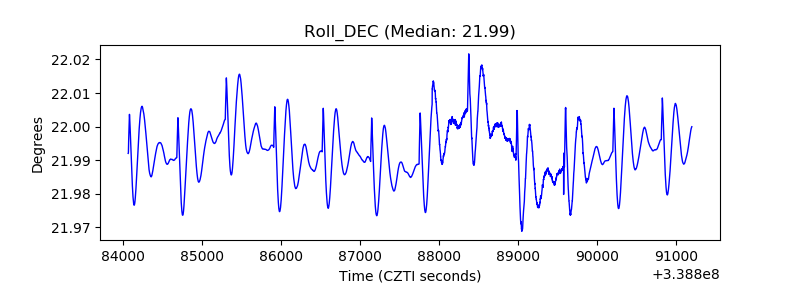 |
| _Roll_RA | 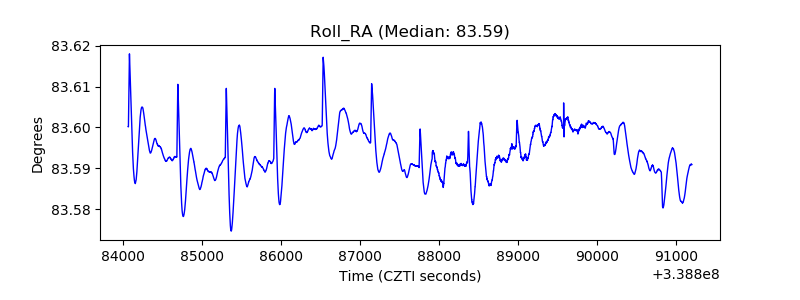 |
| Veto Counter | 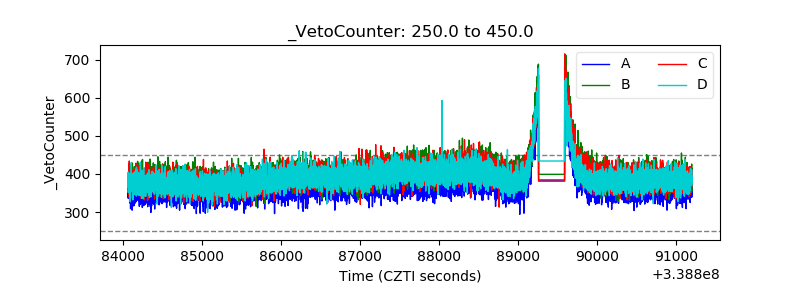 |