| Param | Original file | Final file |
|---|---|---|
| Filename | modeM0/AS1A09_120T02_9000003904_27034cztM0_level2.evt | modeM0/AS1A09_120T02_9000003904_27034cztM0_level2_quad_clean.evt |
| Size (bytes) | 663,327,360 | 70,925,760 |
| Size | 632.6 MB | 67.6 MB |
| Events in quadrant A | 7,922,052 | 364,348 |
| Events in quadrant B | 3,609,052 | 456,494 |
| Events in quadrant C | 3,456,225 | 437,213 |
| Events in quadrant D | 4,650,416 | 424,303 |
| Mode M9 | |||
|---|---|---|---|
| Quadrant | BADHDUFLAG | Total packets | Discarded packets |
| A | 0 | 10 | 0 |
| B | 0 | 10 | 0 |
| C | 0 | 10 | 0 |
| D | 0 | 10 | 0 |
| Mode M0 | |||
|---|---|---|---|
| Quadrant | BADHDUFLAG | Total packets | Discarded packets |
| A | 0 | 28070 | 0 |
| B | 0 | 14738 | 0 |
| C | 0 | 14220 | 0 |
| D | 0 | 18198 | 0 |
| Quadrant | Total seconds | Saturated seconds | Saturation percentage |
|---|---|---|---|
| A | 6670 | 1914 | 28.695652% |
| B | 6670 | 93 | 1.394303% |
| C | 6670 | 110 | 1.649175% |
| D | 6670 | 272 | 4.077961% |
Noise dominated data is calculated using 1-second bins in cleaned event files. If a bin has >2000 counts, and if more than 50% of those come from <1% of pixels, then it is considered to be noise-dominated and hence unusable.
| Quadrant | # 1 sec bins | Bins with >0 counts | Bins with >2000 counts | High rate bins dominated by noise | Noise dominated (total time) | Noise dominated (detector-on time) | Marked lightcurve |
|---|---|---|---|---|---|---|---|
| A | 7645 | 6670 | 1474 | 1474 | 19.28% | 22.10% | 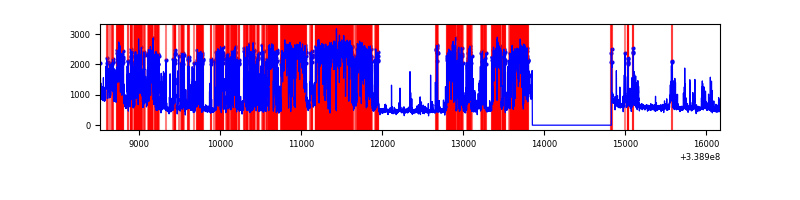 |
| B | 7645 | 6670 | 5 | 5 | 0.07% | 0.07% | 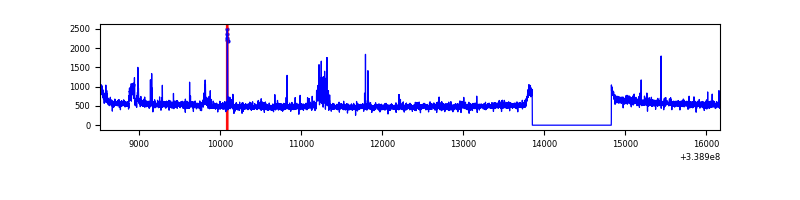 |
| C | 7645 | 6670 | 0 | 0 | 0.00% | 0.00% | 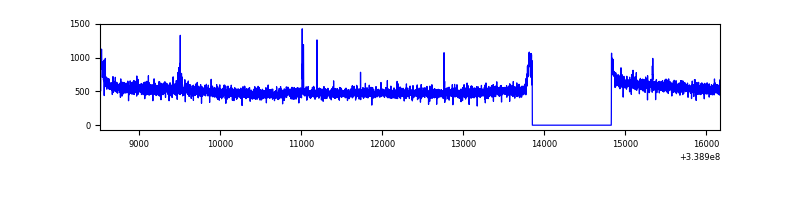 |
| D | 7645 | 6670 | 175 | 175 | 2.29% | 2.62% | 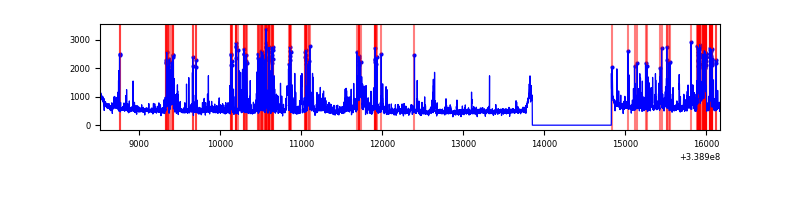 |
Top three noisy pixels from each quadrant. If the there are fewer than three noisy pixels in the level2.evt file, extra rows are filled as -1
| Pixel properties | Quadrant properties | ||||||
|---|---|---|---|---|---|---|---|
| Quadrant | DetID | PixID | Counts | Sigma | Mean | Median | Sigma |
| A | 14 | 235 | 4792098 | 30519.57 | 778 | 764 | 157.0 |
| A | 0 | 13 | 108681 | 687.4 | 778 | 764 | 157.0 |
| A | 8 | 192 | 14801 | 89.41 | 778 | 764 | 157.0 |
| B | 10 | 245 | 82026 | 486.17 | 872 | 851 | 167.0 |
| B | 0 | 189 | 66028 | 390.36 | 872 | 851 | 167.0 |
| B | 0 | 219 | 29060 | 168.95 | 872 | 851 | 167.0 |
| C | 14 | 238 | 135911 | 677.55 | 847 | 856 | 199.3 |
| C | 15 | 208 | 15836 | 75.15 | 847 | 856 | 199.3 |
| C | 14 | 225 | 7482 | 33.24 | 847 | 856 | 199.3 |
| D | 1 | 52 | 1016056 | 5083.23 | 846 | 824 | 199.7 |
| D | 12 | 233 | 165655 | 825.3 | 846 | 824 | 199.7 |
| D | 2 | 250 | 119596 | 594.69 | 846 | 824 | 199.7 |
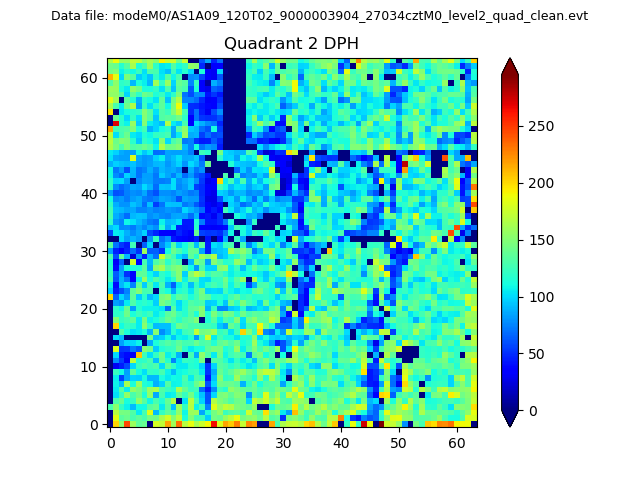
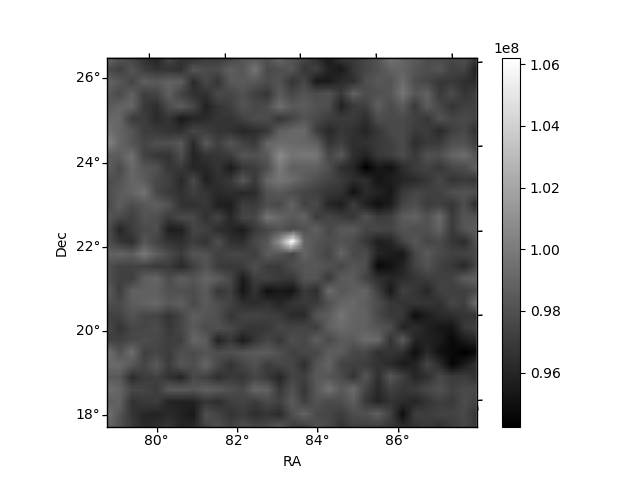
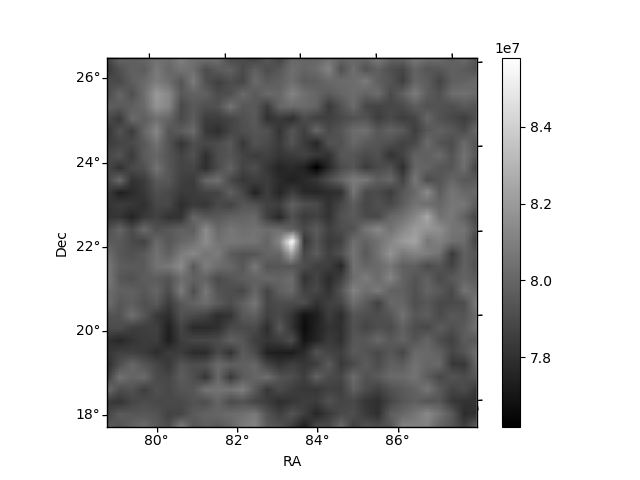
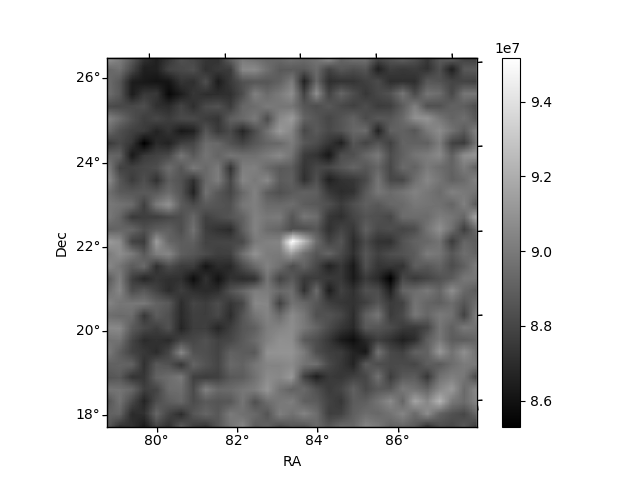
Histogram calculated using DETX and DETY for each event in the final _common_clean file
| Quadrant A | 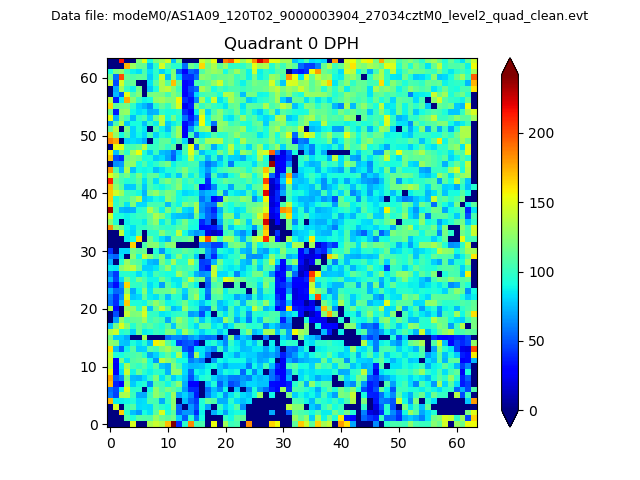 |
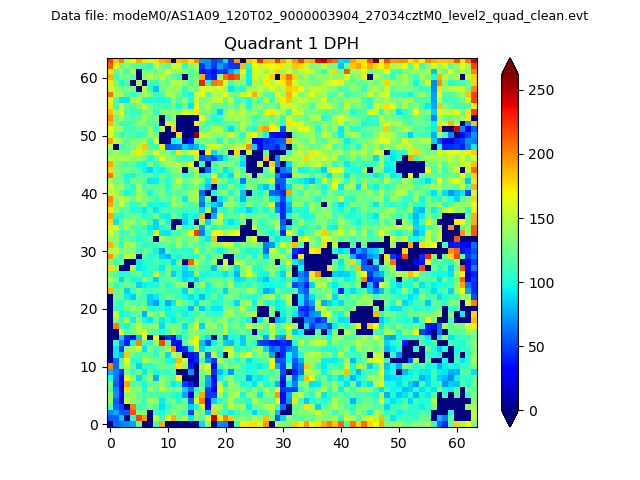 |
Quadrant B |
|---|---|---|---|
| Quadrant D | 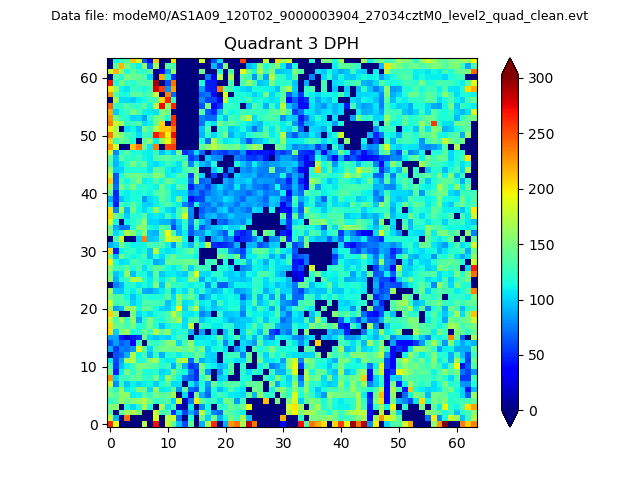 |
 |
Quadrant C |
| Plot type | Count rate plots | Images |
|---|---|---|
| Comparison with Poisson distribution Blue bars denote a histogram of data divided into 1 sec bins. Red curve is a Poisson curve with rate = median count rate of data. |
 |
 |
| Quadrant-wise count rates Data is divided into 100 sec bins |
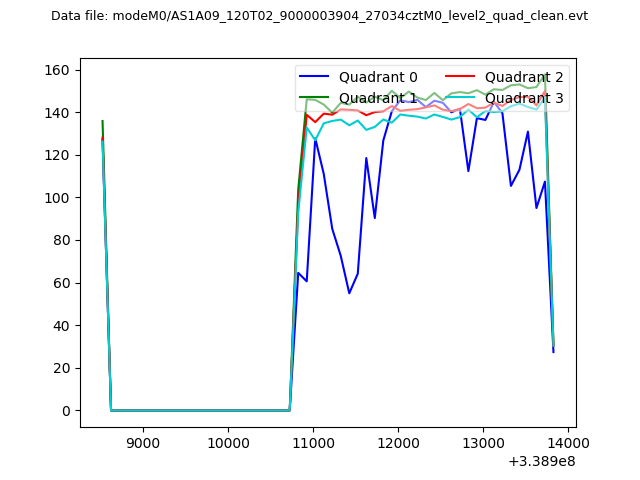 |
|
| Module-wise count rates for Quadrant A Data is divided into 100 sec bins |
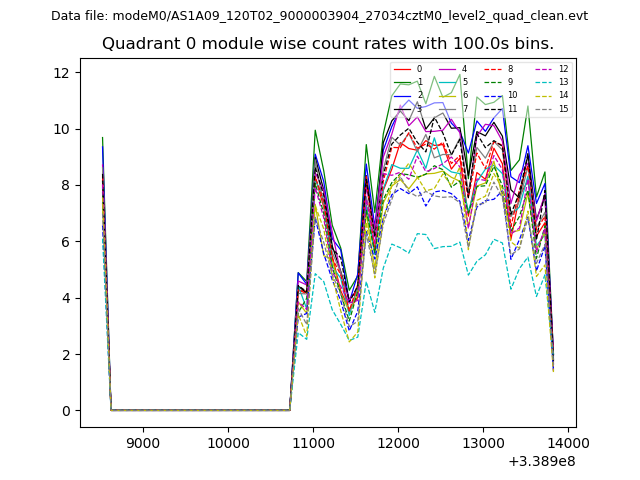 |
 |
| Module-wise count rates for Quadrant B Data is divided into 100 sec bins |
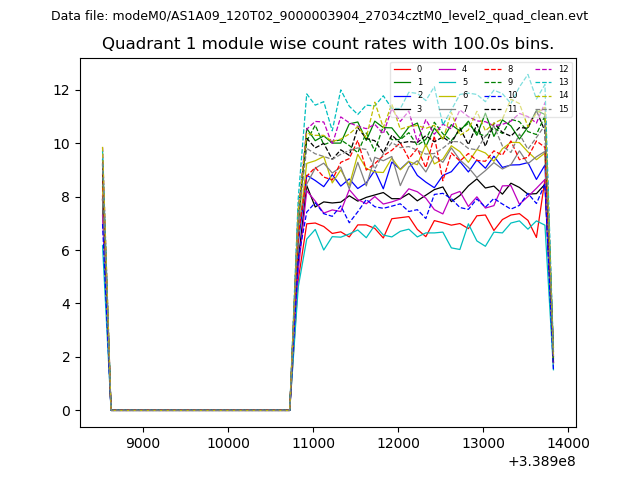 |
 |
| Module-wise count rates for Quadrant C Data is divided into 100 sec bins |
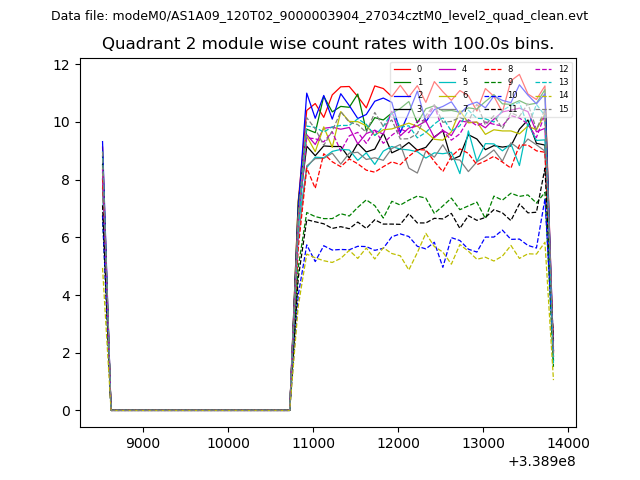 |
 |
| Module-wise count rates for Quadrant D Data is divided into 100 sec bins |
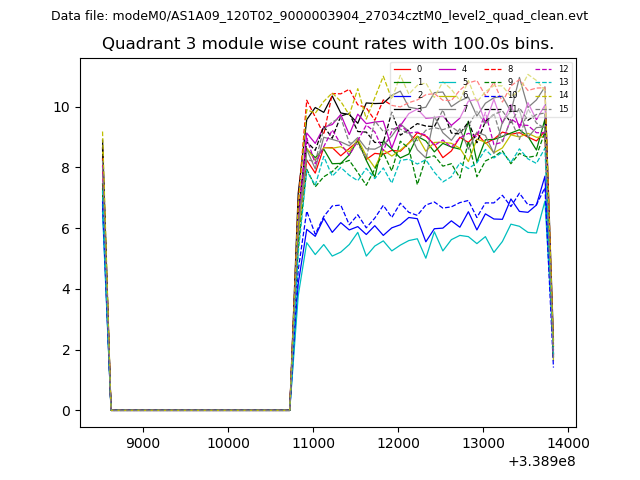 |
 |
| Parameter | Plot |
|---|---|
| CZT HV Monitor | 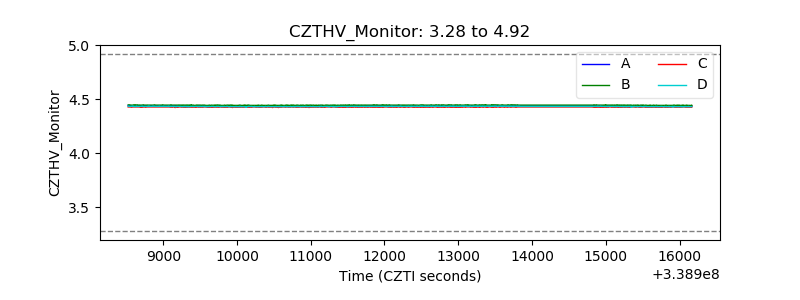 |
| D_VDD |  |
| Temperature 1 |  |
| Veto HV Monitor |  |
| Veto LLD |  |
| Alpha Counter | 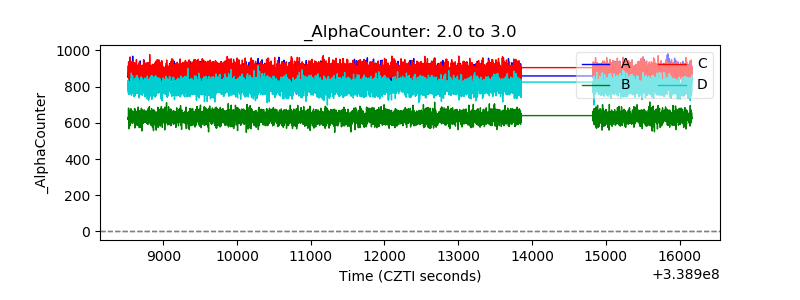 |
| _CPM_Rate | 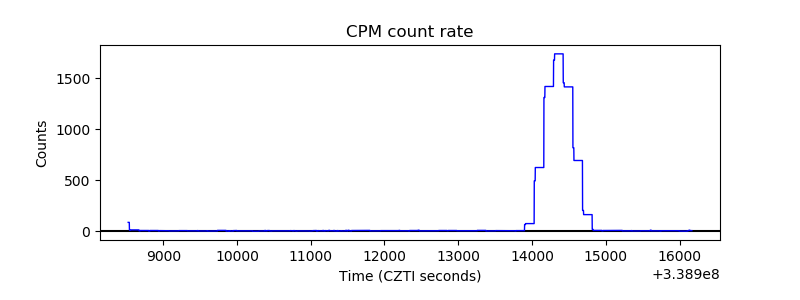 |
| CZT Counter |  |
| +2.5 Volts monitor |  |
| +5 Volts monitor | 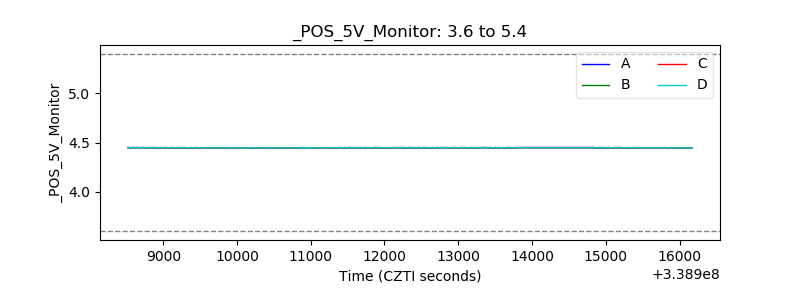 |
| _ROLL_ROT | 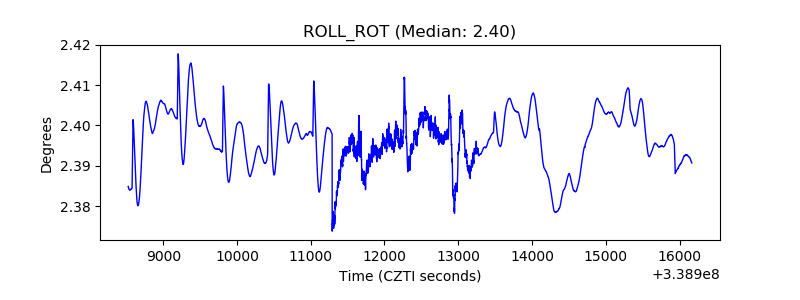 |
| _Roll_DEC | 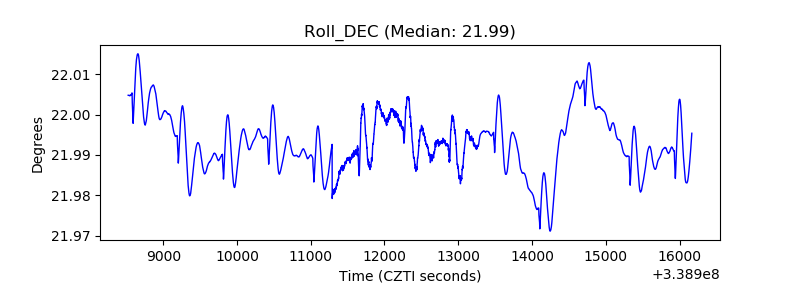 |
| _Roll_RA |  |
| Veto Counter | 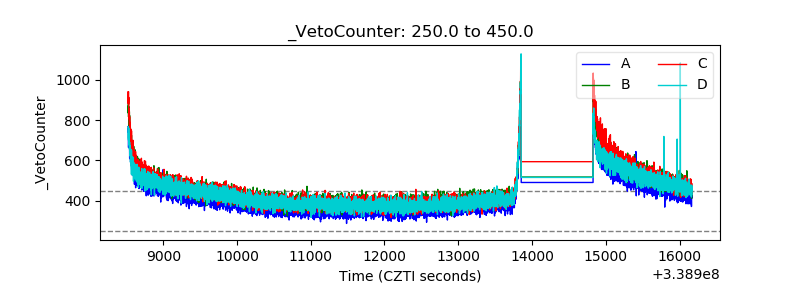 |