| Param | Original file | Final file |
|---|---|---|
| Filename | modeM0/AS1A09_120T02_9000003904_27036cztM0_level2.evt | modeM0/AS1A09_120T02_9000003904_27036cztM0_level2_quad_clean.evt |
| Size (bytes) | 2,528,251,200 | 342,429,120 |
| Size | 2.4 GB | 326.6 MB |
| Events in quadrant A | 27,814,836 | 1,879,886 |
| Events in quadrant B | 14,115,687 | 2,292,420 |
| Events in quadrant C | 13,805,007 | 2,190,153 |
| Events in quadrant D | 18,979,870 | 2,114,889 |
| Mode M9 | |||
|---|---|---|---|
| Quadrant | BADHDUFLAG | Total packets | Discarded packets |
| A | 0 | 40 | 0 |
| B | 0 | 40 | 0 |
| C | 0 | 40 | 0 |
| D | 0 | 40 | 0 |
| Mode M0 | |||
|---|---|---|---|
| Quadrant | BADHDUFLAG | Total packets | Discarded packets |
| A | 0 | 100581 | 0 |
| B | 0 | 58342 | 0 |
| C | 0 | 57502 | 0 |
| D | 0 | 74424 | 0 |
| Quadrant | Total seconds | Saturated seconds | Saturation percentage |
|---|---|---|---|
| A | 27515 | 5804 | 21.093949% |
| B | 27516 | 338 | 1.228376% |
| C | 27516 | 439 | 1.595435% |
| D | 27516 | 1126 | 4.092165% |
Noise dominated data is calculated using 1-second bins in cleaned event files. If a bin has >2000 counts, and if more than 50% of those come from <1% of pixels, then it is considered to be noise-dominated and hence unusable.
| Quadrant | # 1 sec bins | Bins with >0 counts | Bins with >2000 counts | High rate bins dominated by noise | Noise dominated (total time) | Noise dominated (detector-on time) | Marked lightcurve |
|---|---|---|---|---|---|---|---|
| A | 31555 | 27515 | 4540 | 4540 | 14.39% | 16.50% | 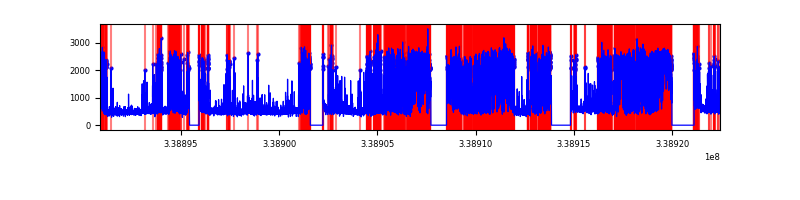 |
| B | 31556 | 27516 | 10 | 10 | 0.03% | 0.04% | 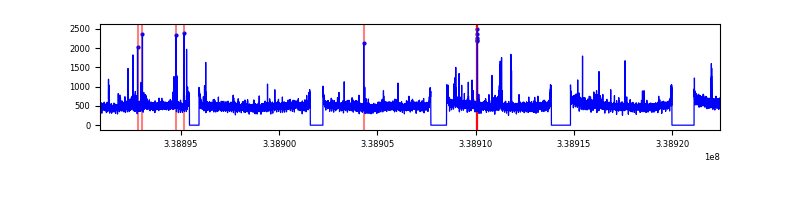 |
| C | 31556 | 27516 | 0 | 0 | 0.00% | 0.00% | 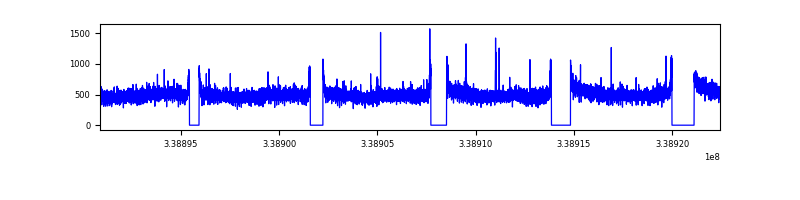 |
| D | 31556 | 27516 | 883 | 883 | 2.80% | 3.21% | 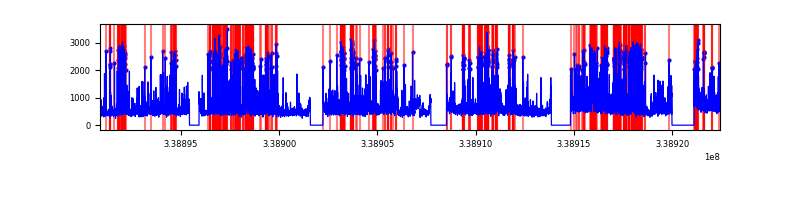 |
Top three noisy pixels from each quadrant. If the there are fewer than three noisy pixels in the level2.evt file, extra rows are filled as -1
| Pixel properties | Quadrant properties | ||||||
|---|---|---|---|---|---|---|---|
| Quadrant | DetID | PixID | Counts | Sigma | Mean | Median | Sigma |
| A | 14 | 235 | 14929249 | 23535.1 | 3169 | 3117 | 634.2 |
| A | 0 | 13 | 339942 | 531.1 | 3169 | 3117 | 634.2 |
| A | 6 | 16 | 260370 | 405.63 | 3169 | 3117 | 634.2 |
| B | 0 | 189 | 133578 | 194.52 | 3501 | 3413 | 669.2 |
| B | 10 | 245 | 108281 | 156.72 | 3501 | 3413 | 669.2 |
| B | 0 | 219 | 99442 | 143.51 | 3501 | 3413 | 669.2 |
| C | 14 | 238 | 543557 | 679.1 | 3394 | 3424 | 795.4 |
| C | 15 | 208 | 43684 | 50.62 | 3394 | 3424 | 795.4 |
| C | 13 | 61 | 23248 | 24.92 | 3394 | 3424 | 795.4 |
| D | 1 | 52 | 3946478 | 4937.64 | 3378 | 3297 | 798.6 |
| D | 5 | 222 | 1100300 | 1373.66 | 3378 | 3297 | 798.6 |
| D | 2 | 250 | 595037 | 740.97 | 3378 | 3297 | 798.6 |
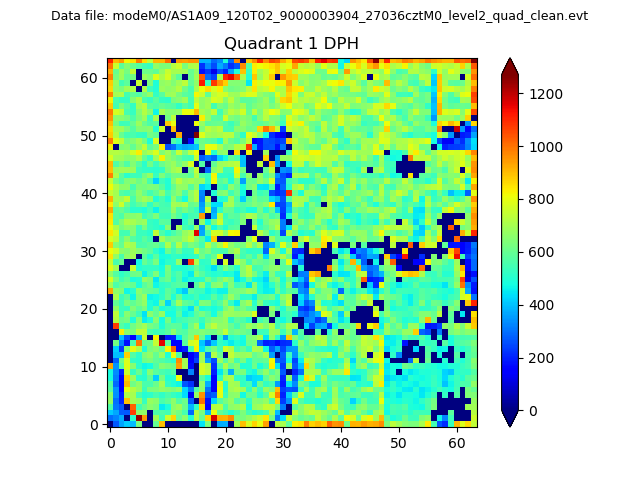
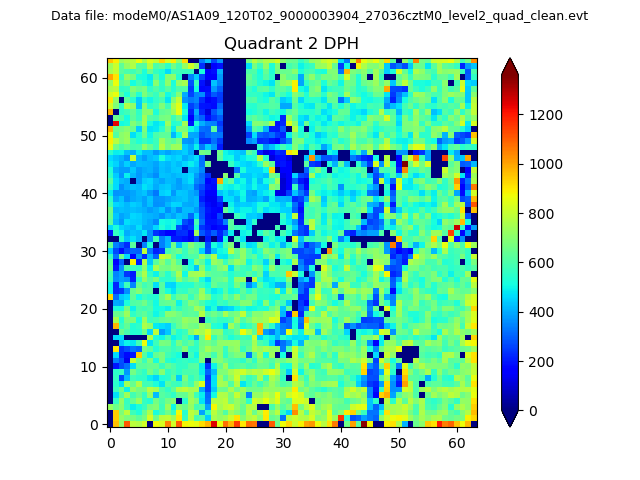
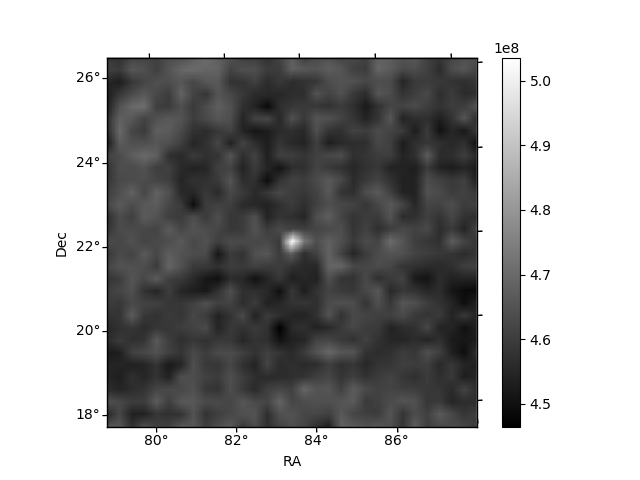
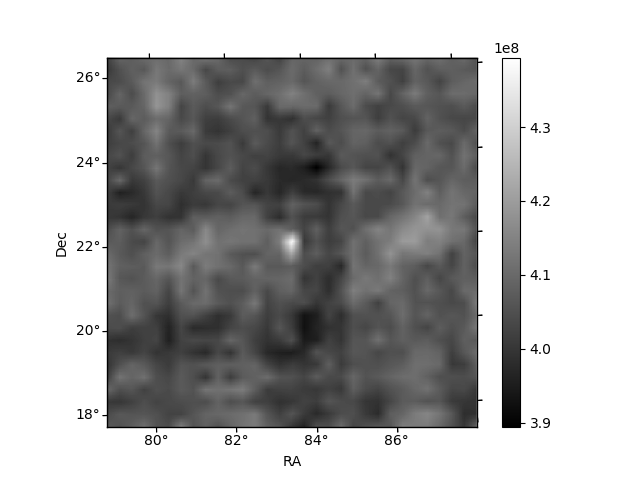
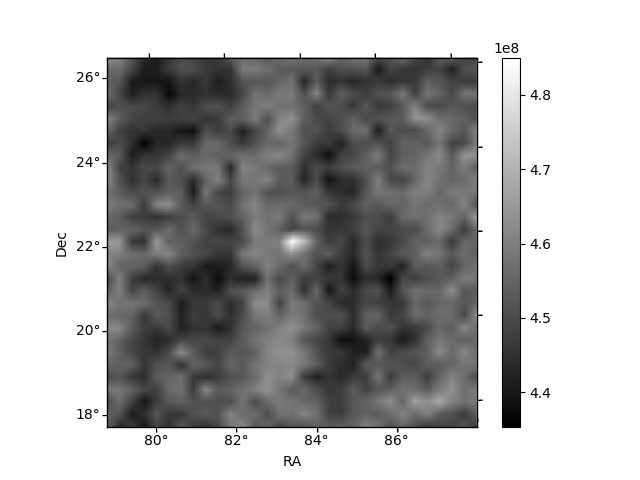
Histogram calculated using DETX and DETY for each event in the final _common_clean file
| Quadrant A |  |
 |
Quadrant B |
|---|---|---|---|
| Quadrant D |  |
 |
Quadrant C |
| Plot type | Count rate plots | Images |
|---|---|---|
| Comparison with Poisson distribution Blue bars denote a histogram of data divided into 1 sec bins. Red curve is a Poisson curve with rate = median count rate of data. |
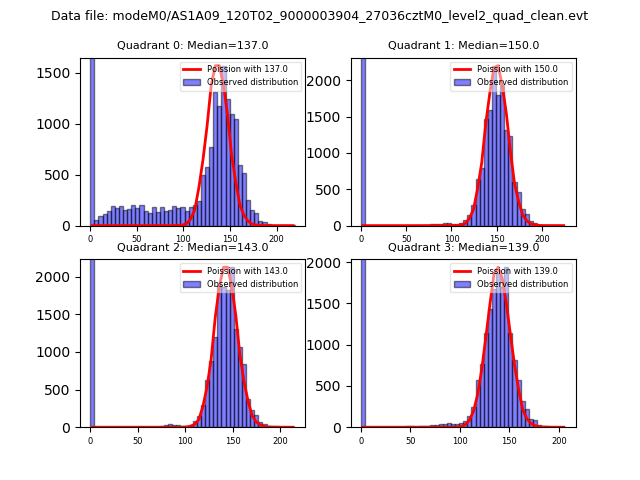 |
 |
| Quadrant-wise count rates Data is divided into 100 sec bins |
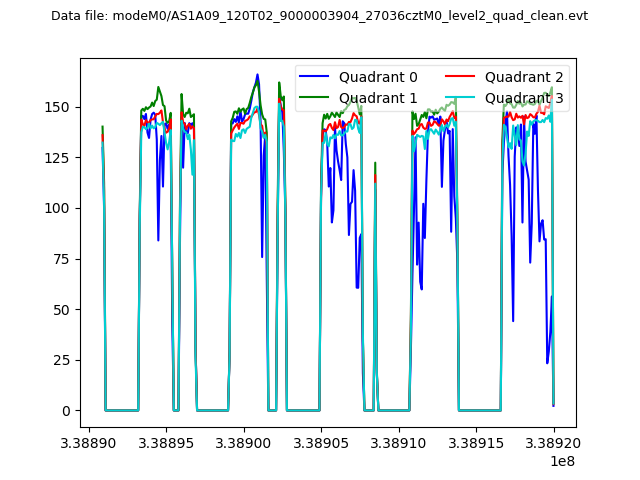 |
|
| Module-wise count rates for Quadrant A Data is divided into 100 sec bins |
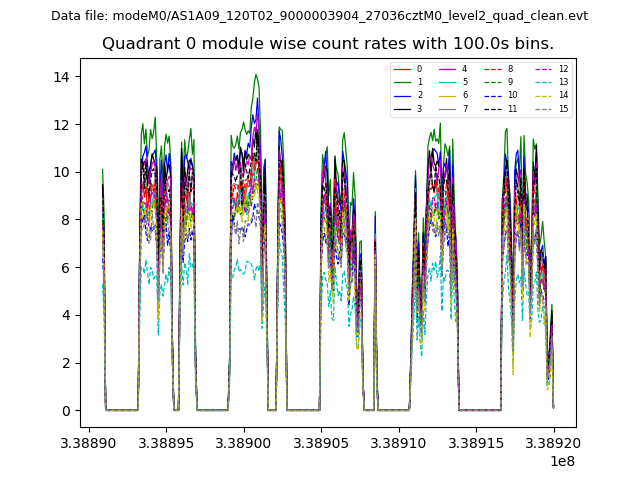 |
 |
| Module-wise count rates for Quadrant B Data is divided into 100 sec bins |
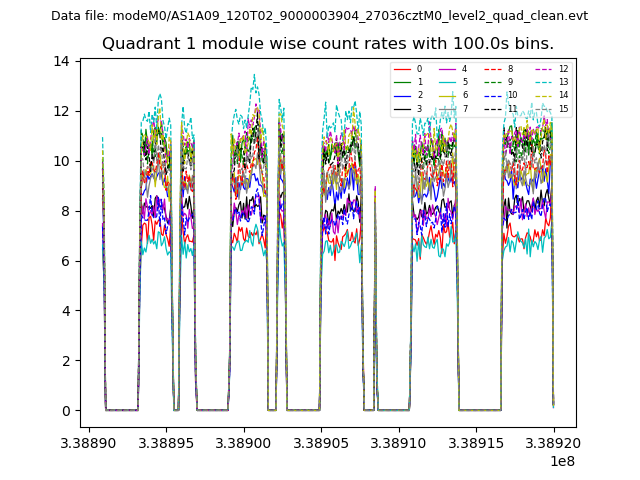 |
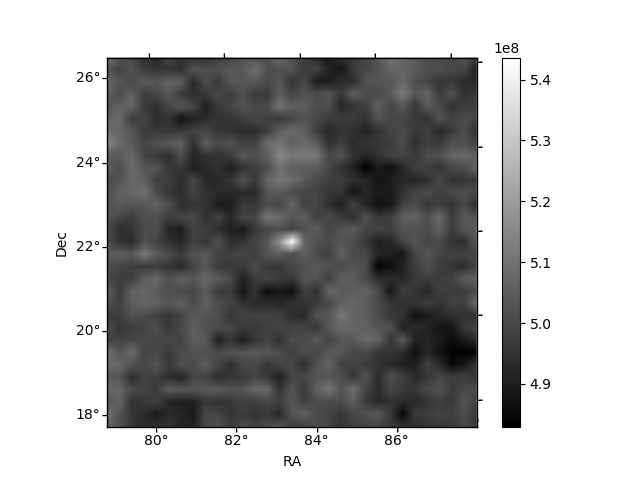 |
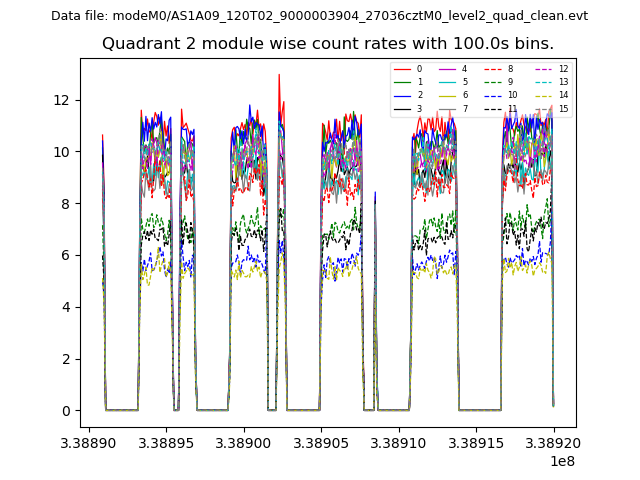
| Module-wise count rates for Quadrant C Data is divided into 100 sec bins |
 |
 |
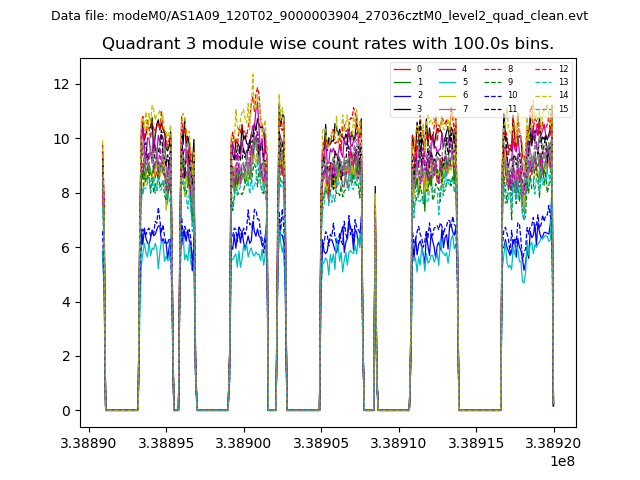
| Module-wise count rates for Quadrant D Data is divided into 100 sec bins |
 |
 |
| Parameter | Plot |
|---|---|
| CZT HV Monitor | 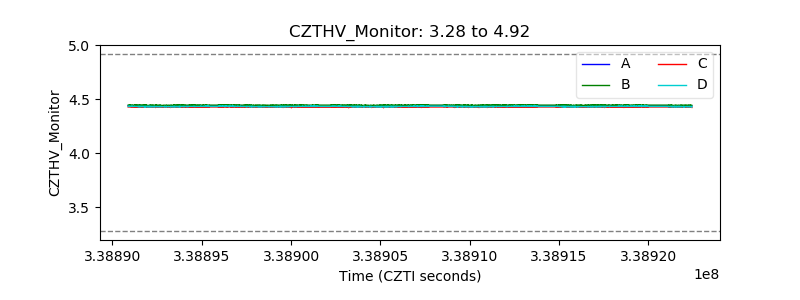 |
| D_VDD | 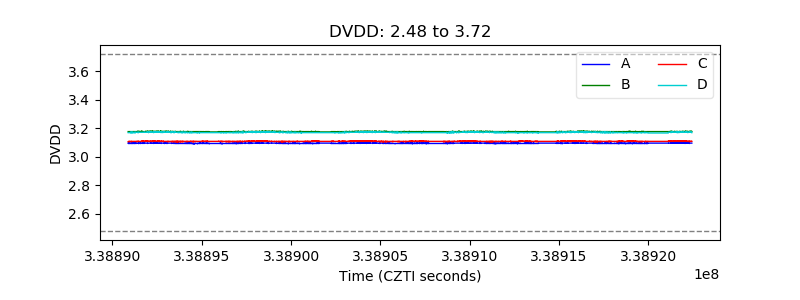 |
| Temperature 1 | 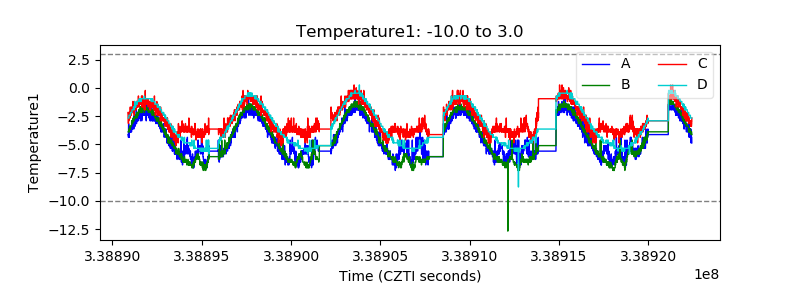 |
| Veto HV Monitor | 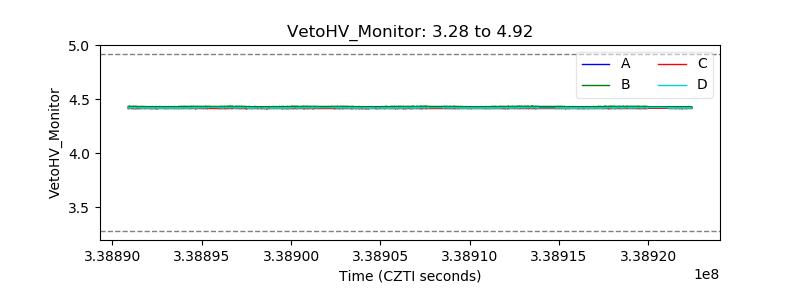 |
| Veto LLD | 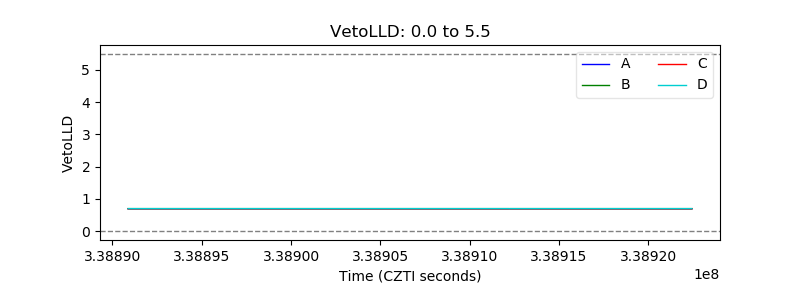 |
| Alpha Counter | 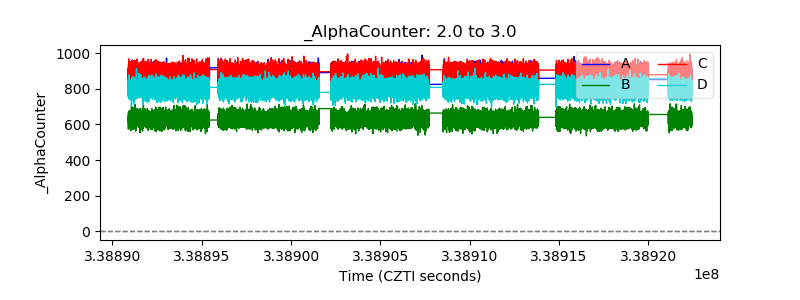 |
| _CPM_Rate | 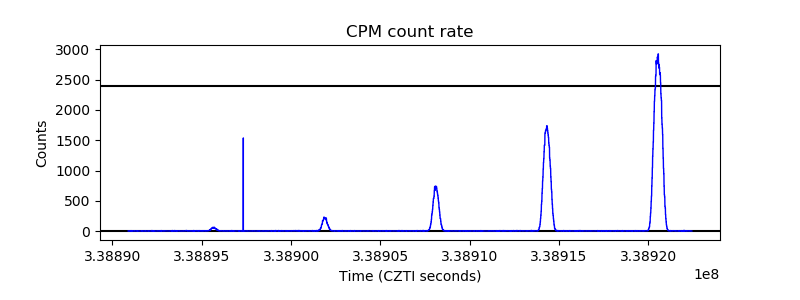 |
| CZT Counter | 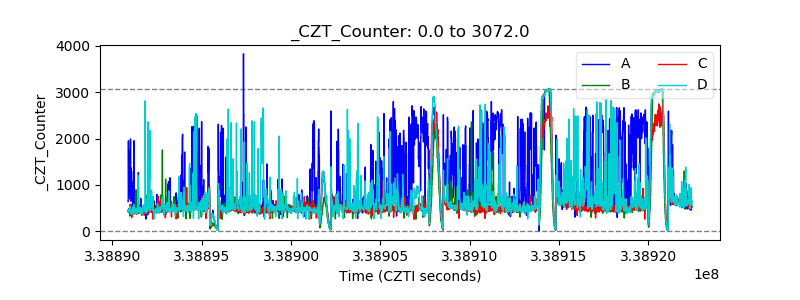 |
| +2.5 Volts monitor |  |
| +5 Volts monitor |  |
| _ROLL_ROT | 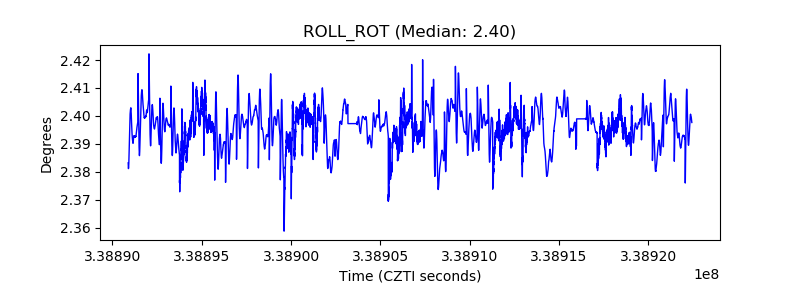 |
| _Roll_DEC | 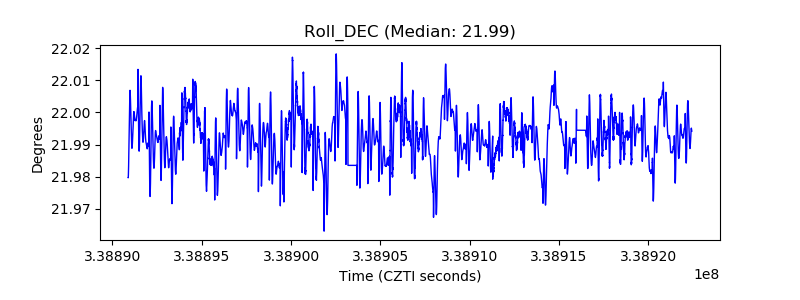 |
| _Roll_RA | 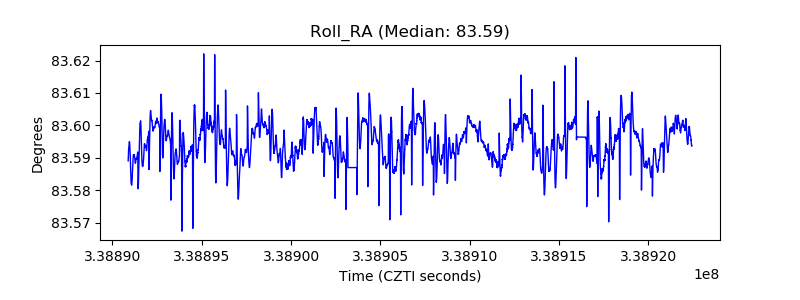 |
| Veto Counter | 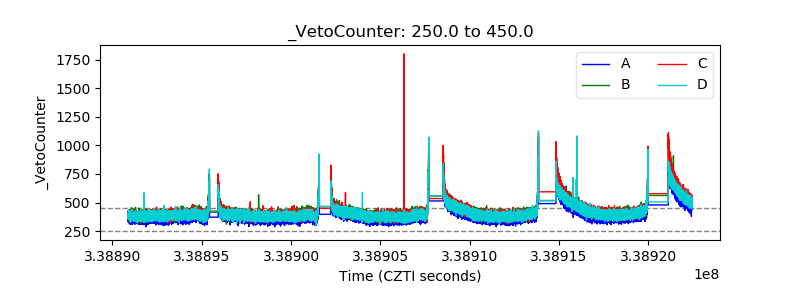 |