| Param | Original file | Final file |
|---|---|---|
| Filename | modeM0/AS1A09_120T02_9000003904_27037cztM0_level2.evt | modeM0/AS1A09_120T02_9000003904_27037cztM0_level2_quad_clean.evt |
| Size (bytes) | 641,016,000 | 90,244,800 |
| Size | 611.3 MB | 86.1 MB |
| Events in quadrant A | 7,329,916 | 491,308 |
| Events in quadrant B | 3,992,080 | 609,179 |
| Events in quadrant C | 3,553,379 | 604,636 |
| Events in quadrant D | 4,109,299 | 585,362 |
| Mode M9 | |||
|---|---|---|---|
| Quadrant | BADHDUFLAG | Total packets | Discarded packets |
| A | 0 | 15 | 0 |
| B | 0 | 16 | 0 |
| C | 0 | 16 | 0 |
| D | 0 | 16 | 0 |
| Mode M0 | |||
|---|---|---|---|
| Quadrant | BADHDUFLAG | Total packets | Discarded packets |
| A | 0 | 26137 | 0 |
| B | 0 | 15961 | 0 |
| C | 0 | 14614 | 0 |
| D | 0 | 16550 | 0 |
| Quadrant | Total seconds | Saturated seconds | Saturation percentage |
|---|---|---|---|
| A | 6331 | 1765 | 27.878692% |
| B | 6331 | 300 | 4.738588% |
| C | 6330 | 133 | 2.101106% |
| D | 6330 | 128 | 2.022117% |
Noise dominated data is calculated using 1-second bins in cleaned event files. If a bin has >2000 counts, and if more than 50% of those come from <1% of pixels, then it is considered to be noise-dominated and hence unusable.
| Quadrant | # 1 sec bins | Bins with >0 counts | Bins with >2000 counts | High rate bins dominated by noise | Noise dominated (total time) | Noise dominated (detector-on time) | Marked lightcurve |
|---|---|---|---|---|---|---|---|
| A | 7560 | 6330 | 1200 | 1200 | 15.87% | 18.96% | 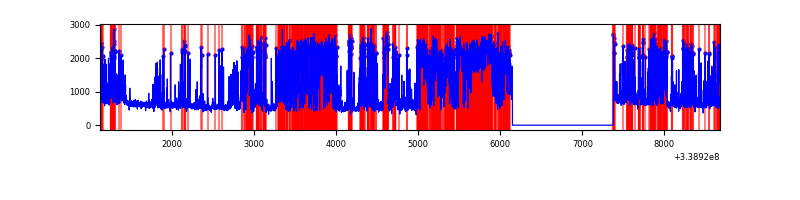 |
| B | 7560 | 6330 | 214 | 214 | 2.83% | 3.38% | 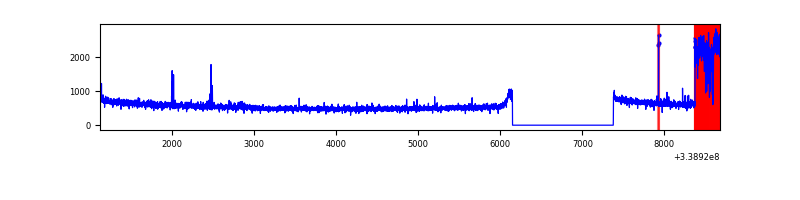 |
| C | 7560 | 6330 | 0 | 0 | 0.00% | 0.00% | 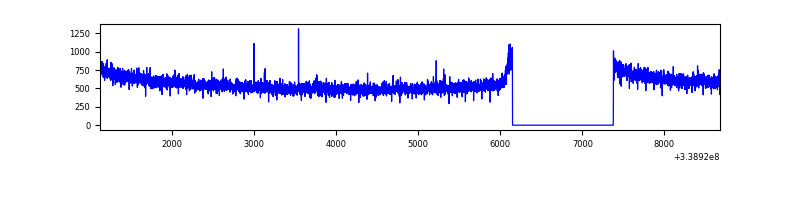 |
| D | 7560 | 6330 | 55 | 55 | 0.73% | 0.87% | 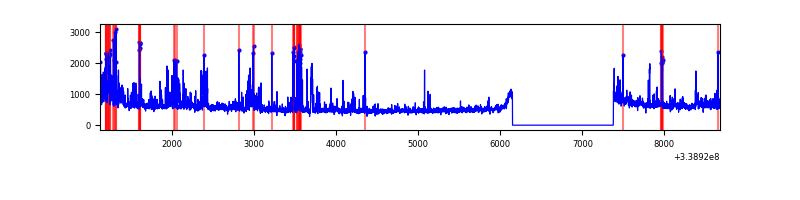 |
Top three noisy pixels from each quadrant. If the there are fewer than three noisy pixels in the level2.evt file, extra rows are filled as -1
| Pixel properties | Quadrant properties | ||||||
|---|---|---|---|---|---|---|---|
| Quadrant | DetID | PixID | Counts | Sigma | Mean | Median | Sigma |
| A | 14 | 235 | 4245508 | 27166.46 | 777 | 765 | 156.2 |
| A | 0 | 13 | 51446 | 324.36 | 777 | 765 | 156.2 |
| A | 8 | 192 | 27132 | 168.75 | 777 | 765 | 156.2 |
| B | 0 | 189 | 519994 | 3121.99 | 882 | 863 | 166.3 |
| B | 0 | 219 | 23632 | 136.93 | 882 | 863 | 166.3 |
| B | 12 | 111 | 18734 | 107.47 | 882 | 863 | 166.3 |
| C | 14 | 238 | 143246 | 701.74 | 873 | 881 | 202.9 |
| C | 13 | 61 | 5922 | 24.85 | 873 | 881 | 202.9 |
| C | 15 | 208 | 5720 | 23.85 | 873 | 881 | 202.9 |
| D | 1 | 52 | 486387 | 2365.69 | 872 | 856 | 205.2 |
| D | 2 | 250 | 218145 | 1058.71 | 872 | 856 | 205.2 |
| D | 5 | 222 | 89716 | 432.96 | 872 | 856 | 205.2 |
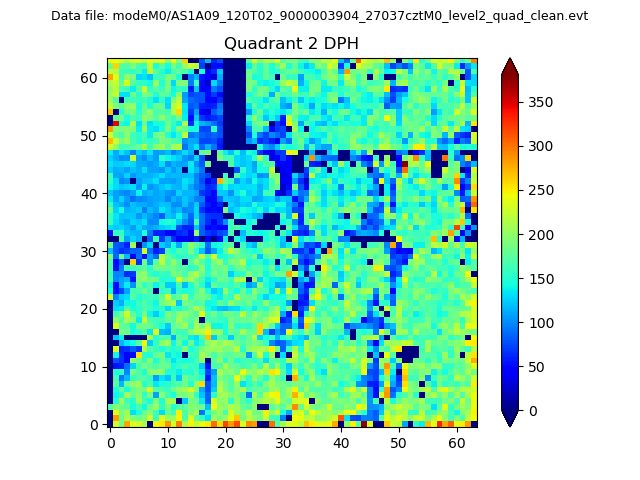
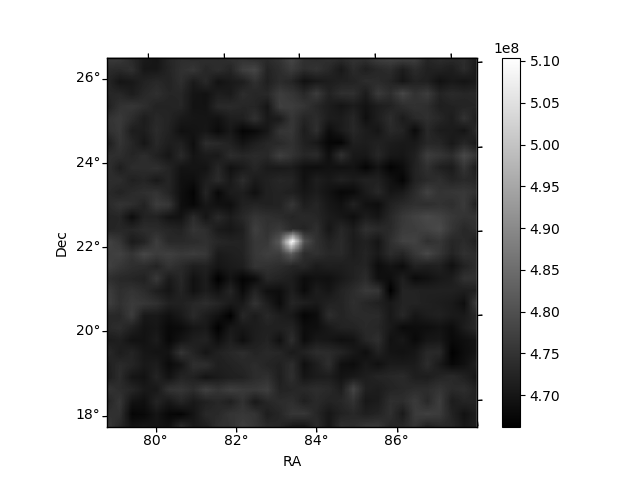
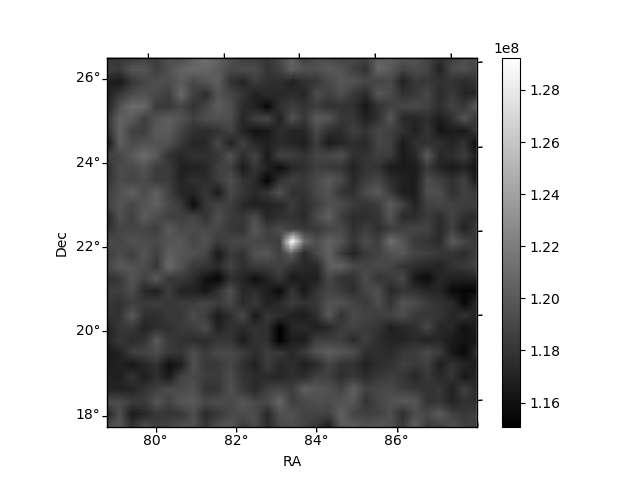
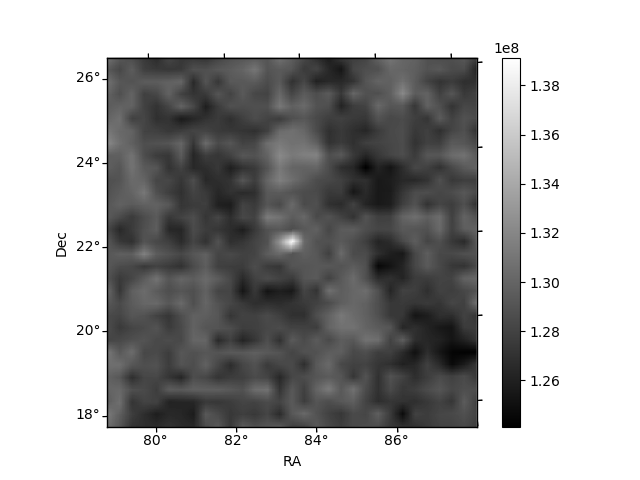
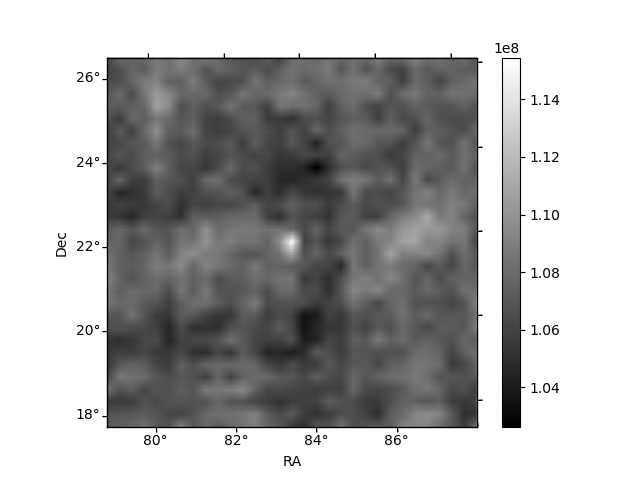
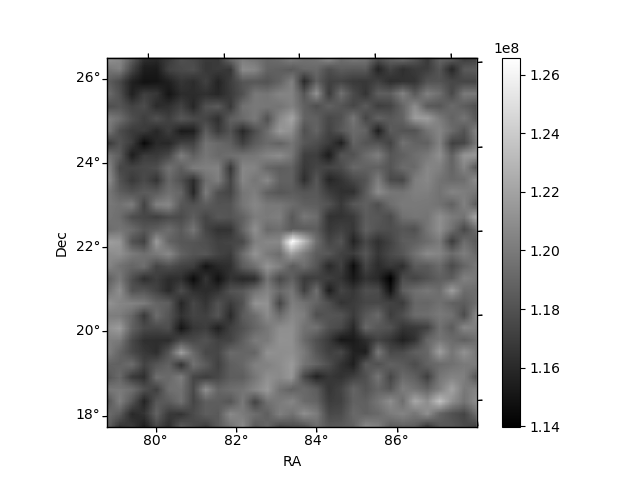
Histogram calculated using DETX and DETY for each event in the final _common_clean file
| Quadrant A | 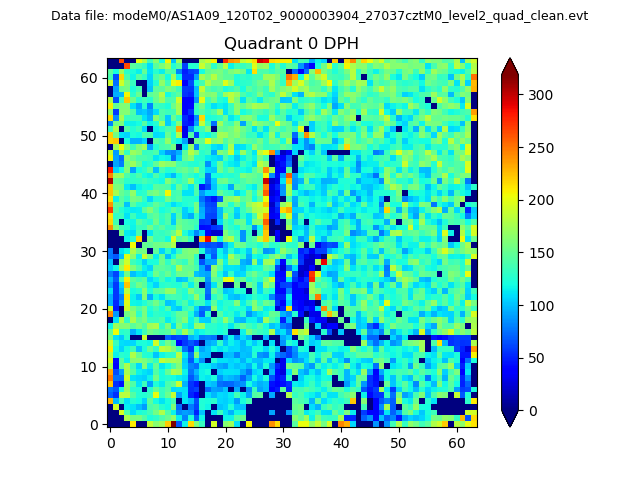 |
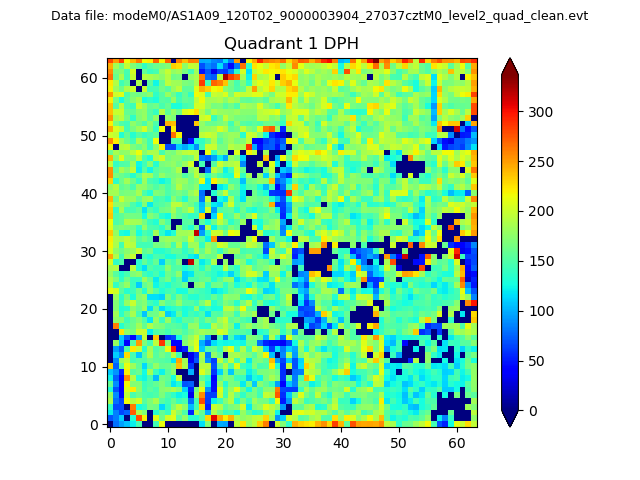 |
Quadrant B |
|---|---|---|---|
| Quadrant D | 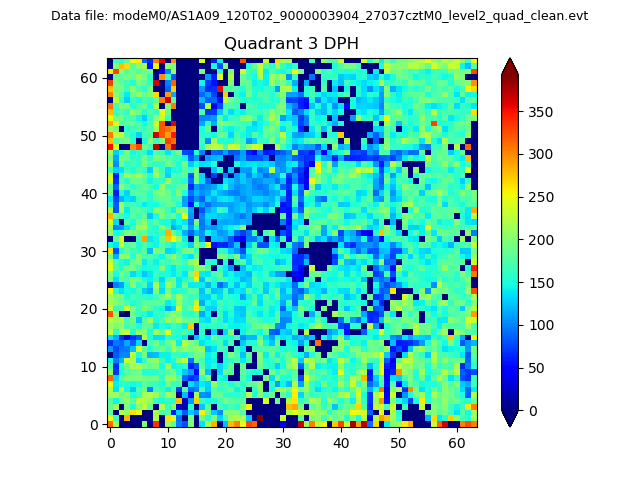 |
 |
Quadrant C |
| Plot type | Count rate plots | Images |
|---|---|---|
| Comparison with Poisson distribution Blue bars denote a histogram of data divided into 1 sec bins. Red curve is a Poisson curve with rate = median count rate of data. |
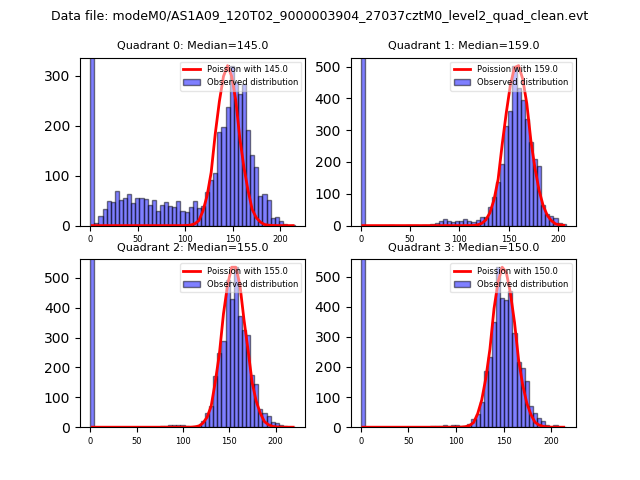 |
 |
| Quadrant-wise count rates Data is divided into 100 sec bins |
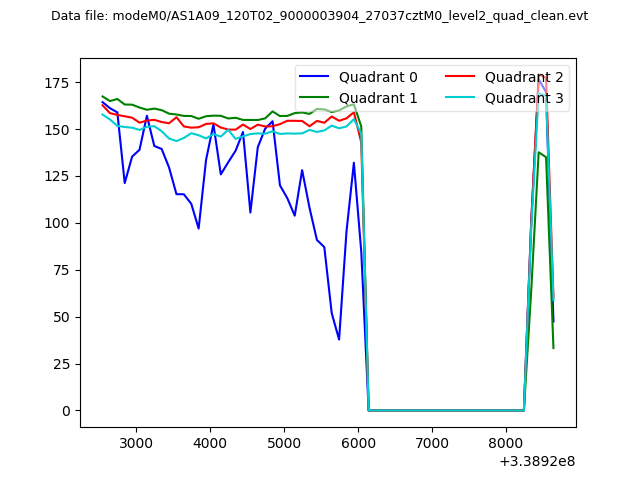 |
|
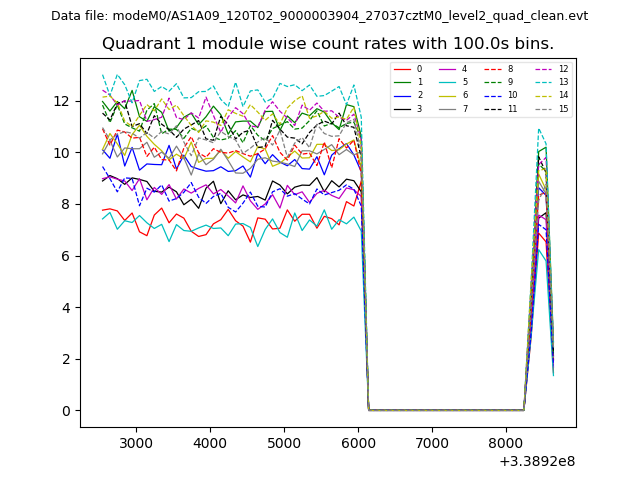
| Module-wise count rates for Quadrant A Data is divided into 100 sec bins |
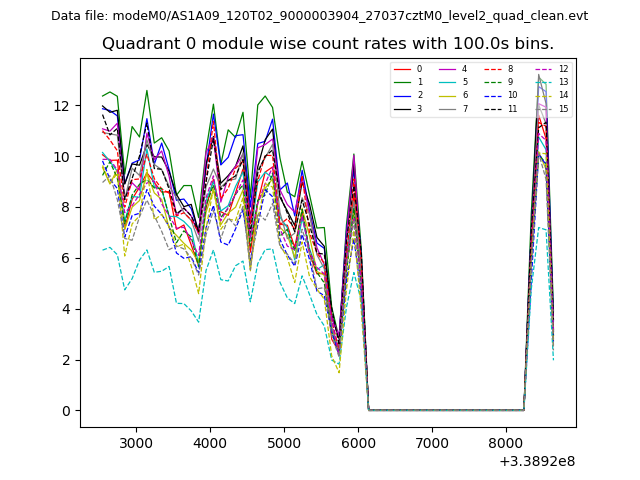 |
 |
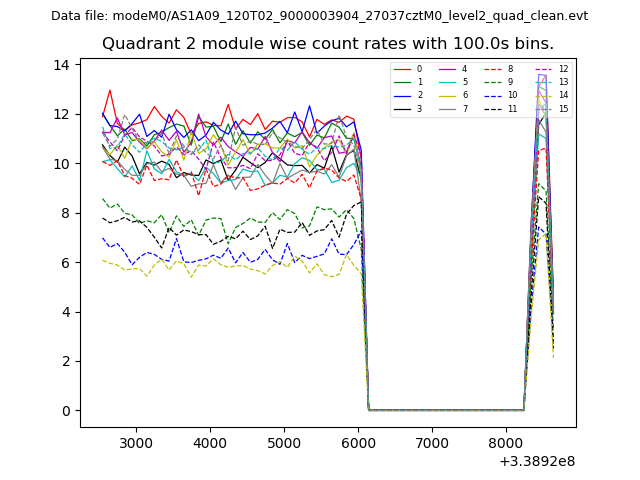
| Module-wise count rates for Quadrant B Data is divided into 100 sec bins |
 |
 |
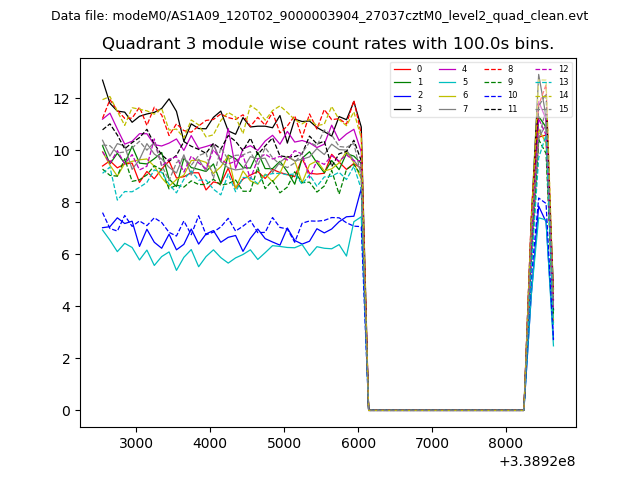
| Module-wise count rates for Quadrant C Data is divided into 100 sec bins |
 |
 |
| Module-wise count rates for Quadrant D Data is divided into 100 sec bins |
 |
 |
| Parameter | Plot |
|---|---|
| CZT HV Monitor | 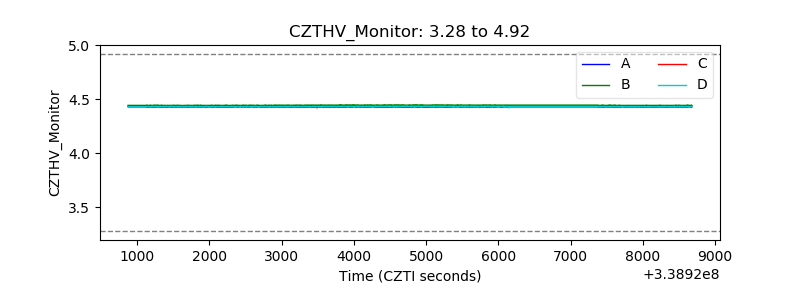 |
| D_VDD | 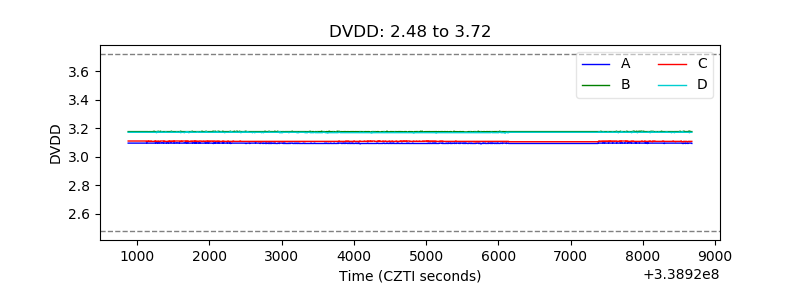 |
| Temperature 1 | 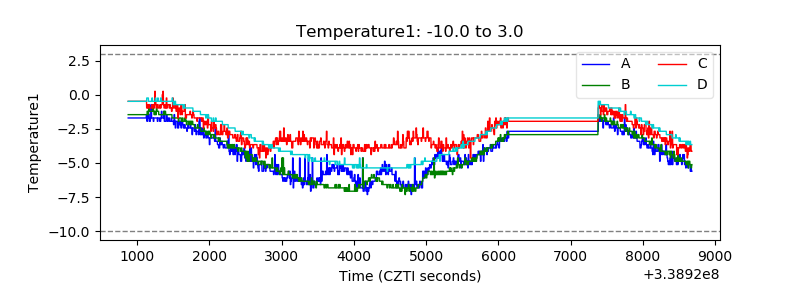 |
| Veto HV Monitor | 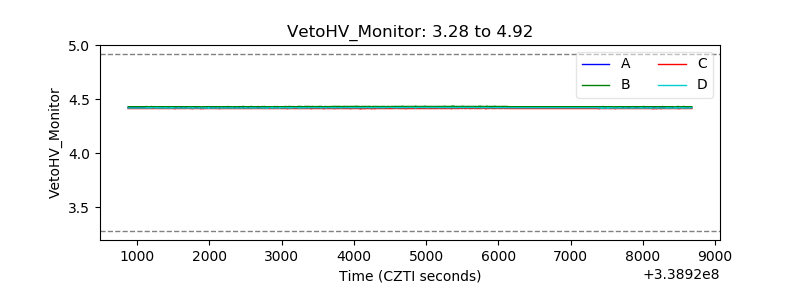 |
| Veto LLD |  |
| Alpha Counter | 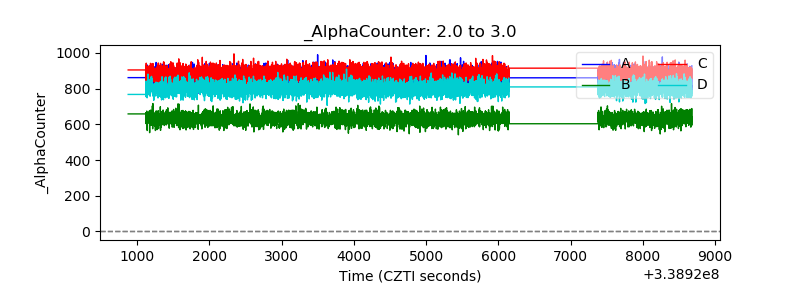 |
| _CPM_Rate | 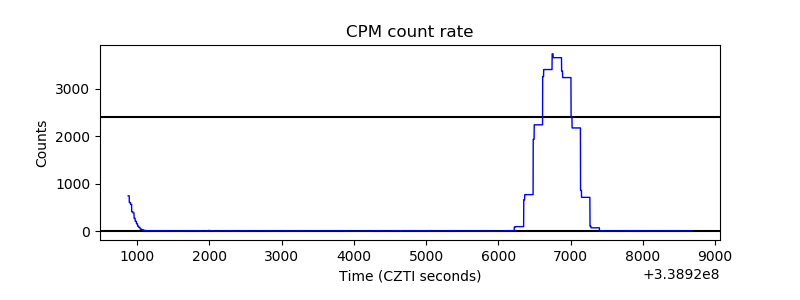 |
| CZT Counter | 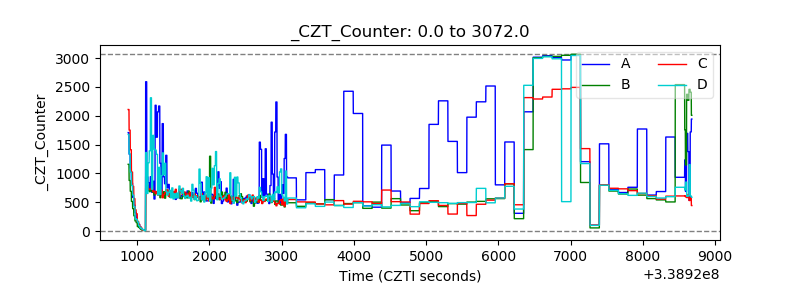 |
| +2.5 Volts monitor |  |
| +5 Volts monitor |  |
| _ROLL_ROT | 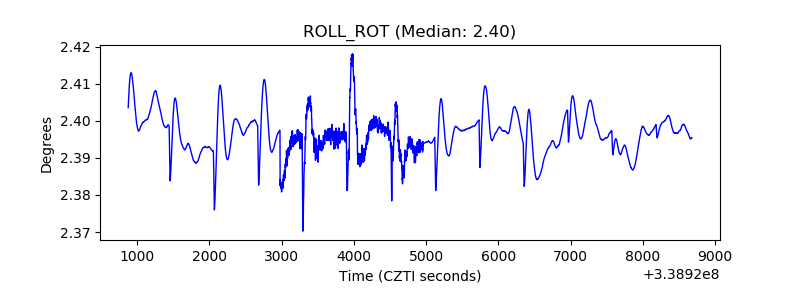 |
| _Roll_DEC | 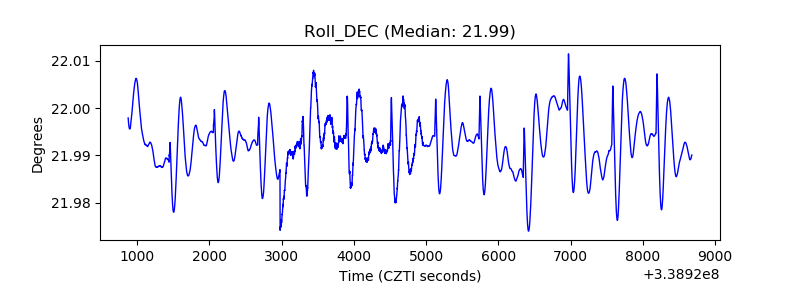 |
| _Roll_RA | 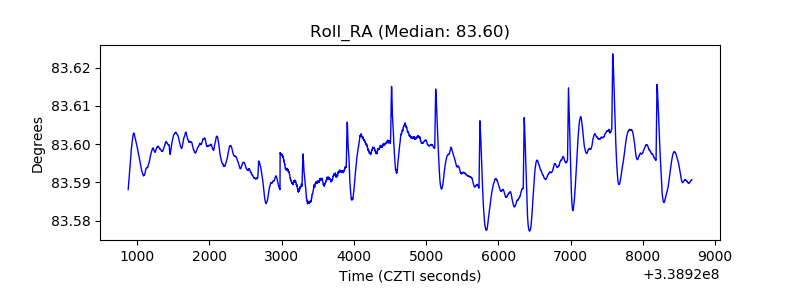 |
| Veto Counter | 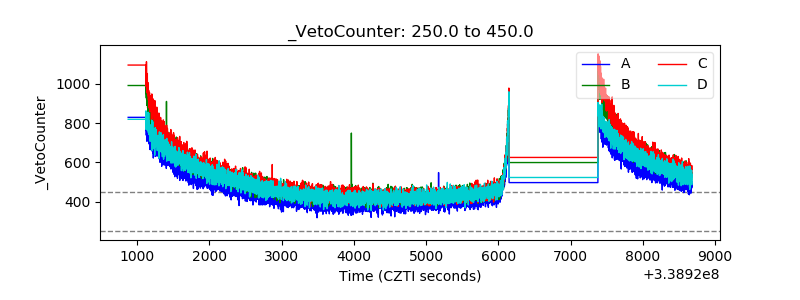 |