| Param | Original file | Final file |
|---|---|---|
| Filename | modeM0/AS1A09_120T02_9000003904_27038cztM0_level2.evt | modeM0/AS1A09_120T02_9000003904_27038cztM0_level2_quad_clean.evt |
| Size (bytes) | 671,641,920 | 99,074,880 |
| Size | 640.5 MB | 94.5 MB |
| Events in quadrant A | 6,845,648 | 600,955 |
| Events in quadrant B | 4,231,579 | 690,907 |
| Events in quadrant C | 3,280,174 | 699,318 |
| Events in quadrant D | 5,589,129 | 601,149 |
| Mode M9 | |||
|---|---|---|---|
| Quadrant | BADHDUFLAG | Total packets | Discarded packets |
| A | 0 | 13 | 0 |
| B | 0 | 13 | 0 |
| C | 0 | 13 | 0 |
| D | 0 | 13 | 0 |
| Mode M0 | |||
|---|---|---|---|
| Quadrant | BADHDUFLAG | Total packets | Discarded packets |
| A | 0 | 24460 | 0 |
| B | 0 | 16349 | 0 |
| C | 0 | 13468 | 0 |
| D | 0 | 20571 | 0 |
| Quadrant | Total seconds | Saturated seconds | Saturation percentage |
|---|---|---|---|
| A | 5820 | 1436 | 24.673540% |
| B | 5821 | 507 | 8.709844% |
| C | 5821 | 105 | 1.803814% |
| D | 5820 | 1044 | 17.938144% |
Noise dominated data is calculated using 1-second bins in cleaned event files. If a bin has >2000 counts, and if more than 50% of those come from <1% of pixels, then it is considered to be noise-dominated and hence unusable.
| Quadrant | # 1 sec bins | Bins with >0 counts | Bins with >2000 counts | High rate bins dominated by noise | Noise dominated (total time) | Noise dominated (detector-on time) | Marked lightcurve |
|---|---|---|---|---|---|---|---|
| A | 7140 | 5820 | 1197 | 1197 | 16.76% | 20.57% | 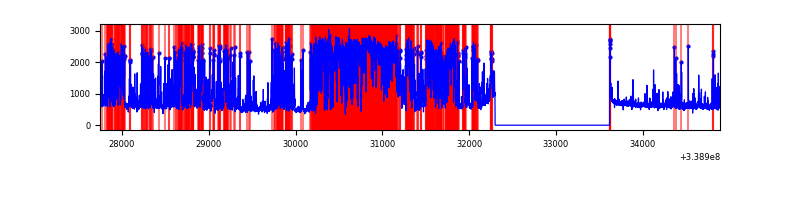 |
| B | 7141 | 5821 | 428 | 428 | 5.99% | 7.35% | 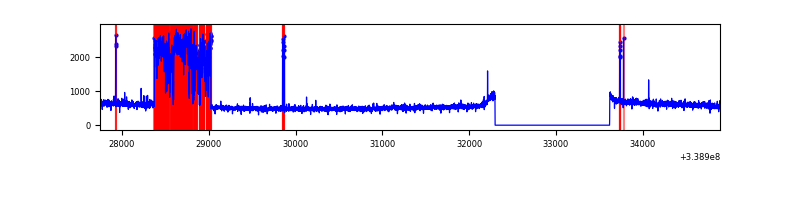 |
| C | 7141 | 5821 | 0 | 0 | 0.00% | 0.00% | 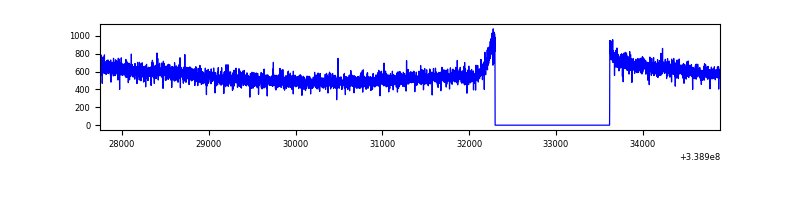 |
| D | 7139 | 5819 | 946 | 946 | 13.25% | 16.26% | 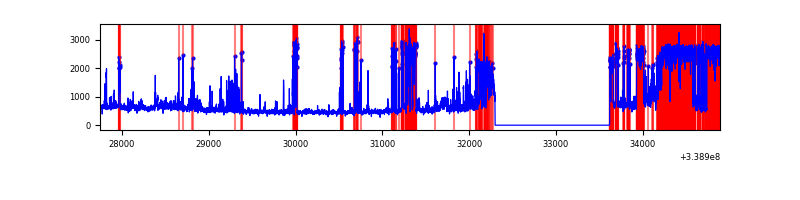 |
Top three noisy pixels from each quadrant. If the there are fewer than three noisy pixels in the level2.evt file, extra rows are filled as -1
| Pixel properties | Quadrant properties | ||||||
|---|---|---|---|---|---|---|---|
| Quadrant | DetID | PixID | Counts | Sigma | Mean | Median | Sigma |
| A | 14 | 235 | 3897809 | 26454.51 | 737 | 724 | 147.3 |
| A | 0 | 13 | 88616 | 596.64 | 737 | 724 | 147.3 |
| A | 8 | 192 | 16200 | 105.06 | 737 | 724 | 147.3 |
| B | 0 | 189 | 1066009 | 7055.15 | 801 | 785 | 151.0 |
| B | 0 | 219 | 28125 | 181.08 | 801 | 785 | 151.0 |
| B | 12 | 111 | 16963 | 107.15 | 801 | 785 | 151.0 |
| C | 14 | 238 | 131899 | 697.62 | 806 | 817 | 187.9 |
| C | 15 | 208 | 5997 | 27.57 | 806 | 817 | 187.9 |
| C | 13 | 61 | 5503 | 24.94 | 806 | 817 | 187.9 |
| D | 1 | 52 | 2550357 | 14757.28 | 732 | 718 | 172.8 |
| D | 2 | 250 | 130959 | 753.83 | 732 | 718 | 172.8 |
| D | 5 | 222 | 116091 | 667.77 | 732 | 718 | 172.8 |
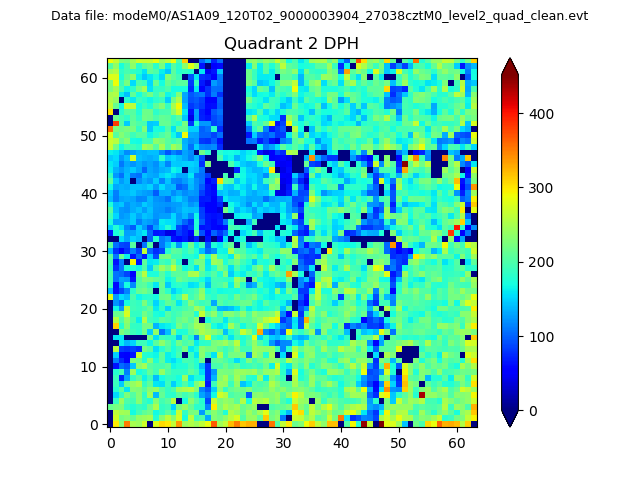
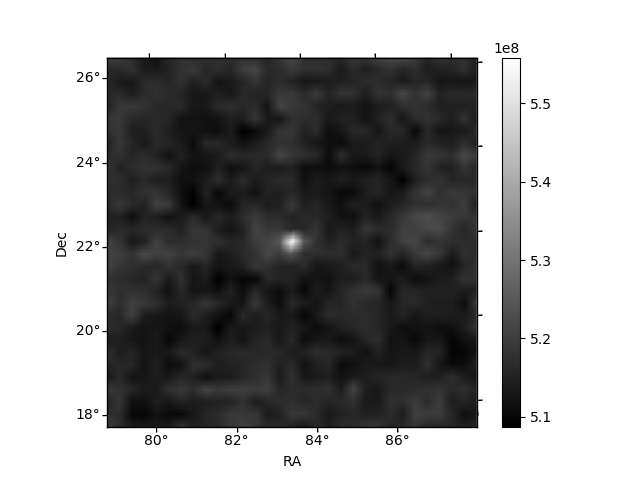
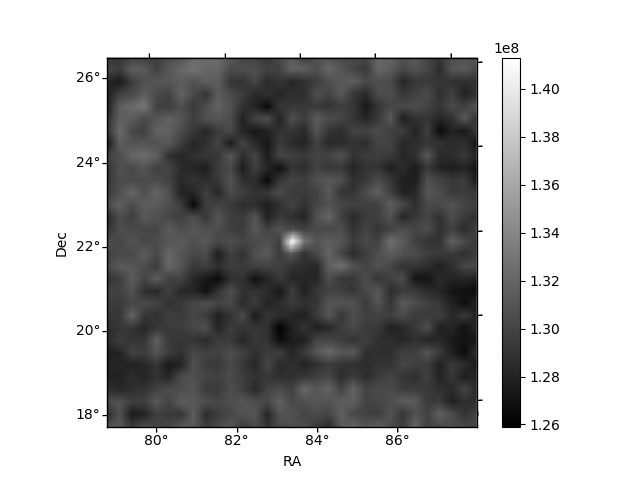
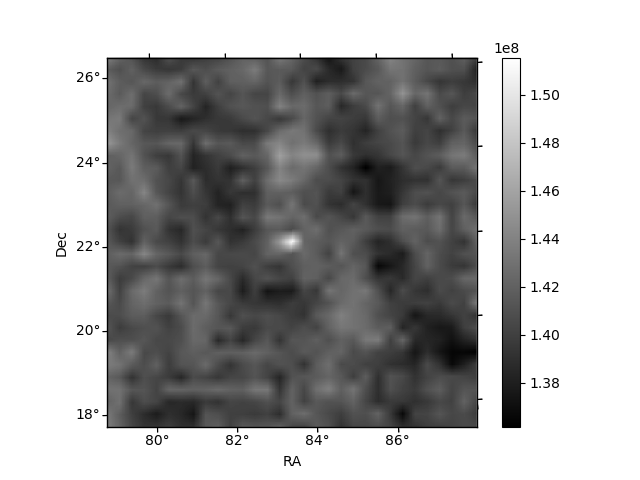
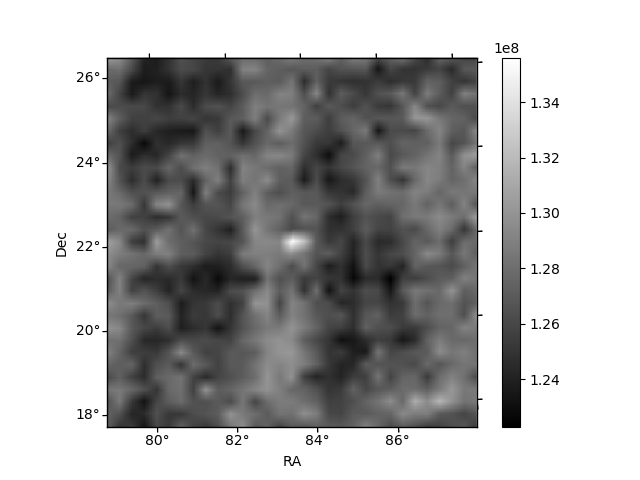
Histogram calculated using DETX and DETY for each event in the final _common_clean file
| Quadrant A | 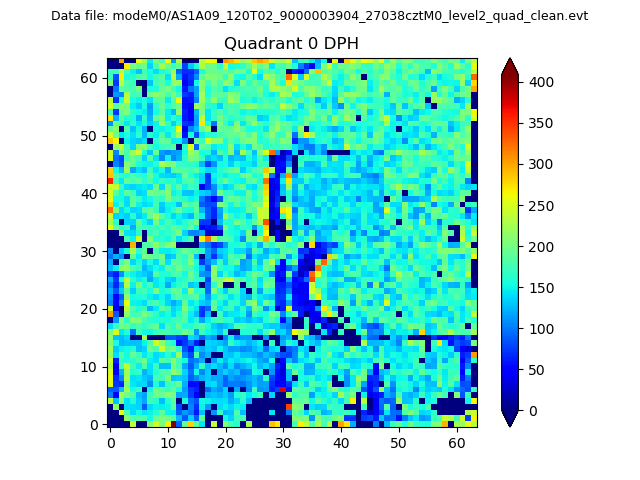 |
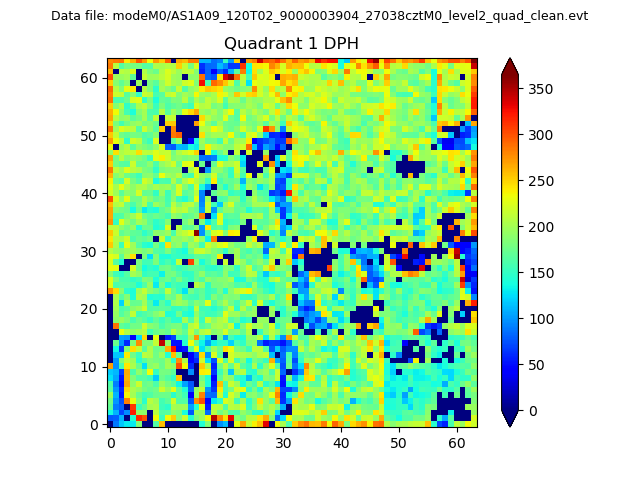 |
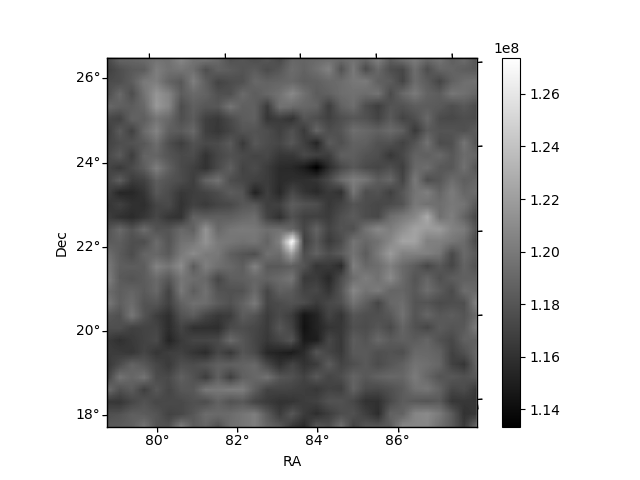
Quadrant B |
|---|---|---|---|
| Quadrant D | 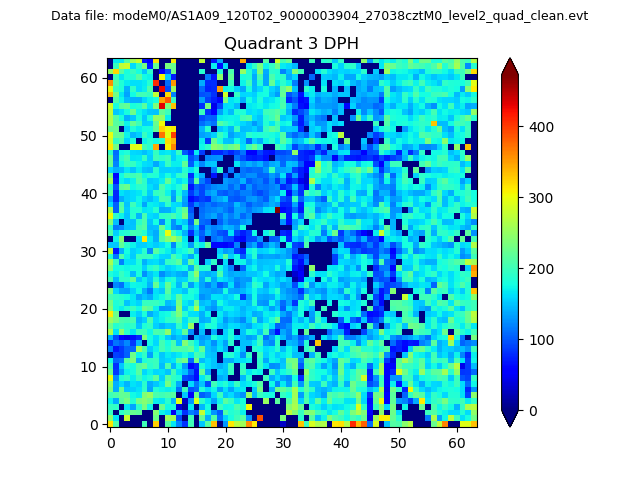 |
 |
Quadrant C |
| Plot type | Count rate plots | Images |
|---|---|---|
| Comparison with Poisson distribution Blue bars denote a histogram of data divided into 1 sec bins. Red curve is a Poisson curve with rate = median count rate of data. |
 |
 |
| Quadrant-wise count rates Data is divided into 100 sec bins |
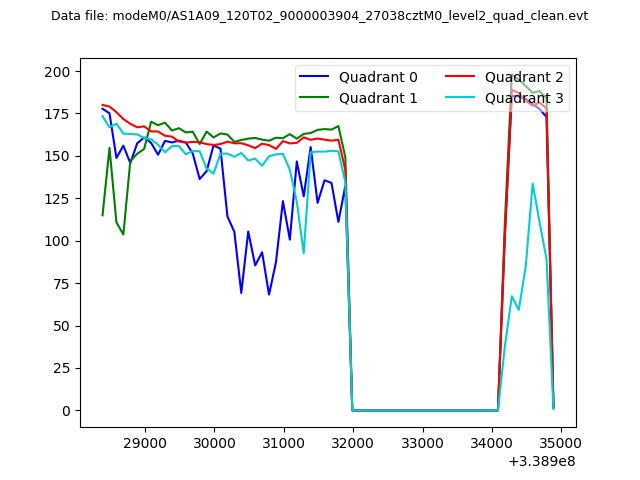 |
|
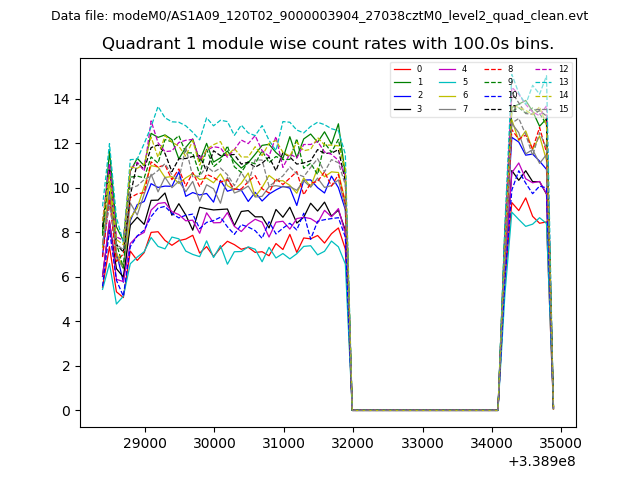
| Module-wise count rates for Quadrant A Data is divided into 100 sec bins |
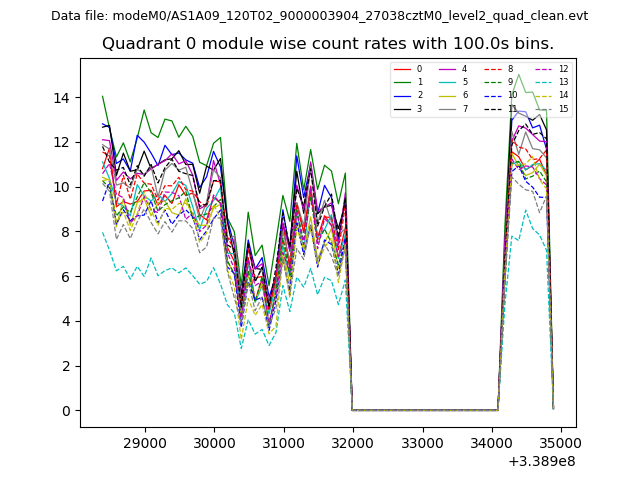 |
 |
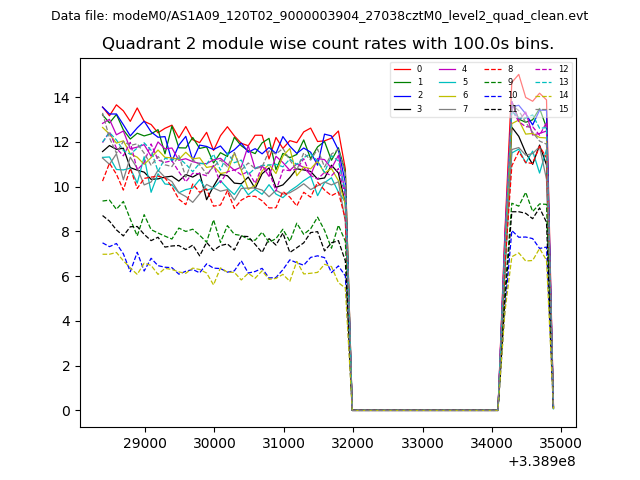
| Module-wise count rates for Quadrant B Data is divided into 100 sec bins |
 |
 |
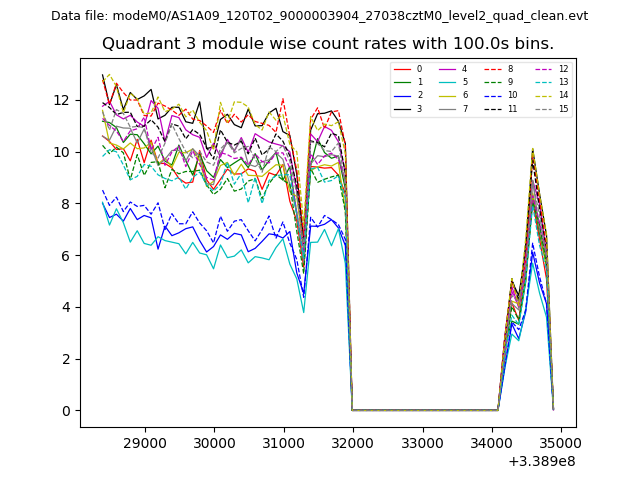
| Module-wise count rates for Quadrant C Data is divided into 100 sec bins |
 |
 |
| Module-wise count rates for Quadrant D Data is divided into 100 sec bins |
 |
 |
| Parameter | Plot |
|---|---|
| CZT HV Monitor | 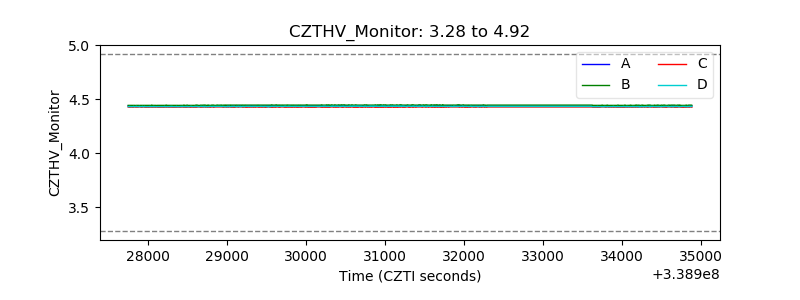 |
| D_VDD | 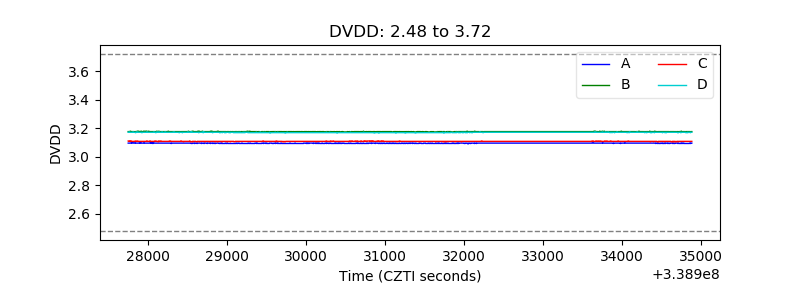 |
| Temperature 1 | 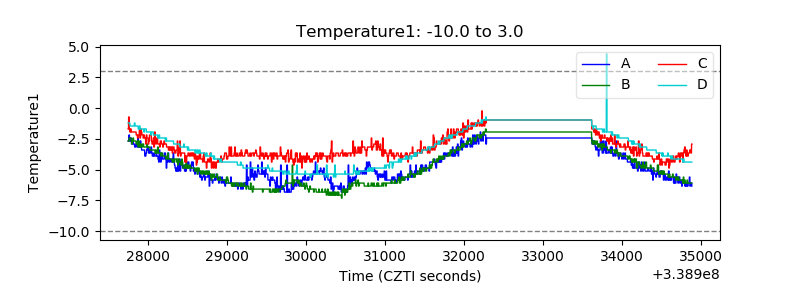 |
| Veto HV Monitor | 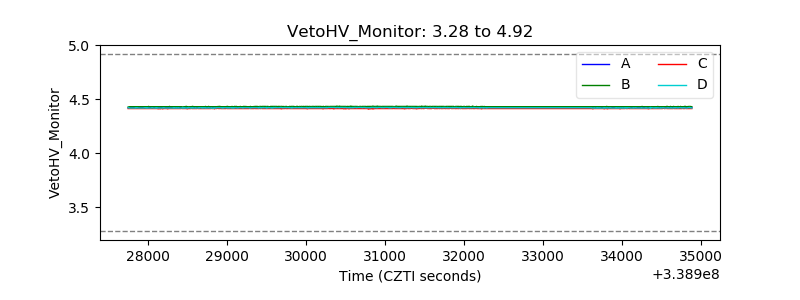 |
| Veto LLD | 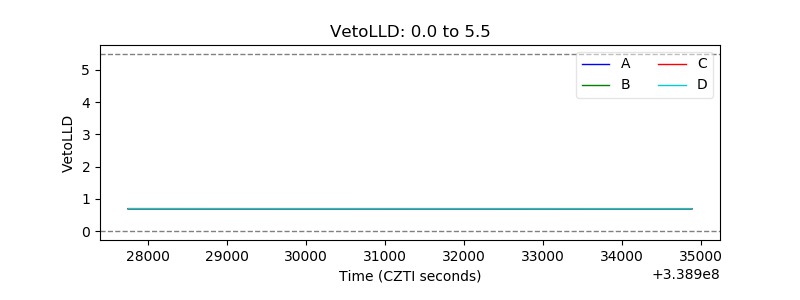 |
| Alpha Counter | 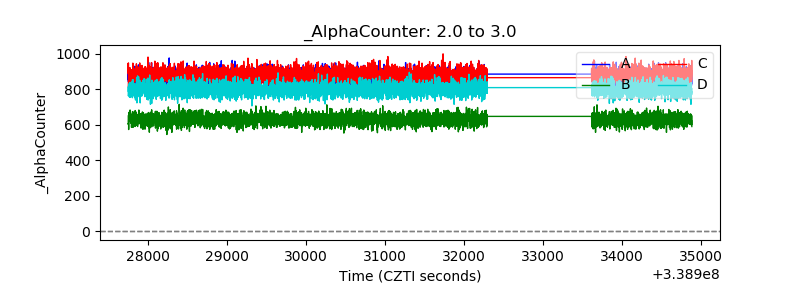 |
| _CPM_Rate | 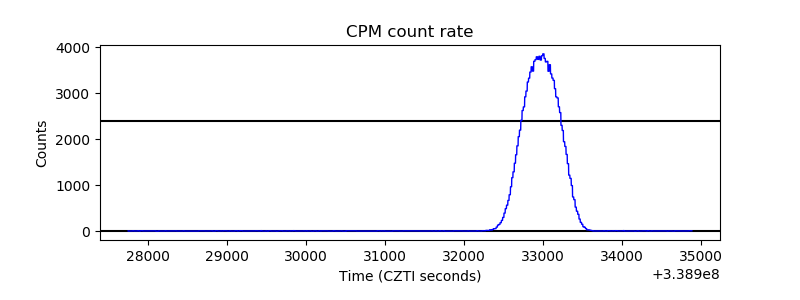 |
| CZT Counter | 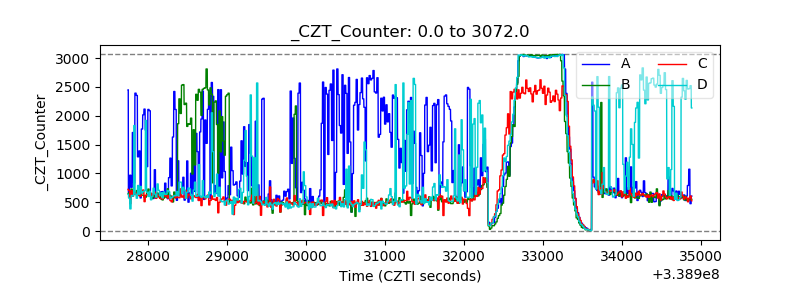 |
| +2.5 Volts monitor |  |
| +5 Volts monitor |  |
| _ROLL_ROT | 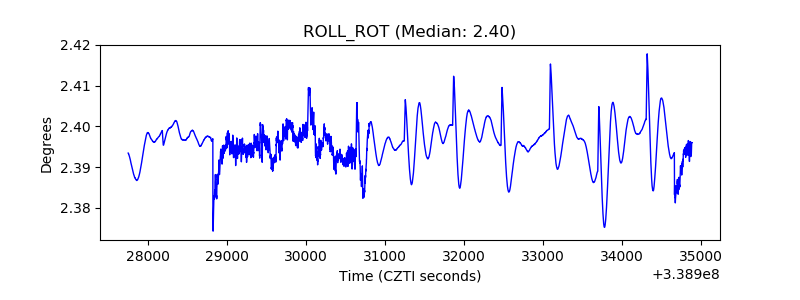 |
| _Roll_DEC | 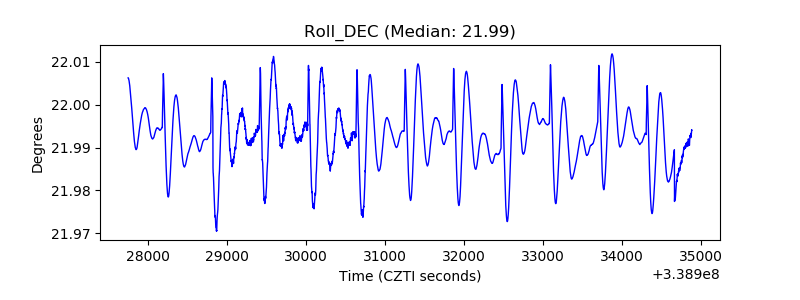 |
| _Roll_RA | 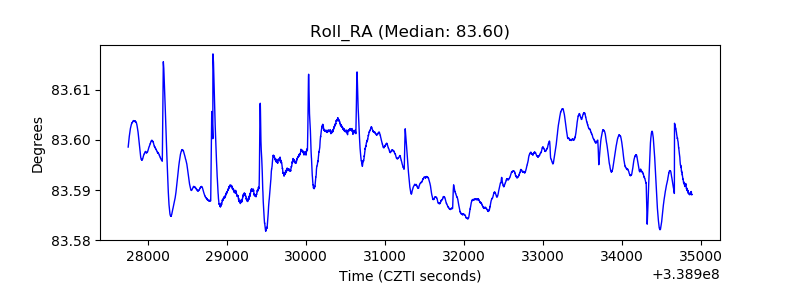 |
| Veto Counter | 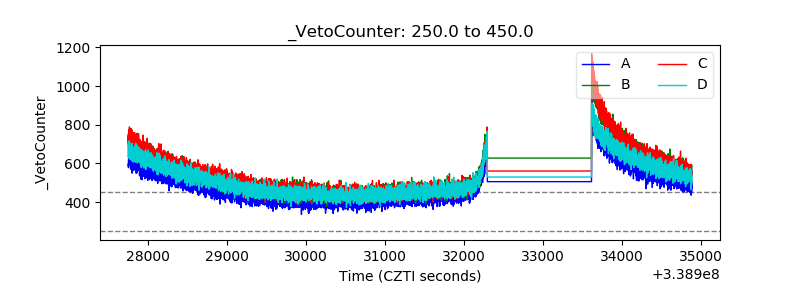 |