| Param | Original file | Final file |
|---|---|---|
| Filename | modeM0/AS1A09_120T02_9000003904_27039cztM0_level2.evt | modeM0/AS1A09_120T02_9000003904_27039cztM0_level2_quad_clean.evt |
| Size (bytes) | 663,384,960 | 111,651,840 |
| Size | 632.7 MB | 106.5 MB |
| Events in quadrant A | 6,005,195 | 733,499 |
| Events in quadrant B | 3,464,757 | 809,134 |
| Events in quadrant C | 3,491,653 | 777,615 |
| Events in quadrant D | 6,711,596 | 629,803 |
| Mode M9 | |||
|---|---|---|---|
| Quadrant | BADHDUFLAG | Total packets | Discarded packets |
| A | 0 | 18 | 0 |
| B | 0 | 19 | 0 |
| C | 0 | 19 | 0 |
| D | 0 | 19 | 0 |
| Mode M0 | |||
|---|---|---|---|
| Quadrant | BADHDUFLAG | Total packets | Discarded packets |
| A | 0 | 22079 | 0 |
| B | 0 | 14213 | 0 |
| C | 0 | 14304 | 0 |
| D | 0 | 23981 | 0 |
| Quadrant | Total seconds | Saturated seconds | Saturation percentage |
|---|---|---|---|
| A | 6168 | 1025 | 16.618029% |
| B | 6168 | 67 | 1.086252% |
| C | 6168 | 101 | 1.637484% |
| D | 6168 | 1564 | 25.356680% |
Noise dominated data is calculated using 1-second bins in cleaned event files. If a bin has >2000 counts, and if more than 50% of those come from <1% of pixels, then it is considered to be noise-dominated and hence unusable.
| Quadrant | # 1 sec bins | Bins with >0 counts | Bins with >2000 counts | High rate bins dominated by noise | Noise dominated (total time) | Noise dominated (detector-on time) | Marked lightcurve |
|---|---|---|---|---|---|---|---|
| A | 7513 | 6168 | 737 | 737 | 9.81% | 11.95% | 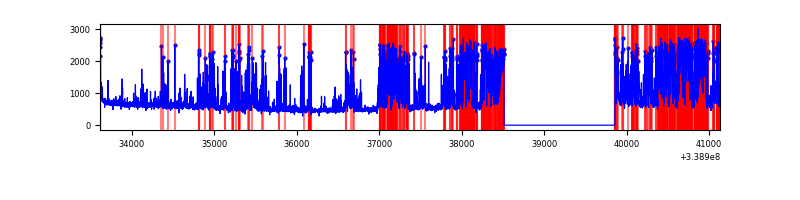 |
| B | 7513 | 6168 | 6 | 6 | 0.08% | 0.10% | 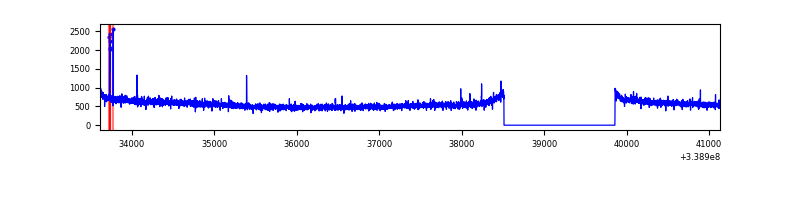 |
| C | 7513 | 6168 | 0 | 0 | 0.00% | 0.00% | 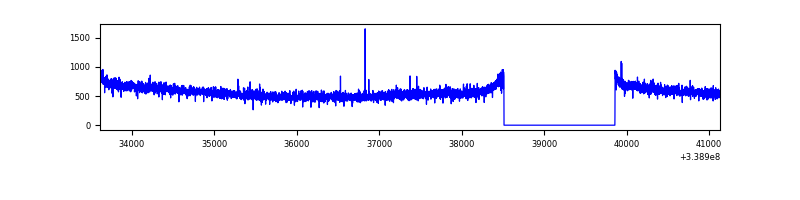 |
| D | 7513 | 6168 | 1522 | 1522 | 20.26% | 24.68% | 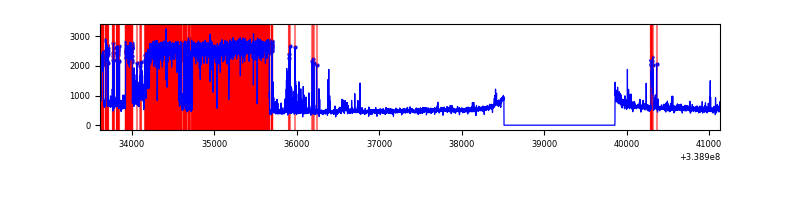 |
Top three noisy pixels from each quadrant. If the there are fewer than three noisy pixels in the level2.evt file, extra rows are filled as -1
| Pixel properties | Quadrant properties | ||||||
|---|---|---|---|---|---|---|---|
| Quadrant | DetID | PixID | Counts | Sigma | Mean | Median | Sigma |
| A | 14 | 235 | 2801878 | 17515.38 | 806 | 797 | 159.9 |
| A | 0 | 13 | 43124 | 264.67 | 806 | 797 | 159.9 |
| A | 8 | 192 | 28630 | 174.04 | 806 | 797 | 159.9 |
| B | 0 | 219 | 18526 | 107.57 | 877 | 860 | 164.2 |
| B | 12 | 111 | 18526 | 107.57 | 877 | 860 | 164.2 |
| B | 11 | 111 | 16654 | 96.17 | 877 | 860 | 164.2 |
| C | 14 | 238 | 139037 | 693.57 | 856 | 867 | 199.2 |
| C | 15 | 208 | 10727 | 49.49 | 856 | 867 | 199.2 |
| C | 14 | 67 | 7747 | 34.54 | 856 | 867 | 199.2 |
| D | 1 | 52 | 3698128 | 20635.97 | 755 | 738 | 179.2 |
| D | 2 | 250 | 126813 | 703.65 | 755 | 738 | 179.2 |
| D | 2 | 234 | 25015 | 135.5 | 755 | 738 | 179.2 |
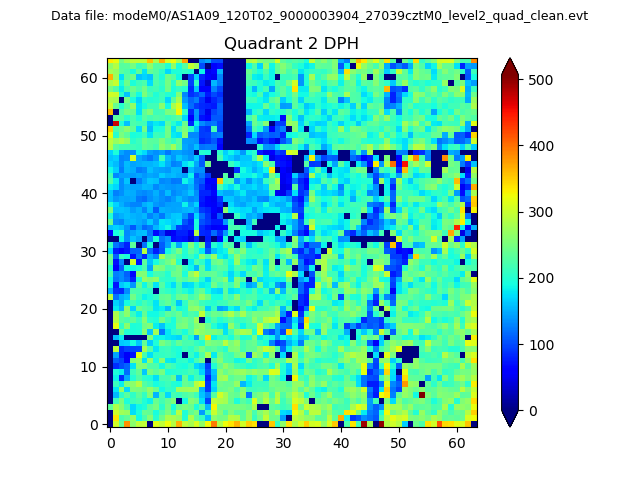
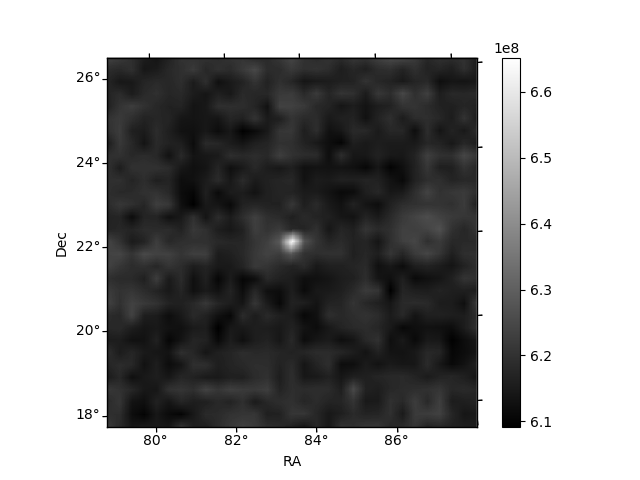
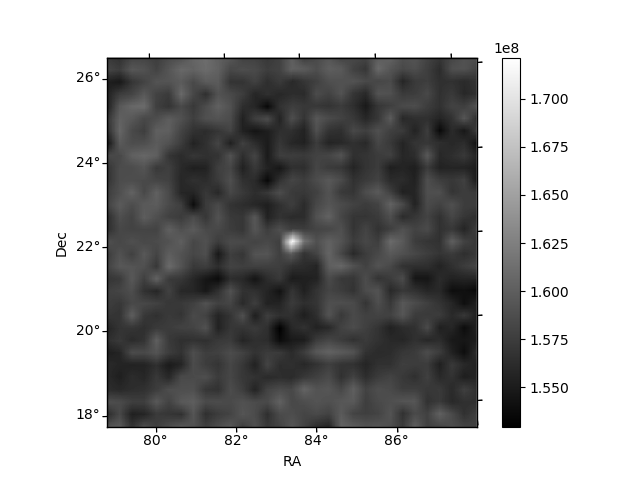
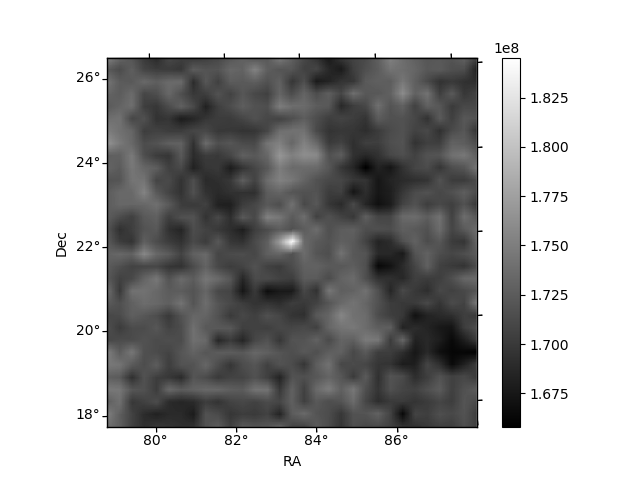
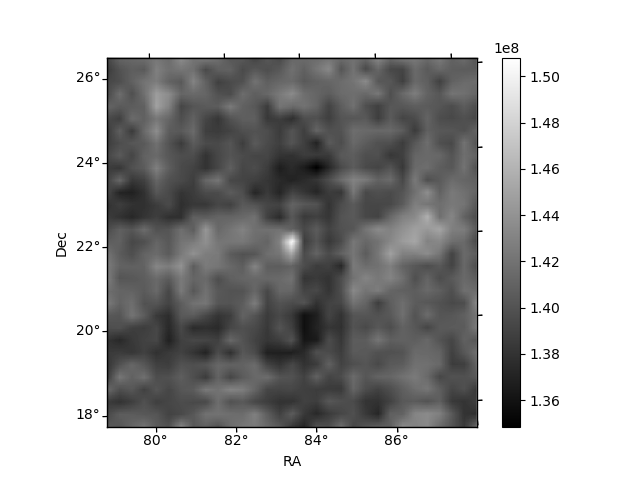
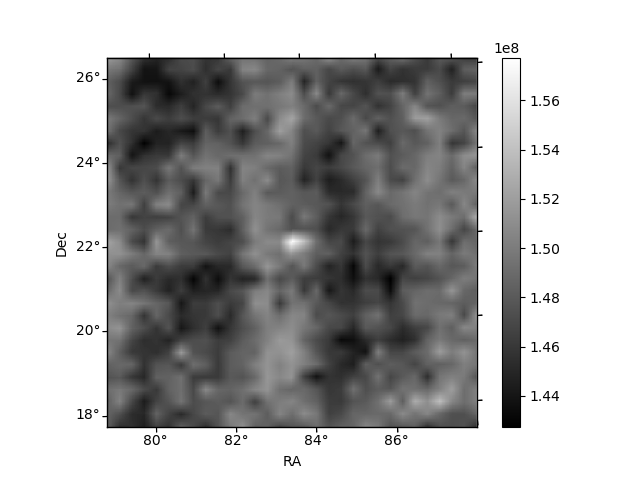
Histogram calculated using DETX and DETY for each event in the final _common_clean file
| Quadrant A | 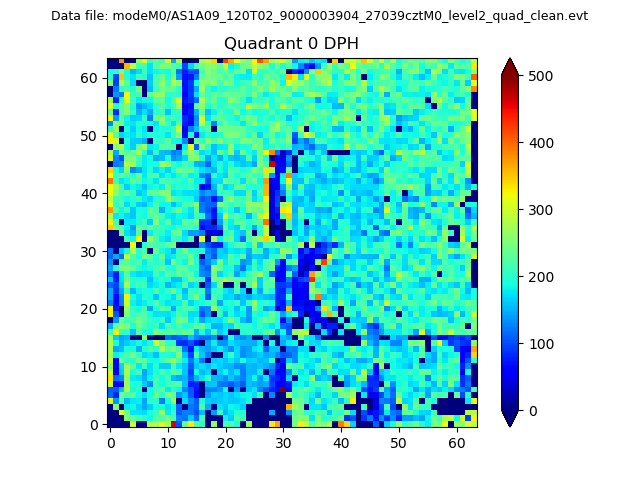 |
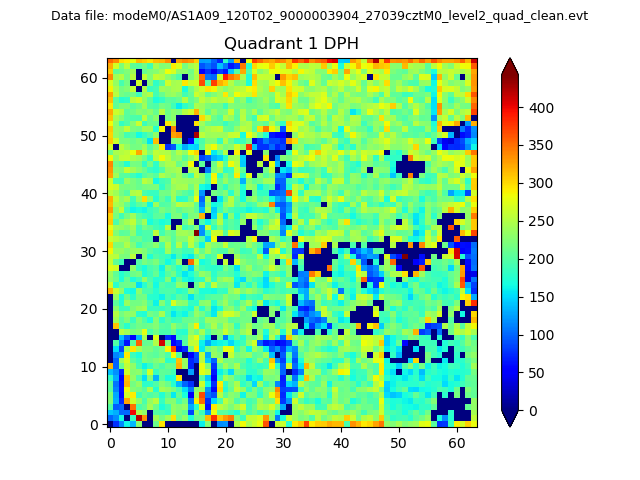 |
Quadrant B |
|---|---|---|---|
| Quadrant D | 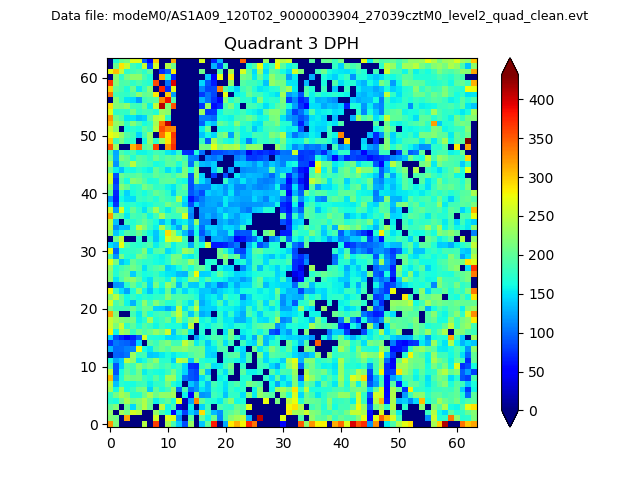 |
 |
Quadrant C |
| Plot type | Count rate plots | Images |
|---|---|---|
| Comparison with Poisson distribution Blue bars denote a histogram of data divided into 1 sec bins. Red curve is a Poisson curve with rate = median count rate of data. |
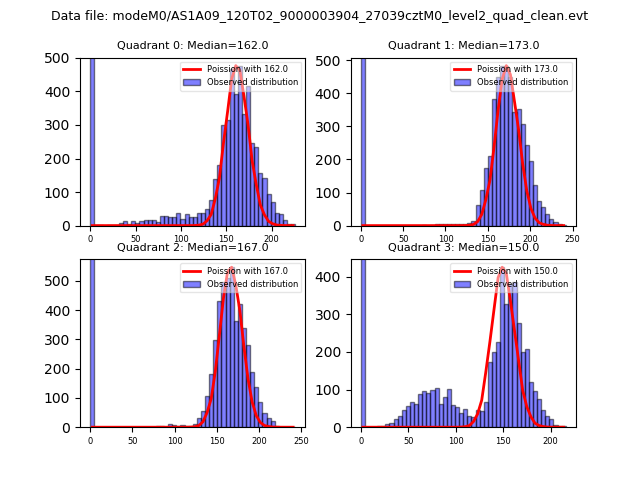 |
 |
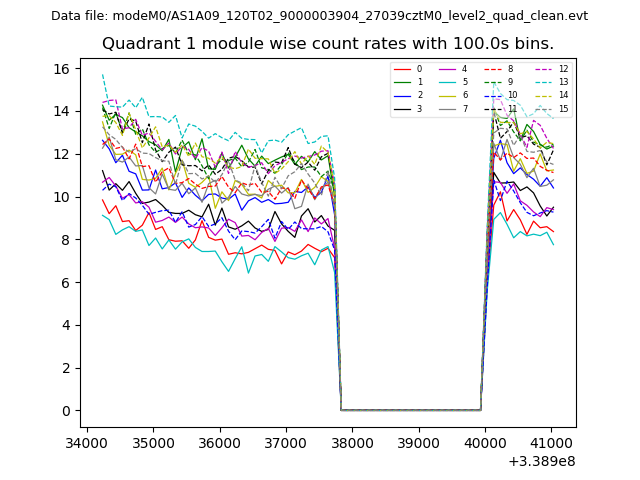
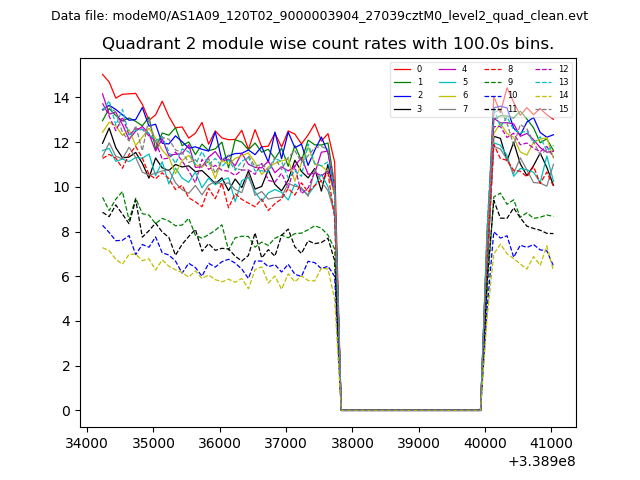
| Quadrant-wise count rates Data is divided into 100 sec bins |
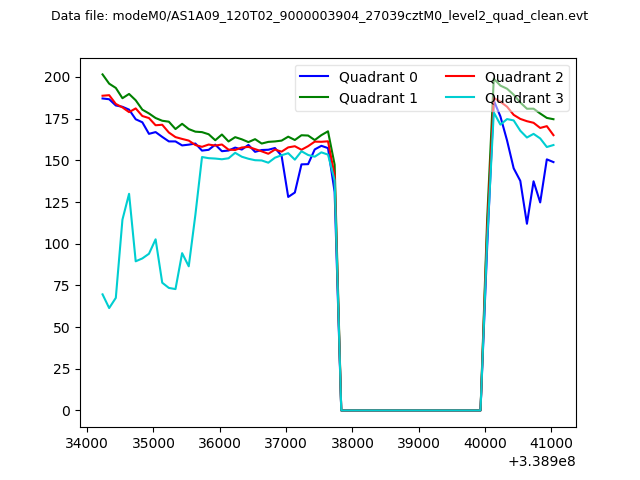 |
|
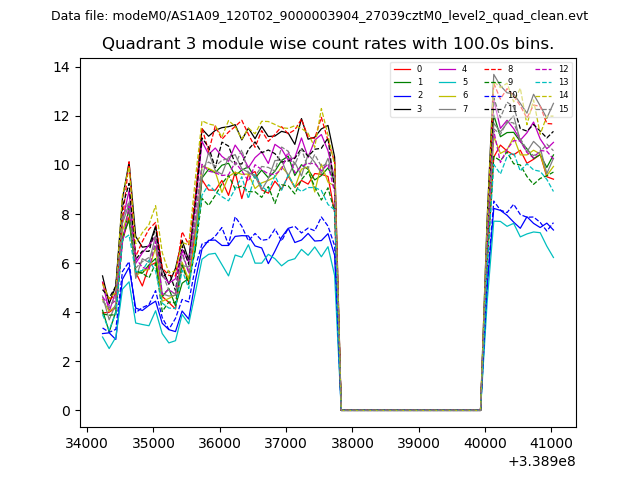
| Module-wise count rates for Quadrant A Data is divided into 100 sec bins |
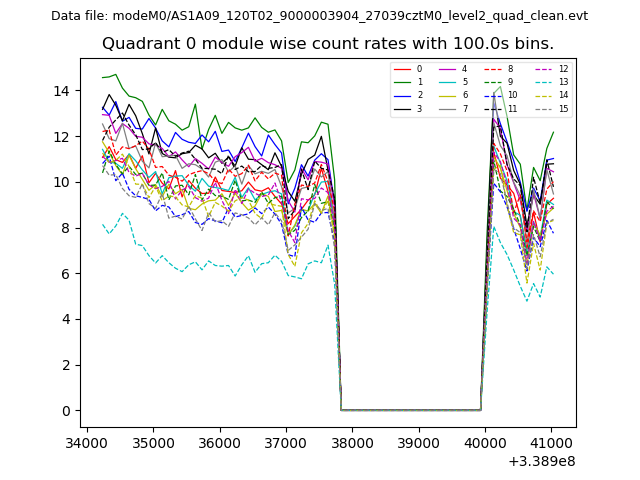 |
 |
| Module-wise count rates for Quadrant B Data is divided into 100 sec bins |
 |
 |
| Module-wise count rates for Quadrant C Data is divided into 100 sec bins |
 |
 |
| Module-wise count rates for Quadrant D Data is divided into 100 sec bins |
 |
 |
| Parameter | Plot |
|---|---|
| CZT HV Monitor | 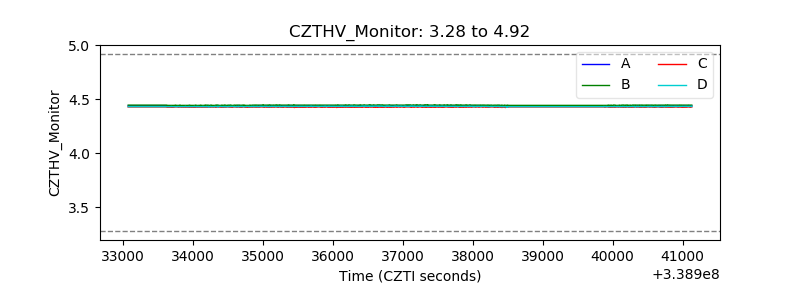 |
| D_VDD | 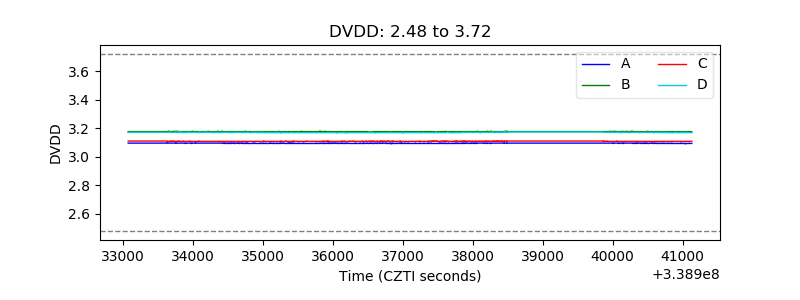 |
| Temperature 1 | 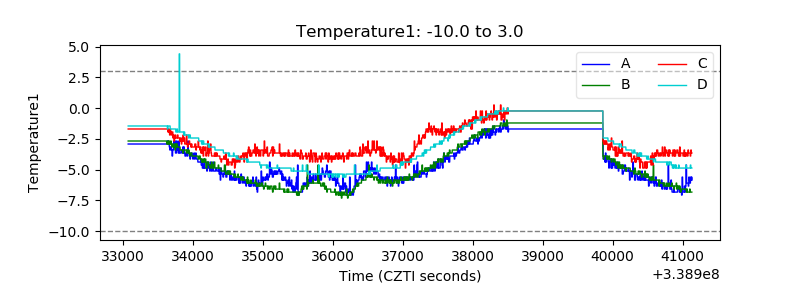 |
| Veto HV Monitor | 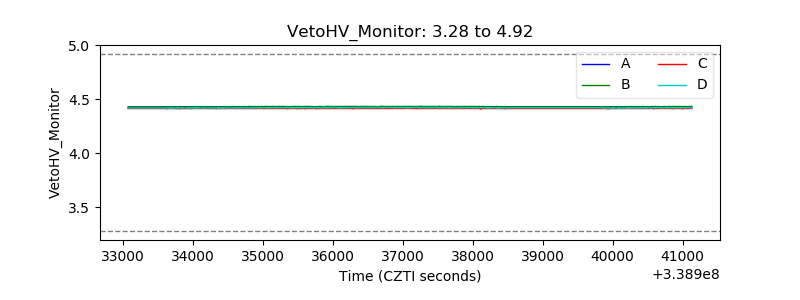 |
| Veto LLD | 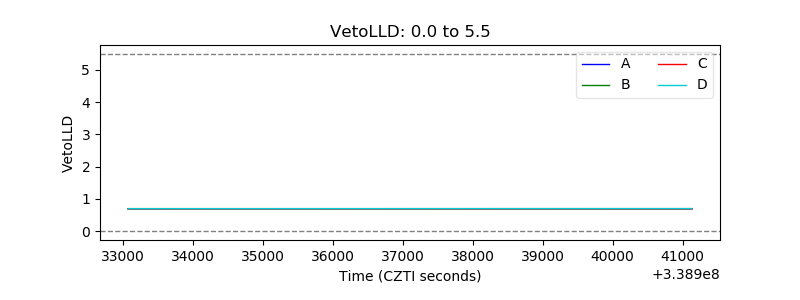 |
| Alpha Counter | 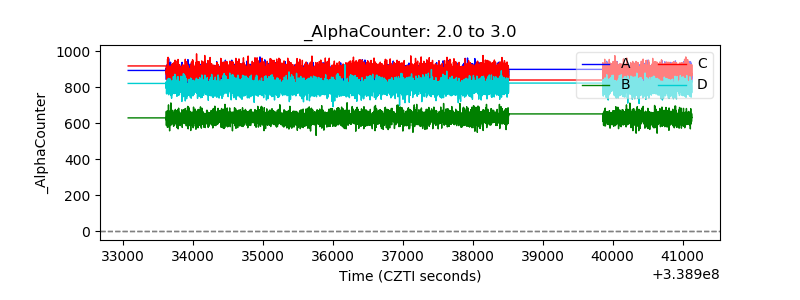 |
| _CPM_Rate | 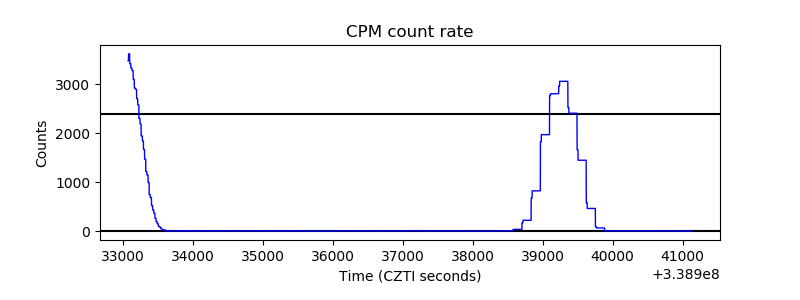 |
| CZT Counter | 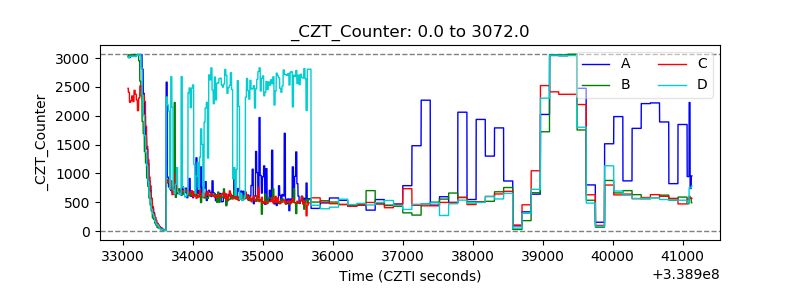 |
| +2.5 Volts monitor |  |
| +5 Volts monitor |  |
| _ROLL_ROT | 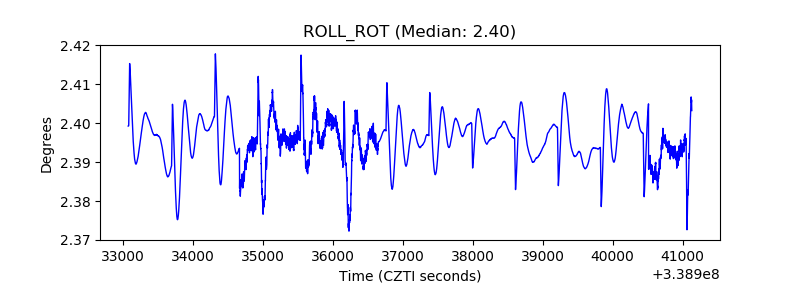 |
| _Roll_DEC | 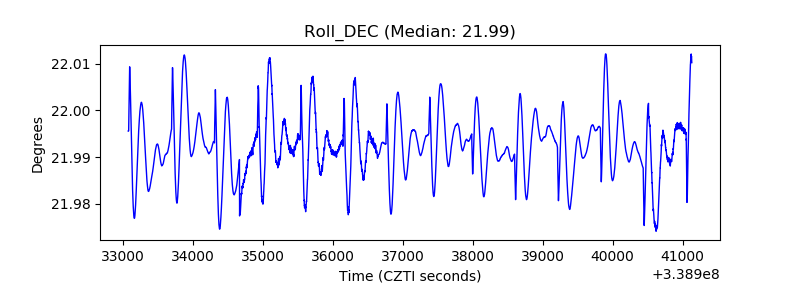 |
| _Roll_RA | 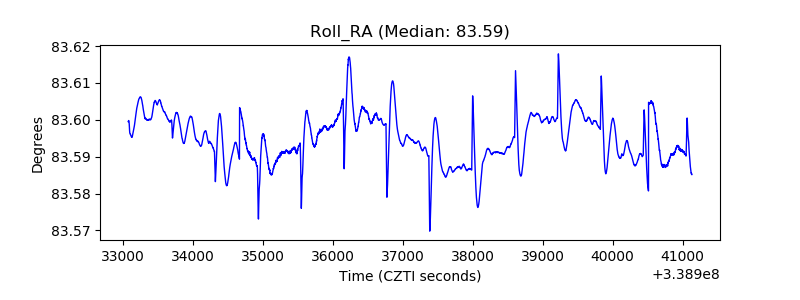 |
| Veto Counter | 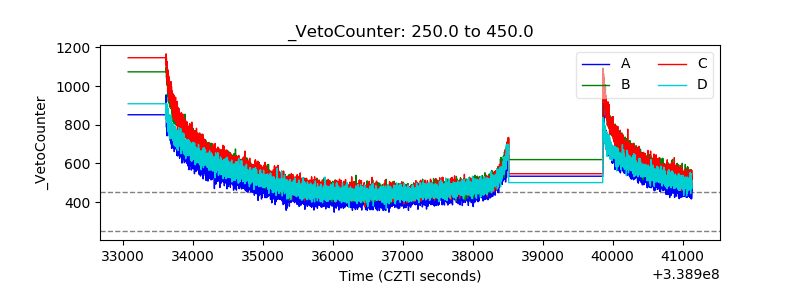 |