| Param | Original file | Final file |
|---|---|---|
| Filename | modeM0/AS1A09_120T02_9000003904_27040cztM0_level2.evt | modeM0/AS1A09_120T02_9000003904_27040cztM0_level2_quad_clean.evt |
| Size (bytes) | 637,600,320 | 116,559,360 |
| Size | 608.1 MB | 111.2 MB |
| Events in quadrant A | 8,278,379 | 689,052 |
| Events in quadrant B | 3,429,999 | 839,390 |
| Events in quadrant C | 3,483,094 | 798,173 |
| Events in quadrant D | 3,690,986 | 762,590 |
| Mode M9 | |||
|---|---|---|---|
| Quadrant | BADHDUFLAG | Total packets | Discarded packets |
| A | 0 | 15 | 0 |
| B | 0 | 16 | 0 |
| C | 0 | 16 | 0 |
| D | 0 | 16 | 0 |
| Mode M0 | |||
|---|---|---|---|
| Quadrant | BADHDUFLAG | Total packets | Discarded packets |
| A | 0 | 28930 | 0 |
| B | 0 | 14010 | 0 |
| C | 0 | 14211 | 0 |
| D | 0 | 15086 | 0 |
| Quadrant | Total seconds | Saturated seconds | Saturation percentage |
|---|---|---|---|
| A | 6311 | 1979 | 31.357946% |
| B | 6311 | 64 | 1.014102% |
| C | 6311 | 112 | 1.774679% |
| D | 6311 | 114 | 1.806370% |
Noise dominated data is calculated using 1-second bins in cleaned event files. If a bin has >2000 counts, and if more than 50% of those come from <1% of pixels, then it is considered to be noise-dominated and hence unusable.
| Quadrant | # 1 sec bins | Bins with >0 counts | Bins with >2000 counts | High rate bins dominated by noise | Noise dominated (total time) | Noise dominated (detector-on time) | Marked lightcurve |
|---|---|---|---|---|---|---|---|
| A | 7590 | 6310 | 1614 | 1614 | 21.26% | 25.58% | 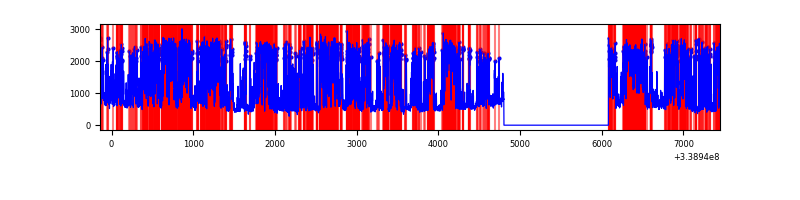 |
| B | 7591 | 6312 | 4 | 4 | 0.05% | 0.06% | 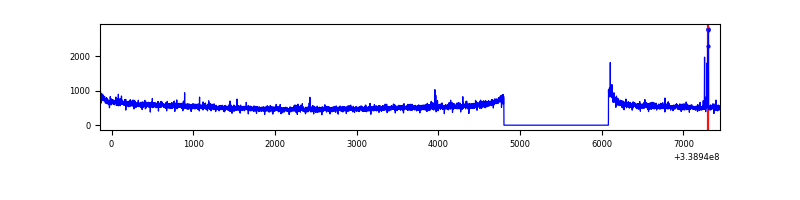 |
| C | 7591 | 6312 | 21 | 21 | 0.28% | 0.33% | 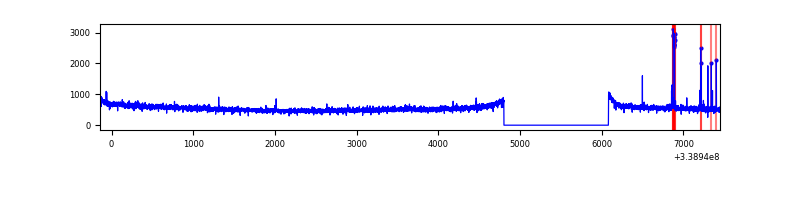 |
| D | 7591 | 6311 | 85 | 85 | 1.12% | 1.35% | 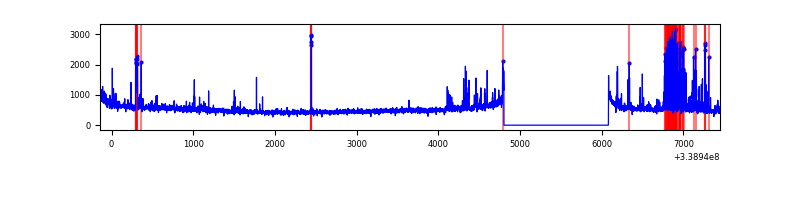 |
Top three noisy pixels from each quadrant. If the there are fewer than three noisy pixels in the level2.evt file, extra rows are filled as -1
| Pixel properties | Quadrant properties | ||||||
|---|---|---|---|---|---|---|---|
| Quadrant | DetID | PixID | Counts | Sigma | Mean | Median | Sigma |
| A | 14 | 235 | 5300368 | 35310.57 | 750 | 740 | 150.1 |
| A | 6 | 16 | 40110 | 262.32 | 750 | 740 | 150.1 |
| A | 8 | 192 | 25752 | 166.65 | 750 | 740 | 150.1 |
| B | 15 | 33 | 28853 | 172.13 | 865 | 850 | 162.7 |
| B | 0 | 219 | 23052 | 136.47 | 865 | 850 | 162.7 |
| B | 12 | 111 | 18672 | 109.55 | 865 | 850 | 162.7 |
| C | 14 | 238 | 134721 | 682.29 | 838 | 848 | 196.2 |
| C | 2 | 16 | 78376 | 395.13 | 838 | 848 | 196.2 |
| C | 13 | 61 | 5700 | 24.73 | 838 | 848 | 196.2 |
| D | 5 | 222 | 342302 | 1736.26 | 827 | 810 | 196.7 |
| D | 2 | 250 | 122880 | 620.64 | 827 | 810 | 196.7 |
| D | 1 | 52 | 72563 | 364.82 | 827 | 810 | 196.7 |
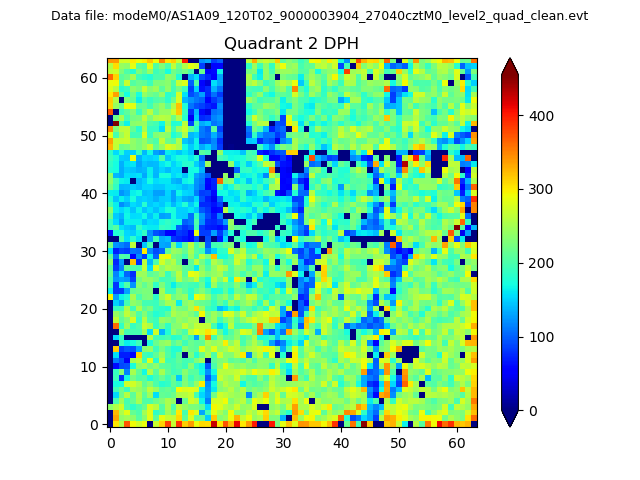
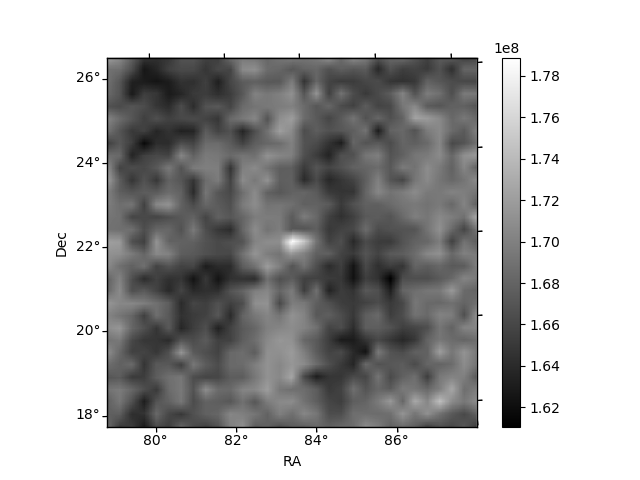
Histogram calculated using DETX and DETY for each event in the final _common_clean file
| Quadrant A | 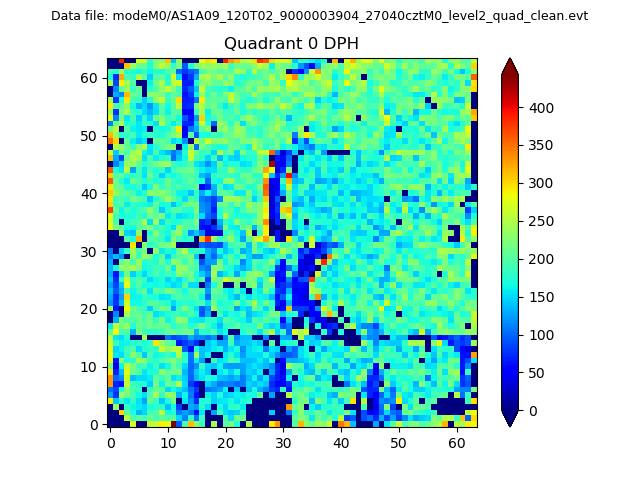 |
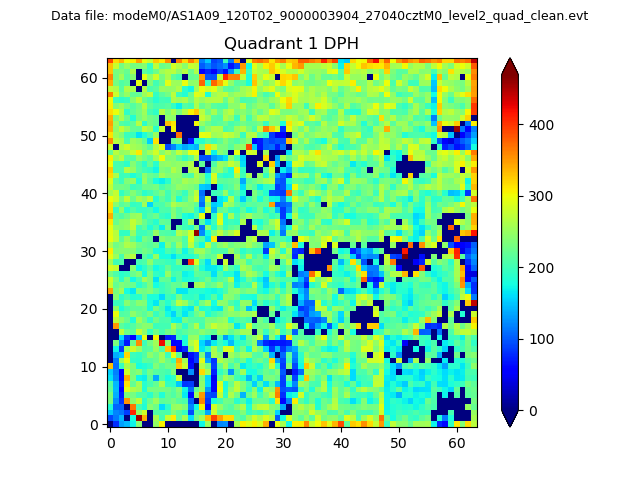 |
Quadrant B |
|---|---|---|---|
| Quadrant D | 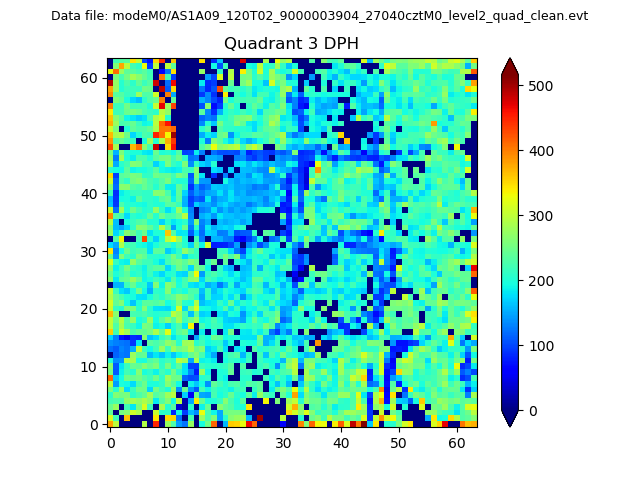 |
 |
Quadrant C |
| Plot type | Count rate plots | Images |
|---|---|---|
| Comparison with Poisson distribution Blue bars denote a histogram of data divided into 1 sec bins. Red curve is a Poisson curve with rate = median count rate of data. |
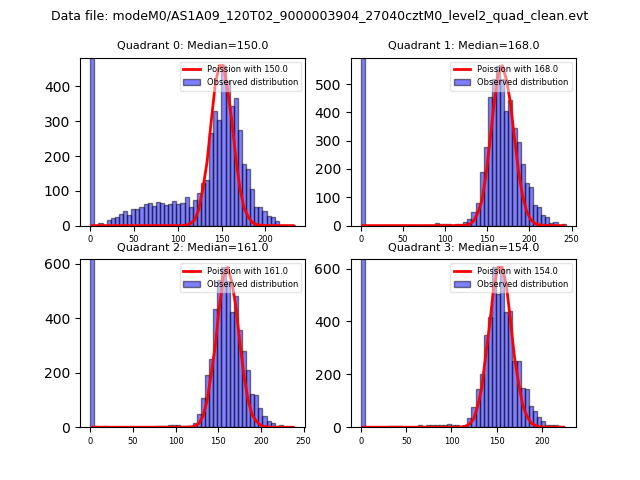 |
 |
| Quadrant-wise count rates Data is divided into 100 sec bins |
 |
|
| Module-wise count rates for Quadrant A Data is divided into 100 sec bins |
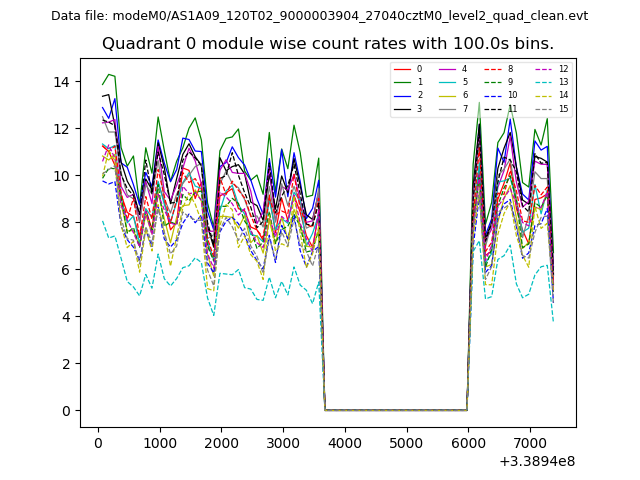 |
 |
| Module-wise count rates for Quadrant B Data is divided into 100 sec bins |
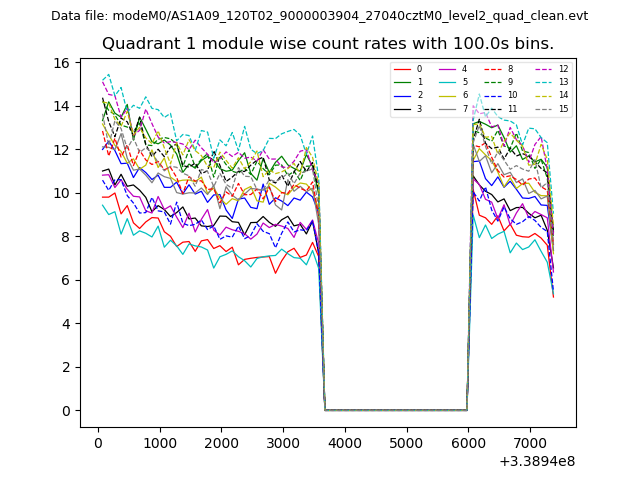 |
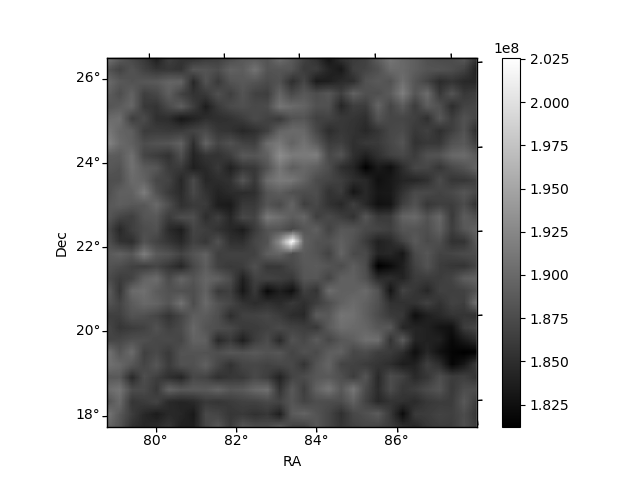 |
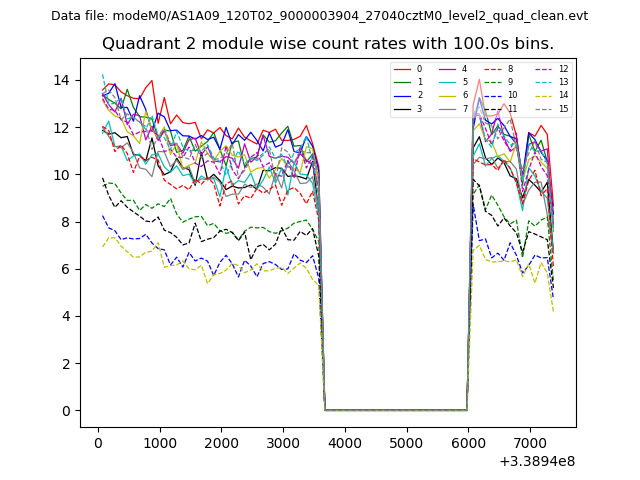
| Module-wise count rates for Quadrant C Data is divided into 100 sec bins |
 |
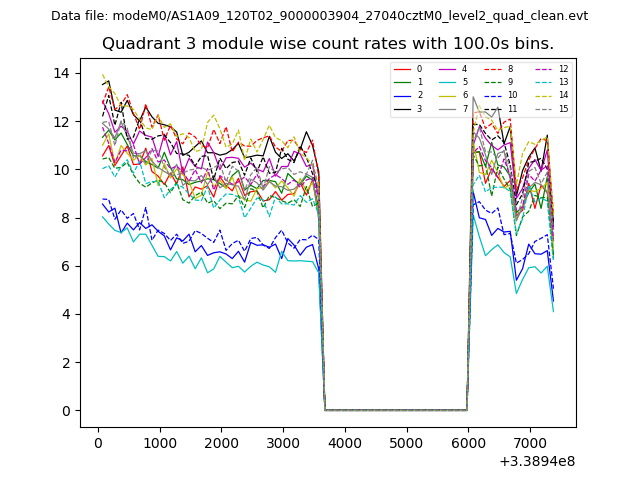
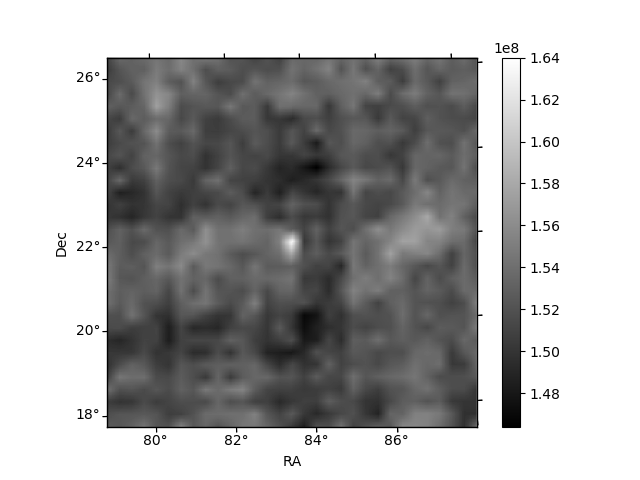 |
| Module-wise count rates for Quadrant D Data is divided into 100 sec bins |
 |
 |
| Parameter | Plot |
|---|---|
| CZT HV Monitor | 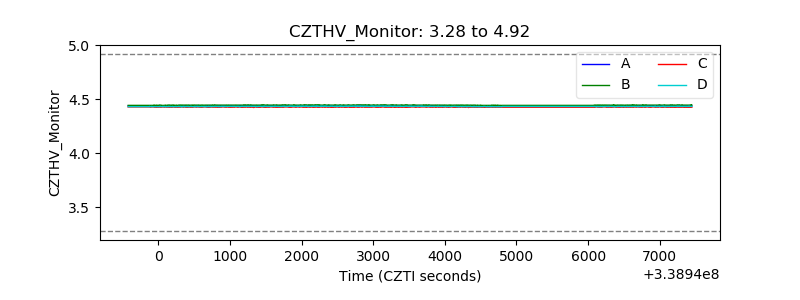 |
| D_VDD | 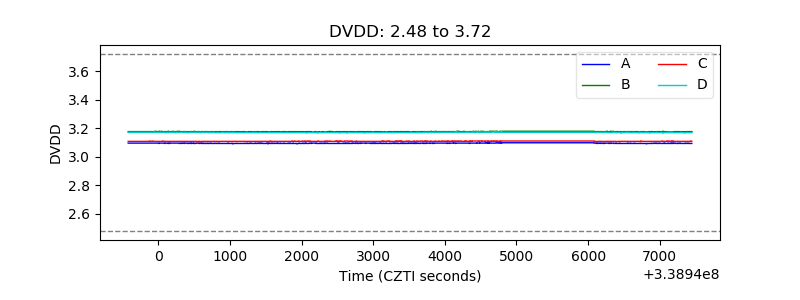 |
| Temperature 1 | 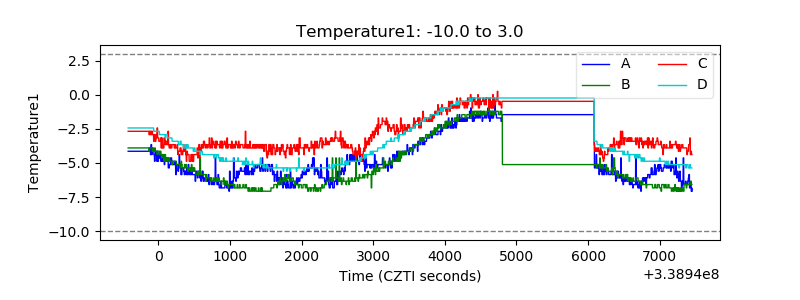 |
| Veto HV Monitor | 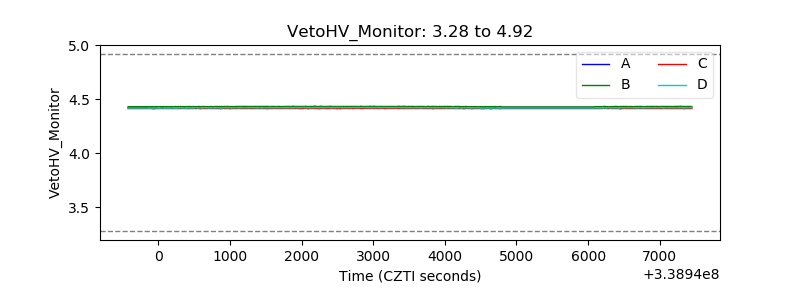 |
| Veto LLD | 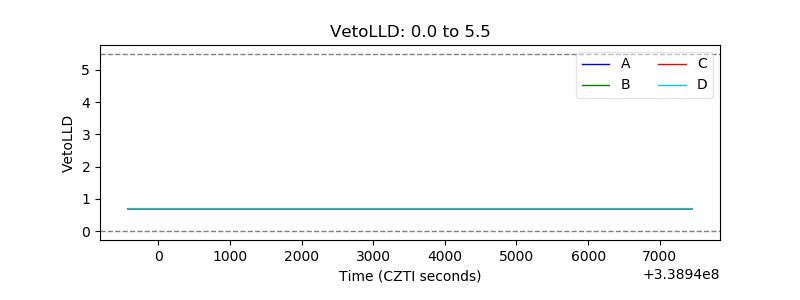 |
| Alpha Counter | 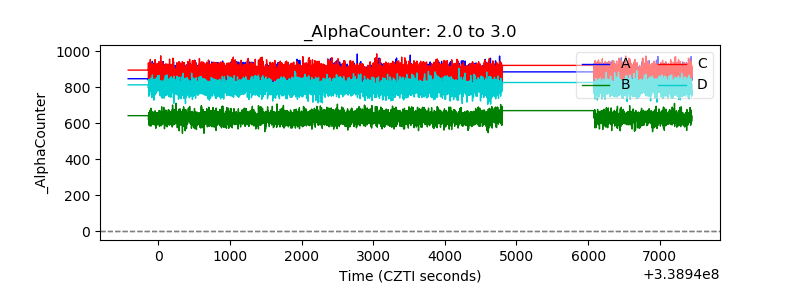 |
| _CPM_Rate | 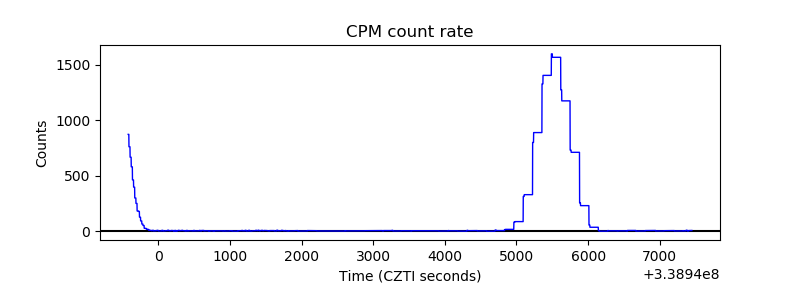 |
| CZT Counter |  |
| +2.5 Volts monitor |  |
| +5 Volts monitor |  |
| _ROLL_ROT | 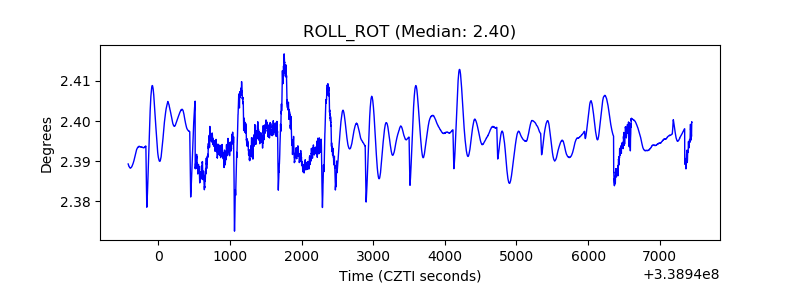 |
| _Roll_DEC | 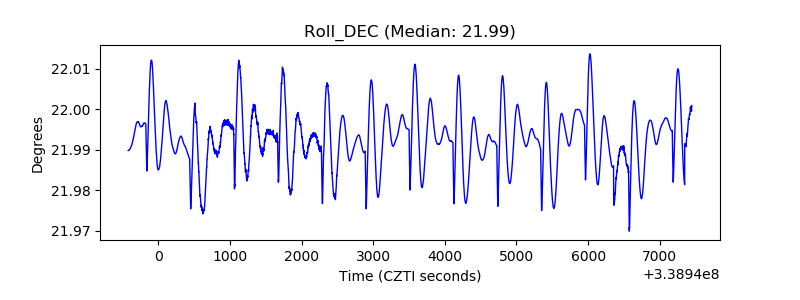 |
| _Roll_RA | 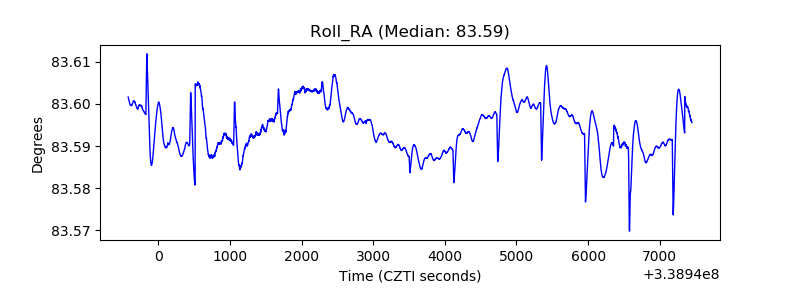 |
| Veto Counter | 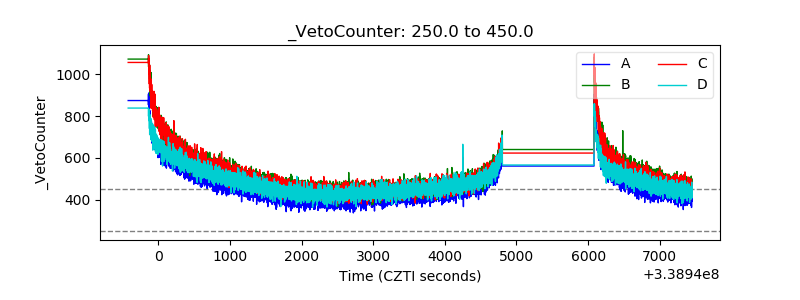 |