| Param | Original file | Final file |
|---|---|---|
| Filename | modeM0/AS1A09_120T02_9000003904_27041cztM0_level2.evt | modeM0/AS1A09_120T02_9000003904_27041cztM0_level2_quad_clean.evt |
| Size (bytes) | 627,779,520 | 107,222,400 |
| Size | 598.7 MB | 102.3 MB |
| Events in quadrant A | 7,952,263 | 619,342 |
| Events in quadrant B | 3,420,308 | 761,086 |
| Events in quadrant C | 3,574,594 | 721,537 |
| Events in quadrant D | 3,625,155 | 691,944 |
| Mode M9 | |||
|---|---|---|---|
| Quadrant | BADHDUFLAG | Total packets | Discarded packets |
| A | 0 | 12 | 0 |
| B | 0 | 13 | 0 |
| C | 0 | 13 | 0 |
| D | 0 | 13 | 0 |
| Mode M0 | |||
|---|---|---|---|
| Quadrant | BADHDUFLAG | Total packets | Discarded packets |
| A | 0 | 28006 | 0 |
| B | 0 | 14062 | 0 |
| C | 0 | 14584 | 0 |
| D | 0 | 15041 | 0 |
| Quadrant | Total seconds | Saturated seconds | Saturation percentage |
|---|---|---|---|
| A | 6498 | 1990 | 30.624808% |
| B | 6498 | 73 | 1.123423% |
| C | 6498 | 178 | 2.739304% |
| D | 6497 | 90 | 1.385255% |
Noise dominated data is calculated using 1-second bins in cleaned event files. If a bin has >2000 counts, and if more than 50% of those come from <1% of pixels, then it is considered to be noise-dominated and hence unusable.
| Quadrant | # 1 sec bins | Bins with >0 counts | Bins with >2000 counts | High rate bins dominated by noise | Noise dominated (total time) | Noise dominated (detector-on time) | Marked lightcurve |
|---|---|---|---|---|---|---|---|
| A | 7568 | 6499 | 1614 | 1614 | 21.33% | 24.83% | 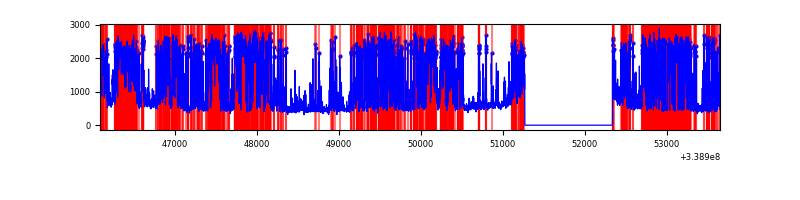 |
| B | 7568 | 6498 | 5 | 5 | 0.07% | 0.08% | 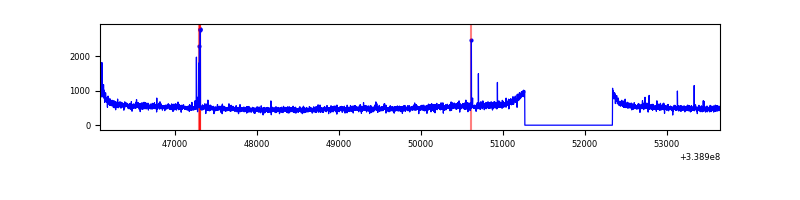 |
| C | 7568 | 6499 | 36 | 36 | 0.48% | 0.55% | 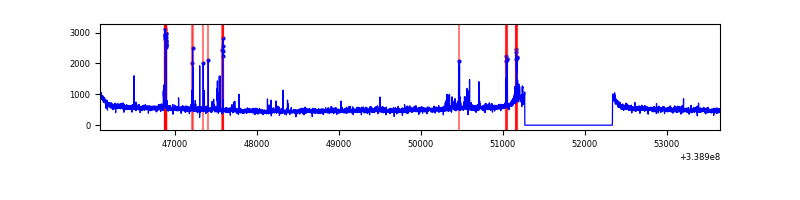 |
| D | 7567 | 6497 | 78 | 78 | 1.03% | 1.20% | 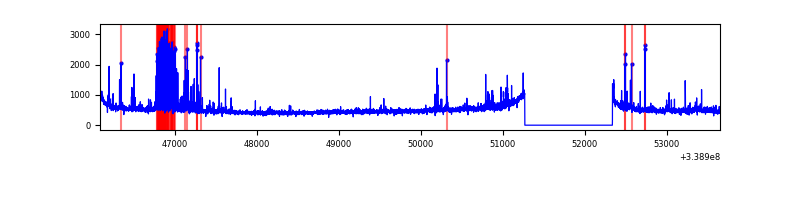 |
Top three noisy pixels from each quadrant. If the there are fewer than three noisy pixels in the level2.evt file, extra rows are filled as -1
| Pixel properties | Quadrant properties | ||||||
|---|---|---|---|---|---|---|---|
| Quadrant | DetID | PixID | Counts | Sigma | Mean | Median | Sigma |
| A | 14 | 235 | 5049568 | 33799.94 | 744 | 734 | 149.4 |
| A | 8 | 192 | 26509 | 172.55 | 744 | 734 | 149.4 |
| A | 0 | 13 | 9719 | 60.15 | 744 | 734 | 149.4 |
| B | 15 | 33 | 32293 | 190.54 | 860 | 844 | 165.1 |
| B | 12 | 111 | 19291 | 111.76 | 860 | 844 | 165.1 |
| B | 11 | 111 | 17197 | 99.08 | 860 | 844 | 165.1 |
| C | 2 | 16 | 213403 | 1087.32 | 828 | 834 | 195.5 |
| C | 14 | 238 | 133535 | 678.78 | 828 | 834 | 195.5 |
| C | 13 | 61 | 5636 | 24.56 | 828 | 834 | 195.5 |
| D | 5 | 222 | 321088 | 1602.23 | 828 | 809 | 199.9 |
| D | 2 | 250 | 74188 | 367.09 | 828 | 809 | 199.9 |
| D | 1 | 52 | 68131 | 336.79 | 828 | 809 | 199.9 |
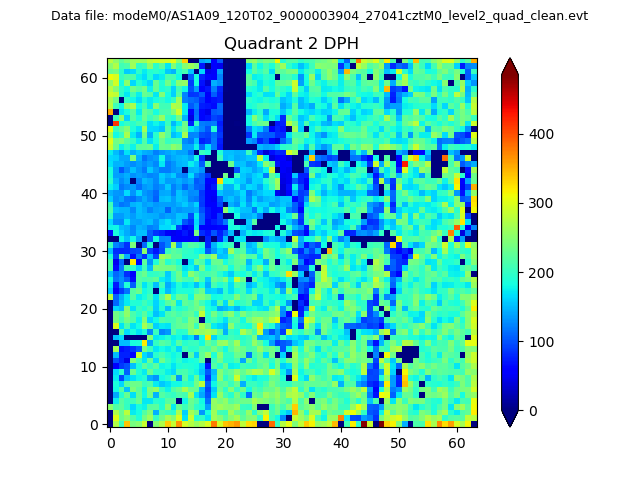
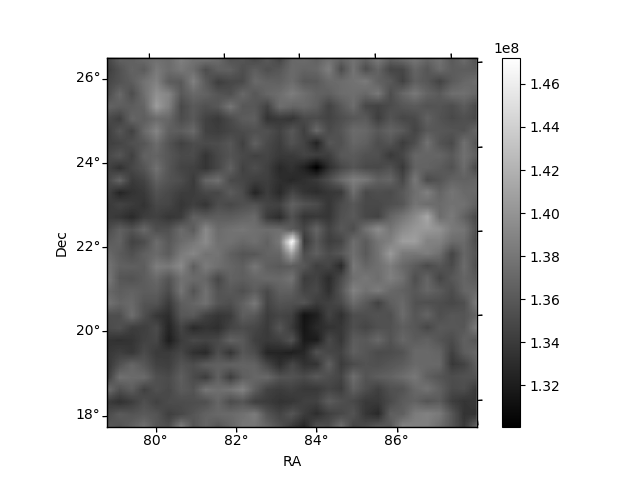
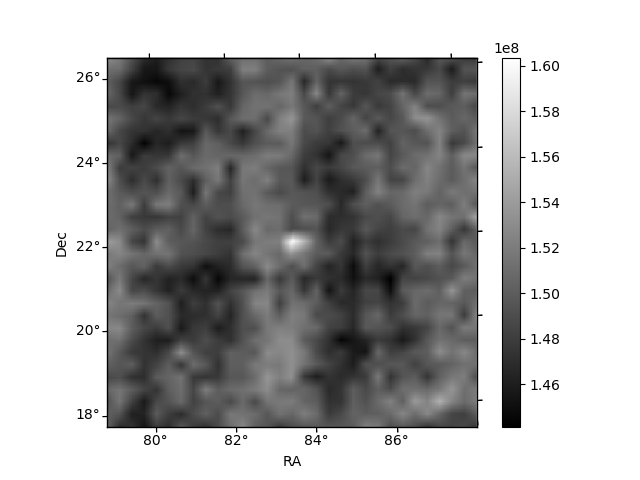
Histogram calculated using DETX and DETY for each event in the final _common_clean file
| Quadrant A | 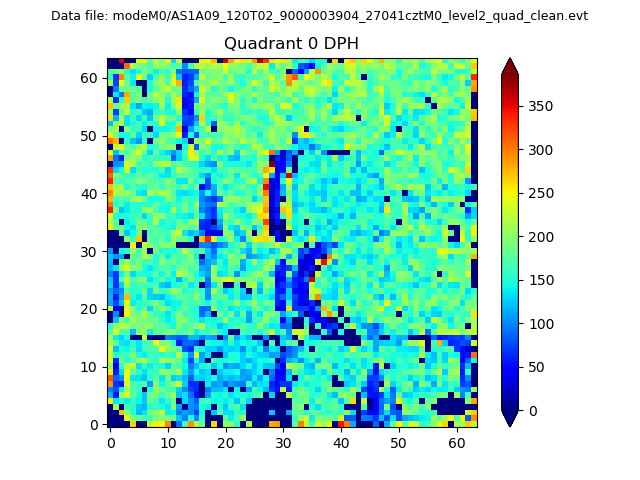 |
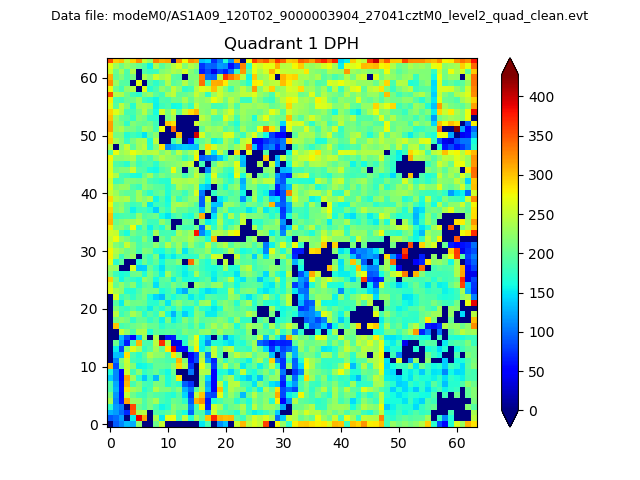 |
Quadrant B |
|---|---|---|---|
| Quadrant D | 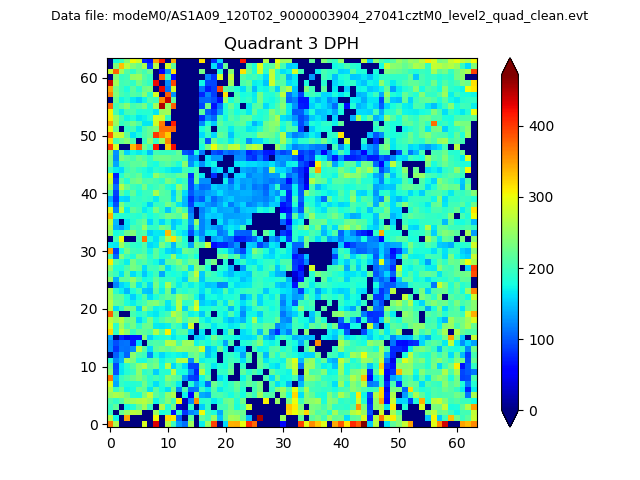 |
 |
Quadrant C |
| Plot type | Count rate plots | Images |
|---|---|---|
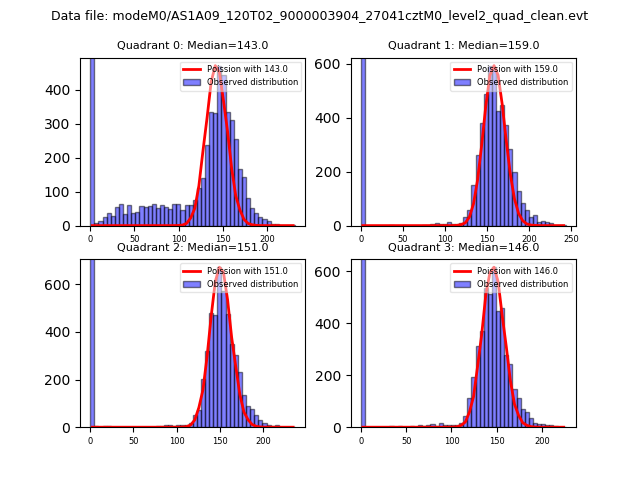
| Comparison with Poisson distribution Blue bars denote a histogram of data divided into 1 sec bins. Red curve is a Poisson curve with rate = median count rate of data. |
 |
 |
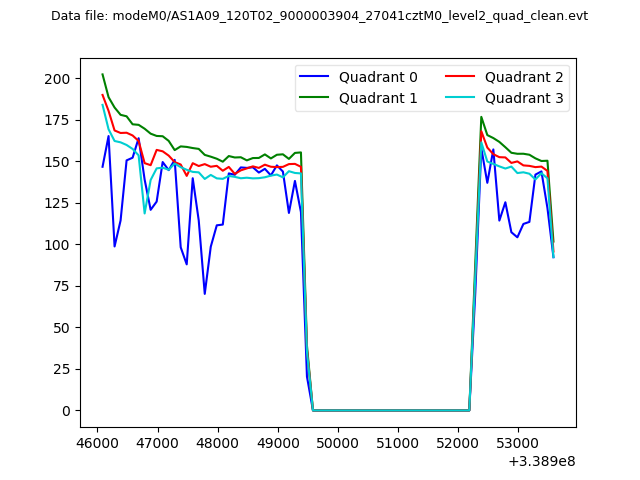
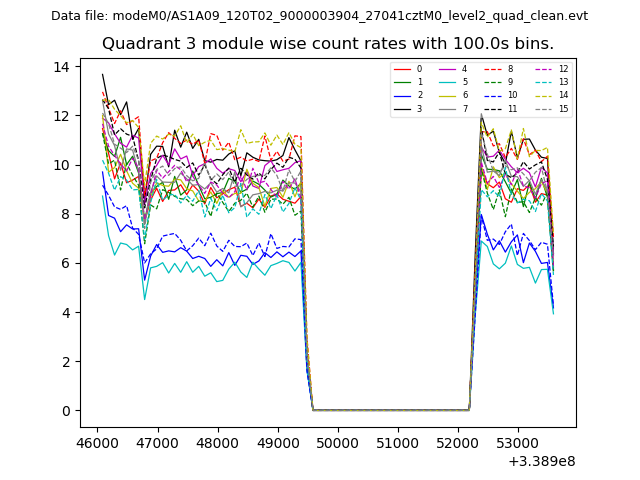
| Quadrant-wise count rates Data is divided into 100 sec bins |
 |
|
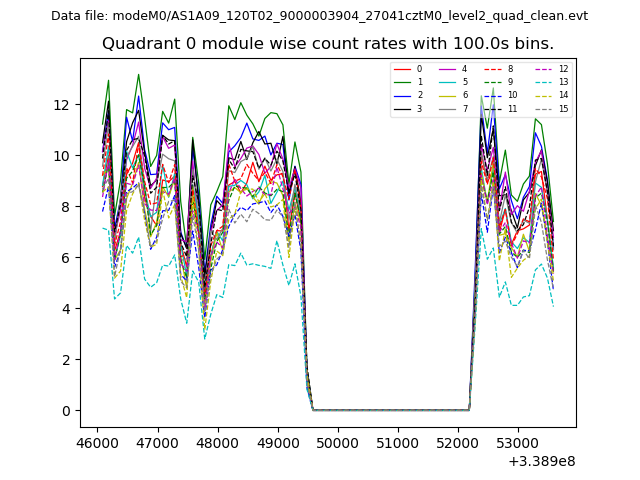
| Module-wise count rates for Quadrant A Data is divided into 100 sec bins |
 |
 |
| Module-wise count rates for Quadrant B Data is divided into 100 sec bins |
 |
 |
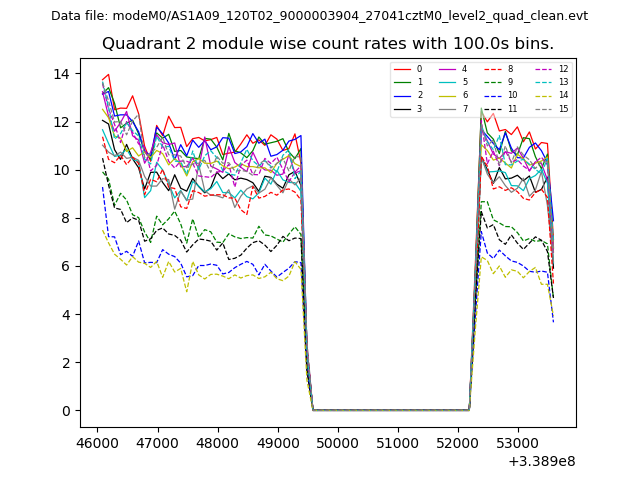
| Module-wise count rates for Quadrant C Data is divided into 100 sec bins |
 |
 |
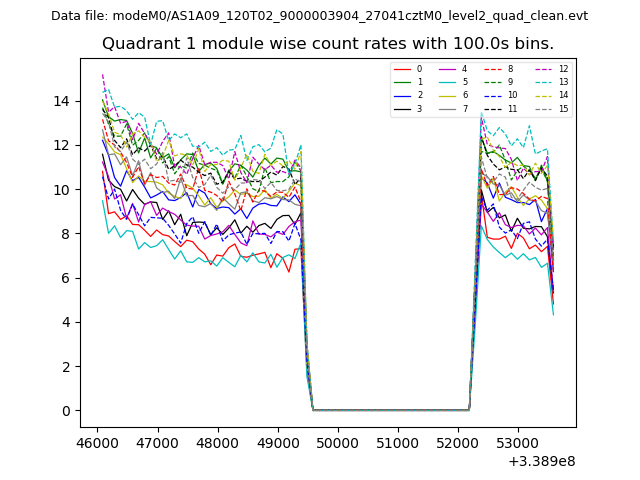
| Module-wise count rates for Quadrant D Data is divided into 100 sec bins |
 |
 |
| Parameter | Plot |
|---|---|
| CZT HV Monitor | 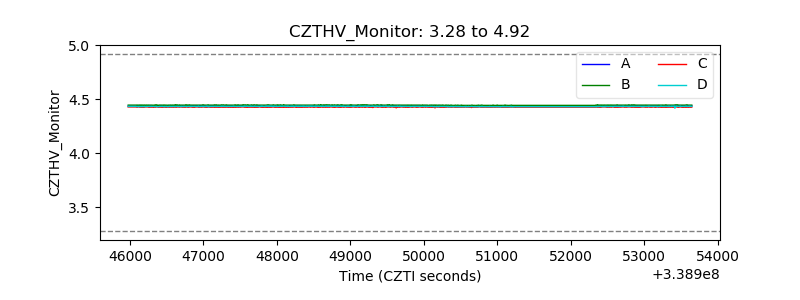 |
| D_VDD | 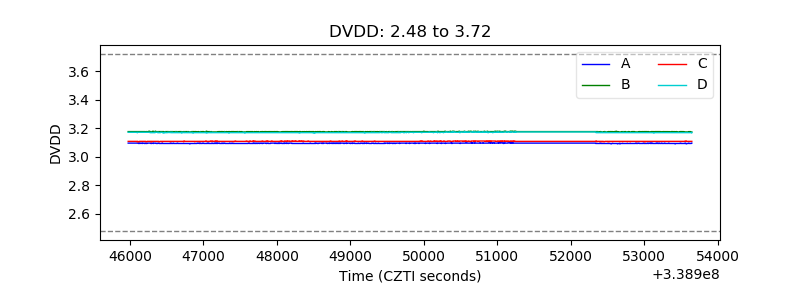 |
| Temperature 1 | 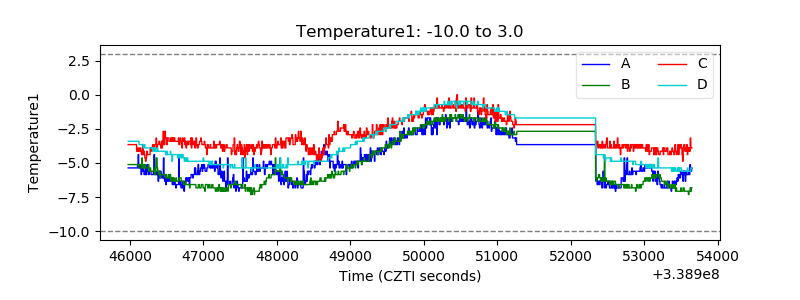 |
| Veto HV Monitor | 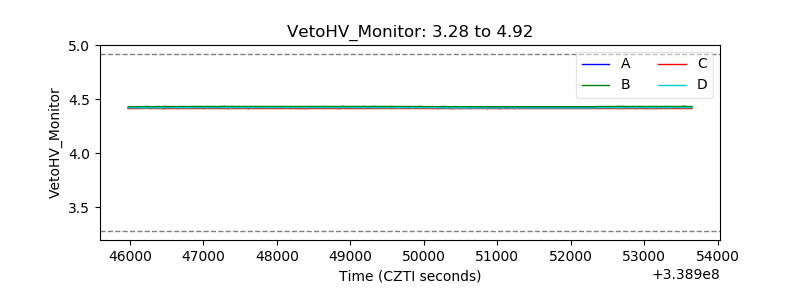 |
| Veto LLD | 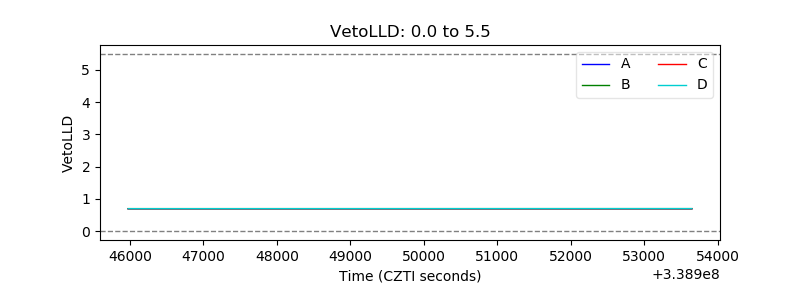 |
| Alpha Counter | 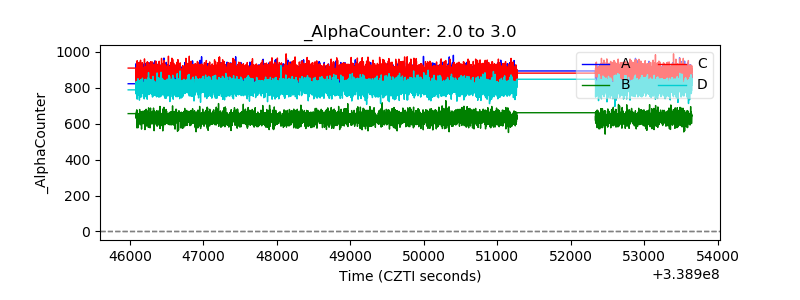 |
| _CPM_Rate | 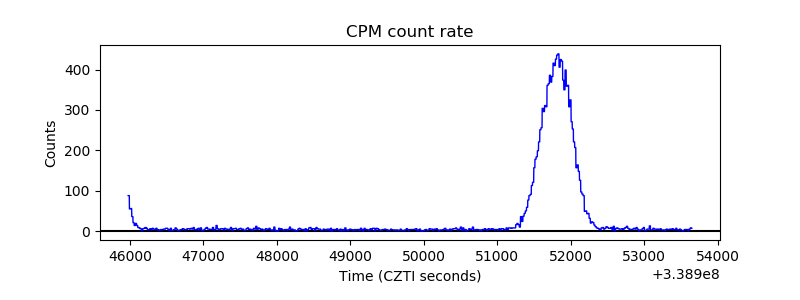 |
| CZT Counter | 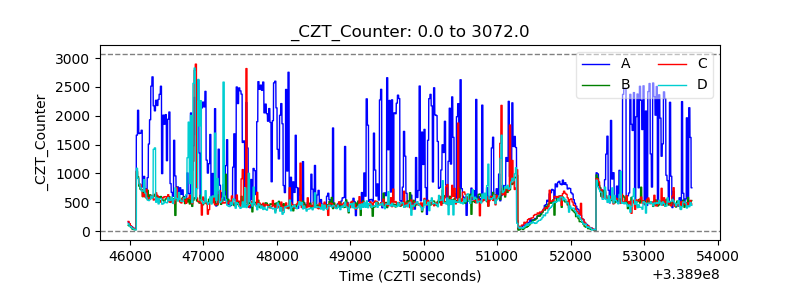 |
| +2.5 Volts monitor |  |
| +5 Volts monitor | 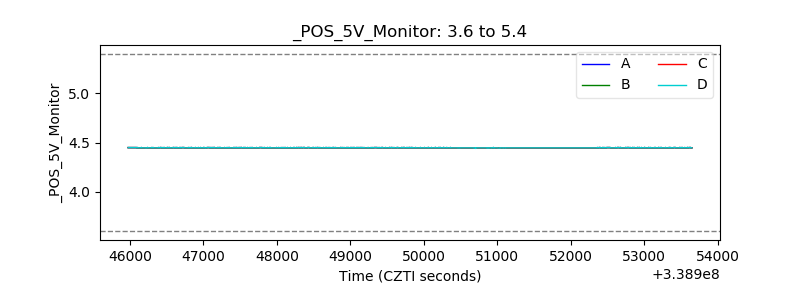 |
| _ROLL_ROT | 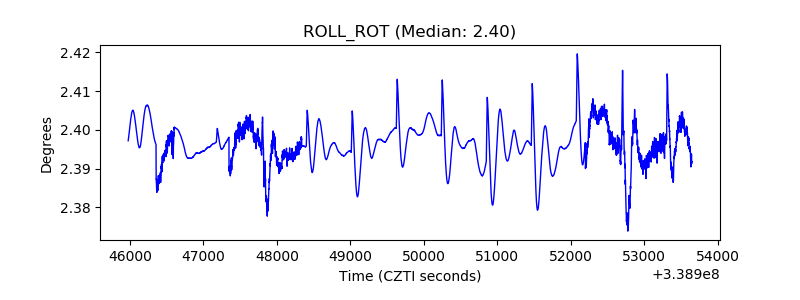 |
| _Roll_DEC | 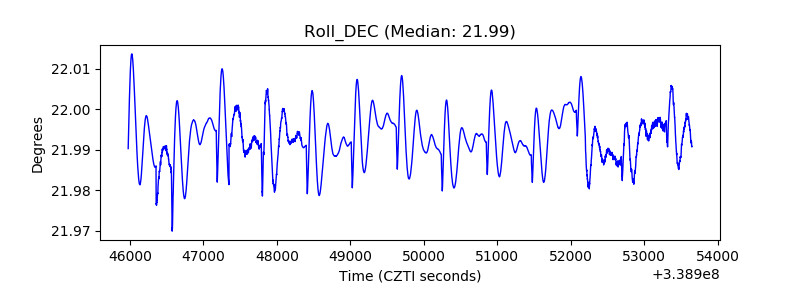 |
| _Roll_RA | 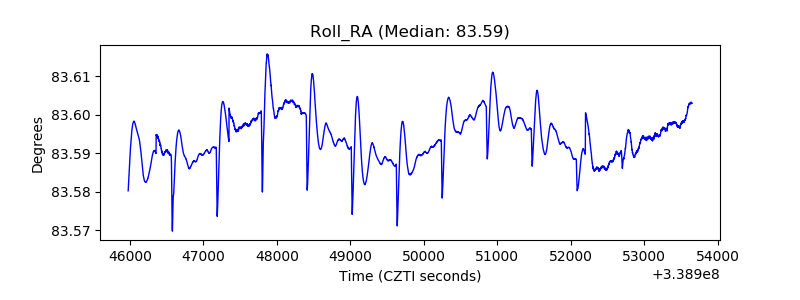 |
| Veto Counter |  |