| Param | Original file | Final file |
|---|---|---|
| Filename | modeM0/AS1A09_120T02_9000003904_27042cztM0_level2.evt | modeM0/AS1A09_120T02_9000003904_27042cztM0_level2_quad_clean.evt |
| Size (bytes) | 652,913,280 | 99,144,000 |
| Size | 622.7 MB | 94.6 MB |
| Events in quadrant A | 8,586,829 | 557,590 |
| Events in quadrant B | 3,436,597 | 683,420 |
| Events in quadrant C | 3,395,027 | 656,605 |
| Events in quadrant D | 3,895,422 | 631,706 |
| Mode M9 | |||
|---|---|---|---|
| Quadrant | BADHDUFLAG | Total packets | Discarded packets |
| A | 0 | 6 | 0 |
| B | 0 | 6 | 0 |
| C | 0 | 6 | 0 |
| D | 0 | 6 | 0 |
| Mode M0 | |||
|---|---|---|---|
| Quadrant | BADHDUFLAG | Total packets | Discarded packets |
| A | 0 | 30106 | 0 |
| B | 0 | 14342 | 0 |
| C | 0 | 14199 | 0 |
| D | 0 | 15942 | 0 |
| Quadrant | Total seconds | Saturated seconds | Saturation percentage |
|---|---|---|---|
| A | 6778 | 2329 | 34.361168% |
| B | 6779 | 110 | 1.622658% |
| C | 6779 | 123 | 1.814427% |
| D | 6779 | 133 | 1.961941% |
Noise dominated data is calculated using 1-second bins in cleaned event files. If a bin has >2000 counts, and if more than 50% of those come from <1% of pixels, then it is considered to be noise-dominated and hence unusable.
| Quadrant | # 1 sec bins | Bins with >0 counts | Bins with >2000 counts | High rate bins dominated by noise | Noise dominated (total time) | Noise dominated (detector-on time) | Marked lightcurve |
|---|---|---|---|---|---|---|---|
| A | 7418 | 6778 | 1773 | 1773 | 23.90% | 26.16% | 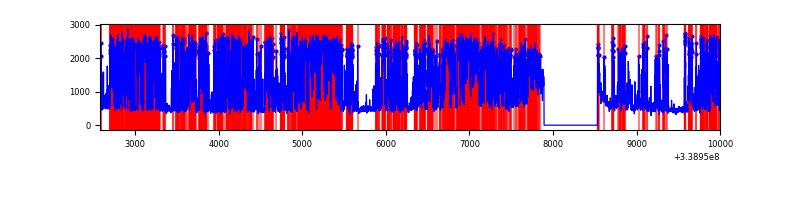 |
| B | 7419 | 6779 | 3 | 3 | 0.04% | 0.04% | 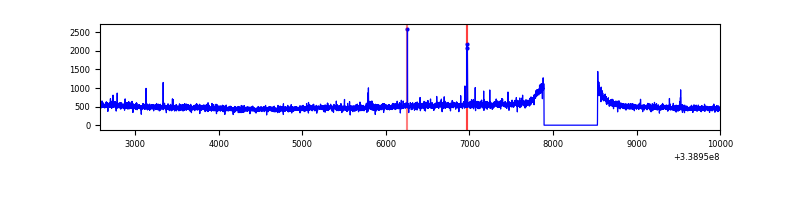 |
| C | 7419 | 6779 | 0 | 0 | 0.00% | 0.00% | 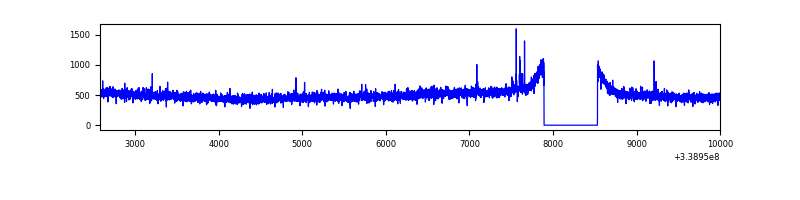 |
| D | 7419 | 6779 | 102 | 102 | 1.37% | 1.50% | 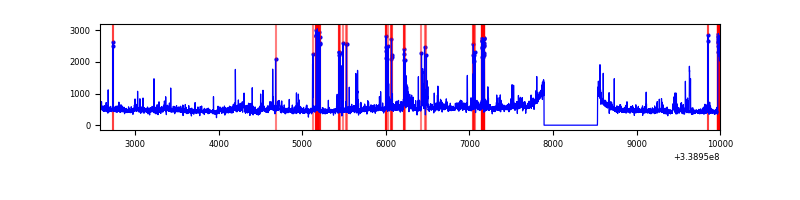 |
Top three noisy pixels from each quadrant. If the there are fewer than three noisy pixels in the level2.evt file, extra rows are filled as -1
| Pixel properties | Quadrant properties | ||||||
|---|---|---|---|---|---|---|---|
| Quadrant | DetID | PixID | Counts | Sigma | Mean | Median | Sigma |
| A | 14 | 235 | 5760877 | 39254.45 | 725 | 713 | 146.7 |
| A | 6 | 16 | 19637 | 128.96 | 725 | 713 | 146.7 |
| A | 8 | 192 | 12385 | 79.54 | 725 | 713 | 146.7 |
| B | 0 | 219 | 20573 | 118.5 | 862 | 842 | 166.5 |
| B | 12 | 111 | 19993 | 115.01 | 862 | 842 | 166.5 |
| B | 3 | 112 | 19097 | 109.63 | 862 | 842 | 166.5 |
| C | 14 | 238 | 133272 | 675.77 | 832 | 840 | 196.0 |
| C | 2 | 16 | 11562 | 54.71 | 832 | 840 | 196.0 |
| C | 15 | 208 | 10239 | 47.96 | 832 | 840 | 196.0 |
| D | 1 | 52 | 594431 | 2945.57 | 829 | 809 | 201.5 |
| D | 2 | 250 | 127793 | 630.1 | 829 | 809 | 201.5 |
| D | 2 | 234 | 30583 | 147.74 | 829 | 809 | 201.5 |
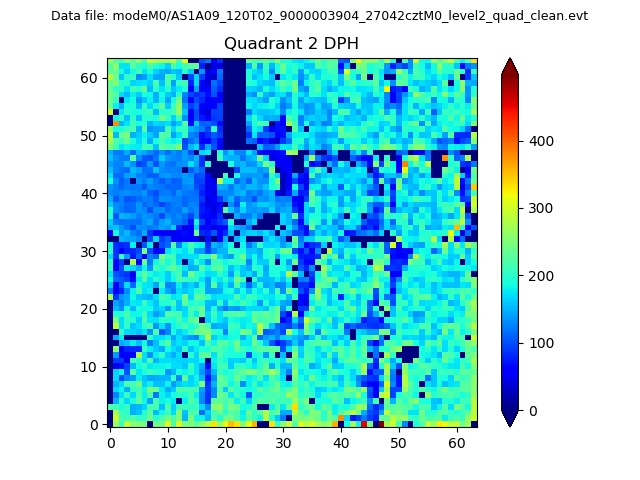
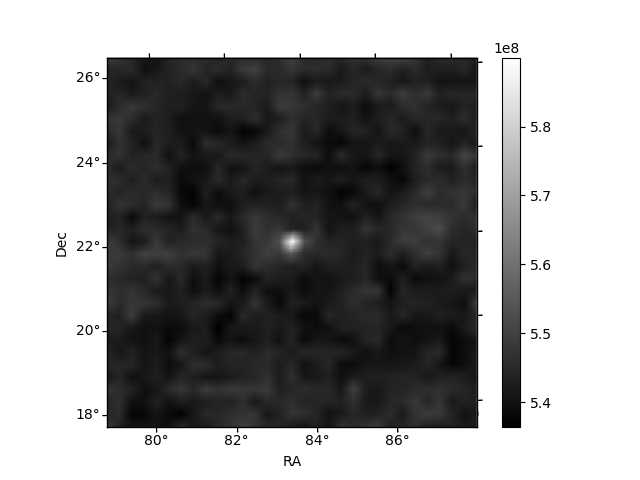
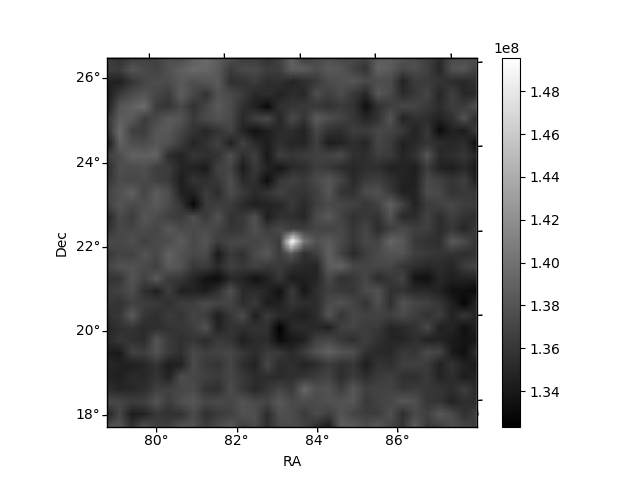
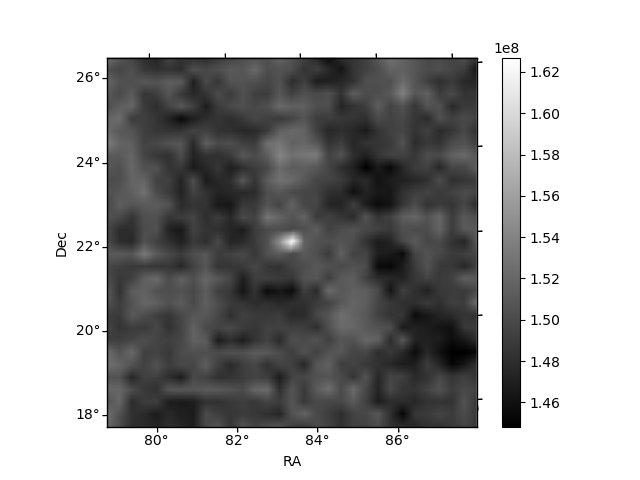
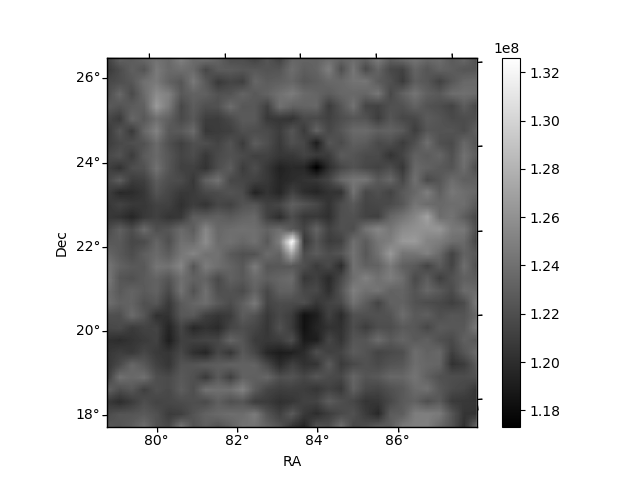
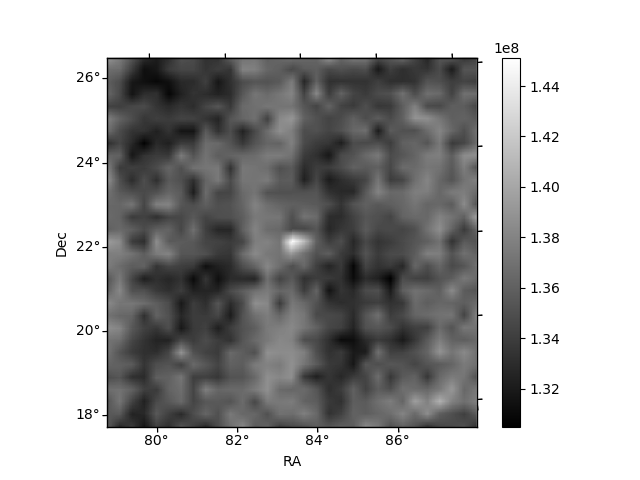
Histogram calculated using DETX and DETY for each event in the final _common_clean file
| Quadrant A | 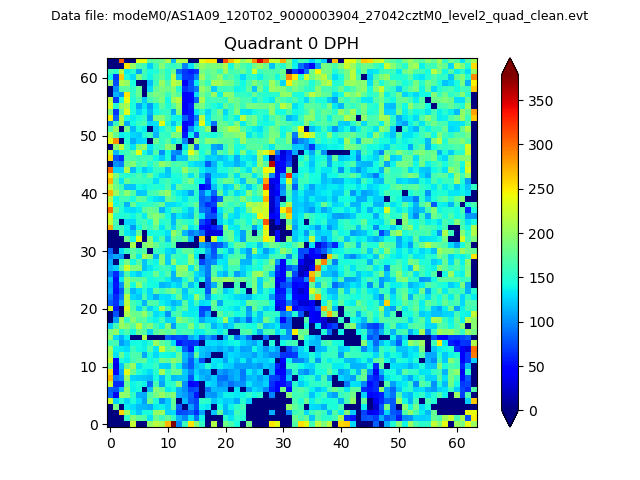 |
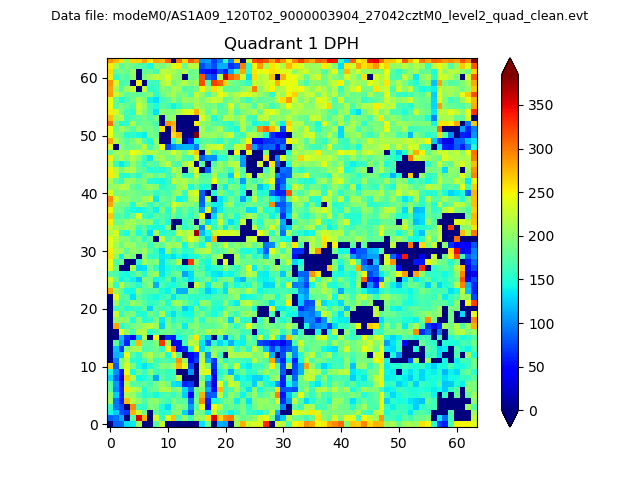 |
Quadrant B |
|---|---|---|---|
| Quadrant D | 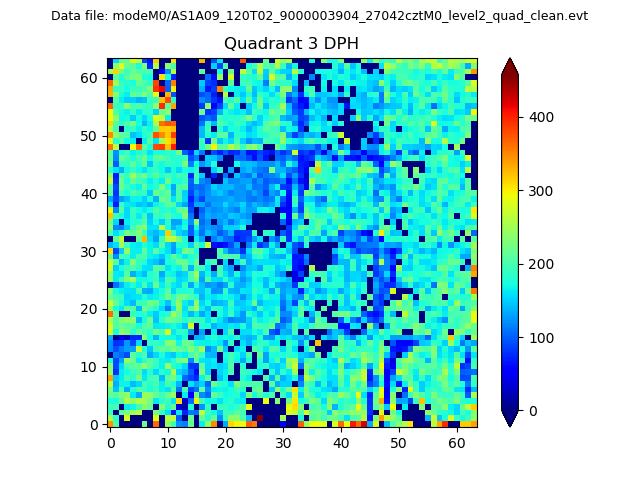 |
 |
Quadrant C |
| Plot type | Count rate plots | Images |
|---|---|---|
| Comparison with Poisson distribution Blue bars denote a histogram of data divided into 1 sec bins. Red curve is a Poisson curve with rate = median count rate of data. |
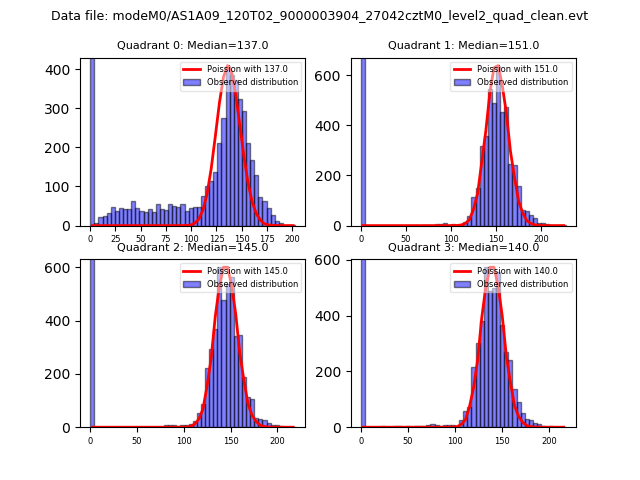 |
 |
| Quadrant-wise count rates Data is divided into 100 sec bins |
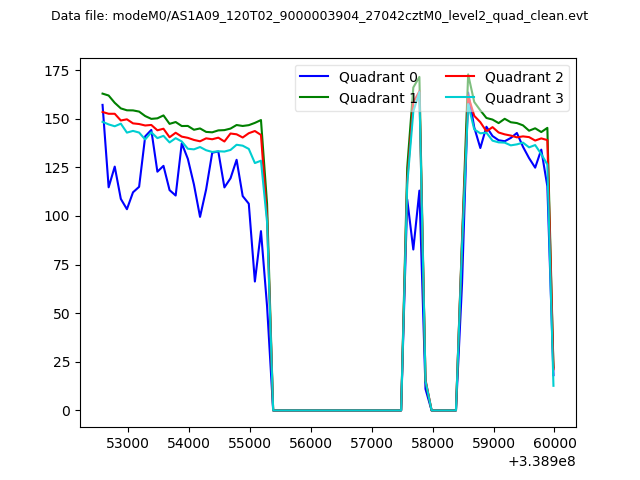 |
|
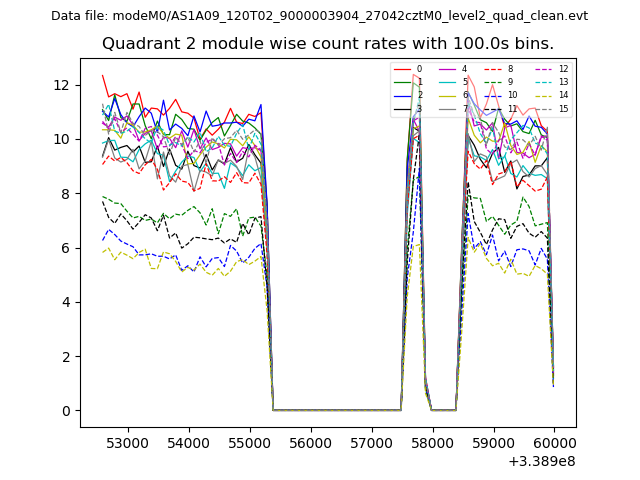
| Module-wise count rates for Quadrant A Data is divided into 100 sec bins |
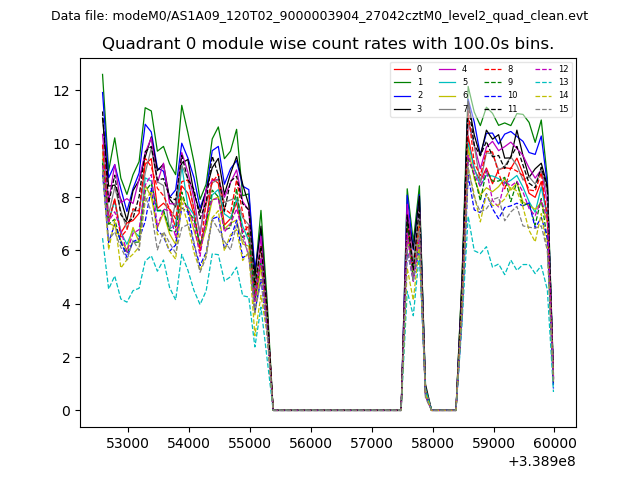 |
 |
| Module-wise count rates for Quadrant B Data is divided into 100 sec bins |
 |
 |
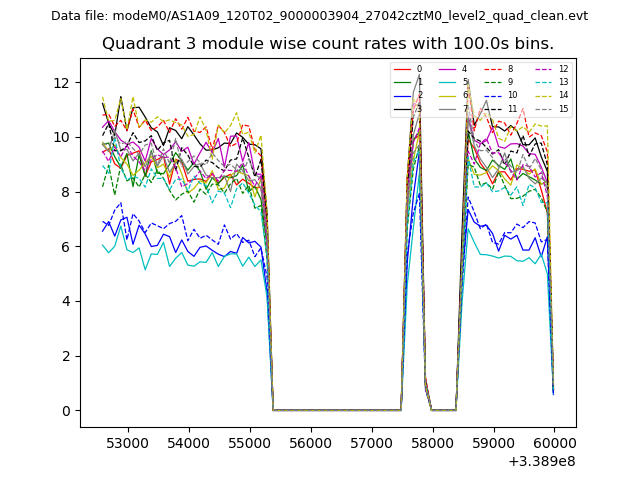
| Module-wise count rates for Quadrant C Data is divided into 100 sec bins |
 |
 |
| Module-wise count rates for Quadrant D Data is divided into 100 sec bins |
 |
 |
| Parameter | Plot |
|---|---|
| CZT HV Monitor | 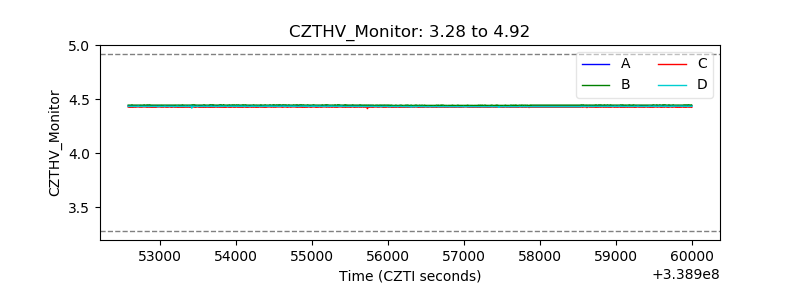 |
| D_VDD | 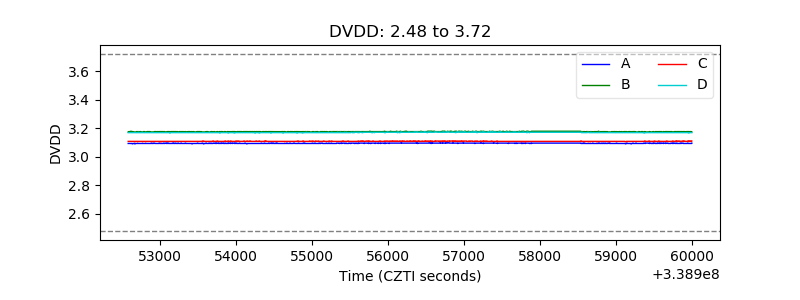 |
| Temperature 1 | 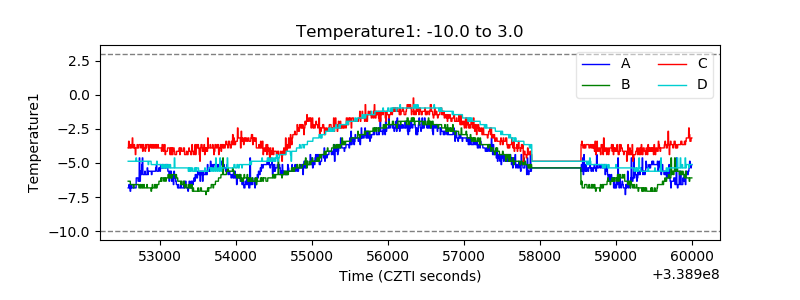 |
| Veto HV Monitor | 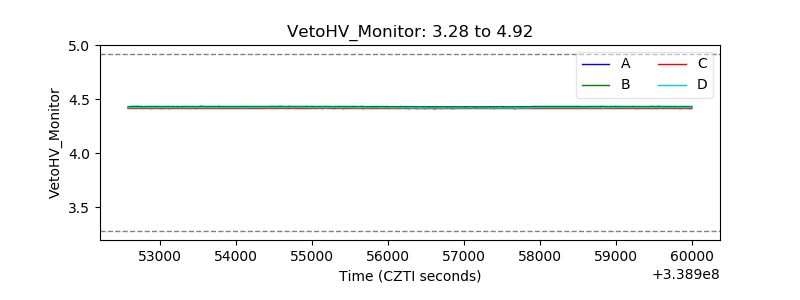 |
| Veto LLD |  |
| Alpha Counter | 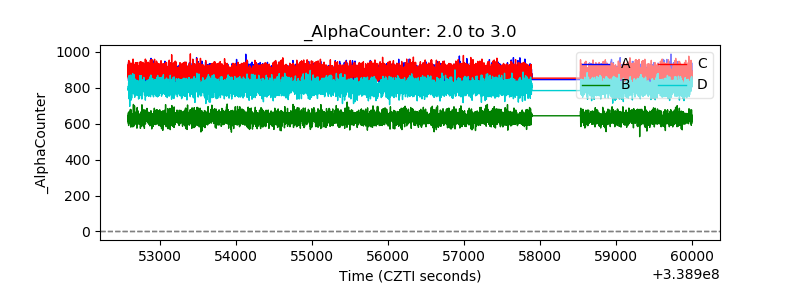 |
| _CPM_Rate | 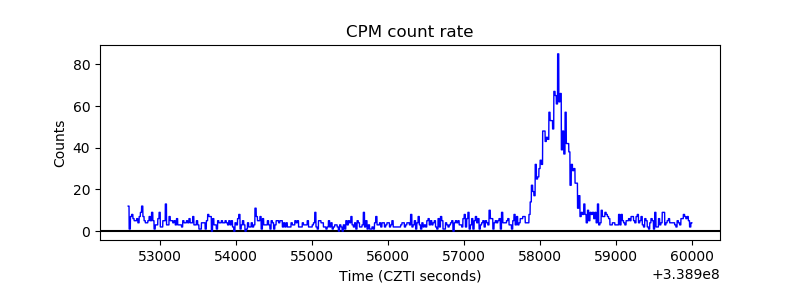 |
| CZT Counter | 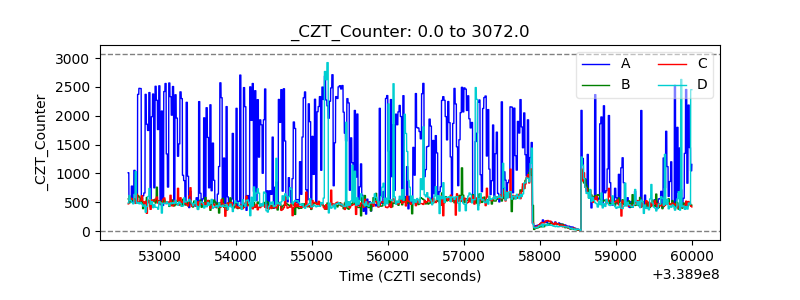 |
| +2.5 Volts monitor |  |
| +5 Volts monitor |  |
| _ROLL_ROT | 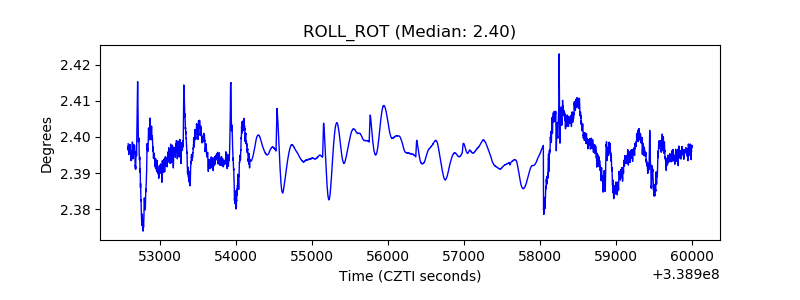 |
| _Roll_DEC | 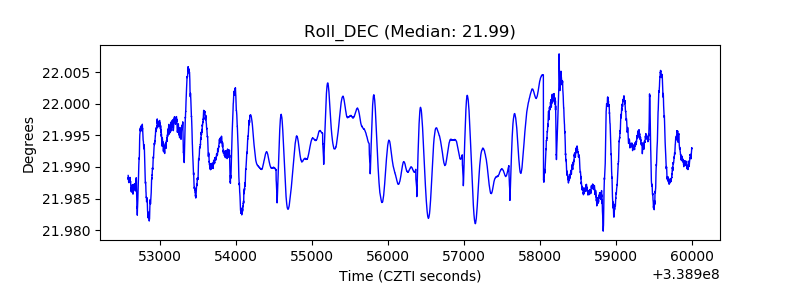 |
| _Roll_RA | 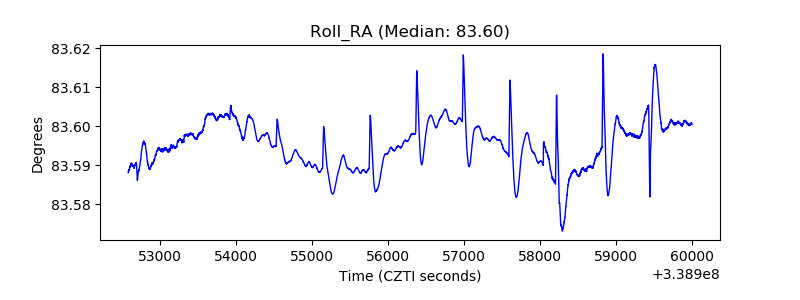 |
| Veto Counter | 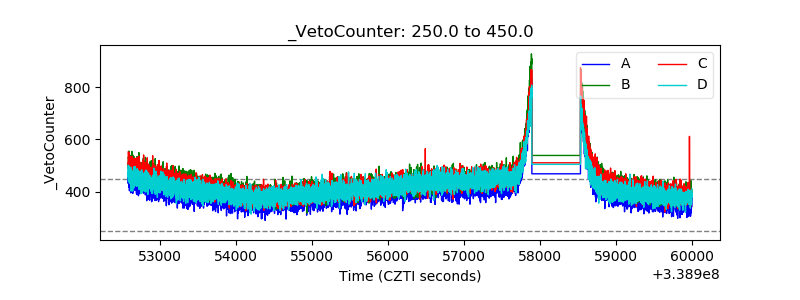 |