| Param | Original file | Final file |
|---|---|---|
| Filename | modeM0/AS1A09_120T02_9000003904_27043cztM0_level2.evt | modeM0/AS1A09_120T02_9000003904_27043cztM0_level2_quad_clean.evt |
| Size (bytes) | 726,566,400 | 108,610,560 |
| Size | 692.9 MB | 103.6 MB |
| Events in quadrant A | 8,720,136 | 639,539 |
| Events in quadrant B | 3,693,930 | 740,974 |
| Events in quadrant C | 3,601,280 | 715,814 |
| Events in quadrant D | 5,493,540 | 682,922 |
| Mode M9 | |||
|---|---|---|---|
| Quadrant | BADHDUFLAG | Total packets | Discarded packets |
| A | 0 | 3 | 0 |
| B | 0 | 3 | 0 |
| C | 0 | 3 | 0 |
| D | 0 | 3 | 0 |
| Mode M0 | |||
|---|---|---|---|
| Quadrant | BADHDUFLAG | Total packets | Discarded packets |
| A | 0 | 30876 | 0 |
| B | 0 | 15521 | 0 |
| C | 0 | 15241 | 0 |
| D | 0 | 21290 | 0 |
| Quadrant | Total seconds | Saturated seconds | Saturation percentage |
|---|---|---|---|
| A | 7317 | 2063 | 28.194615% |
| B | 7317 | 166 | 2.268689% |
| C | 7317 | 124 | 1.694684% |
| D | 7317 | 562 | 7.680743% |
Noise dominated data is calculated using 1-second bins in cleaned event files. If a bin has >2000 counts, and if more than 50% of those come from <1% of pixels, then it is considered to be noise-dominated and hence unusable.
| Quadrant | # 1 sec bins | Bins with >0 counts | Bins with >2000 counts | High rate bins dominated by noise | Noise dominated (total time) | Noise dominated (detector-on time) | Marked lightcurve |
|---|---|---|---|---|---|---|---|
| A | 7597 | 7317 | 1545 | 1545 | 20.34% | 21.12% | 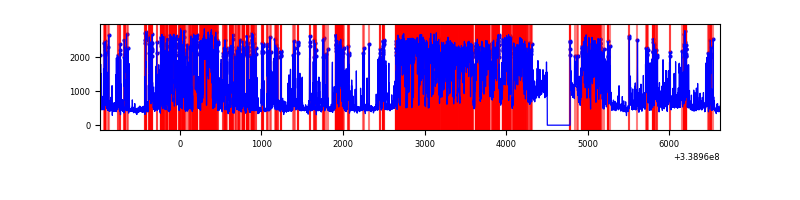 |
| B | 7597 | 7317 | 0 | 0 | 0.00% | 0.00% | 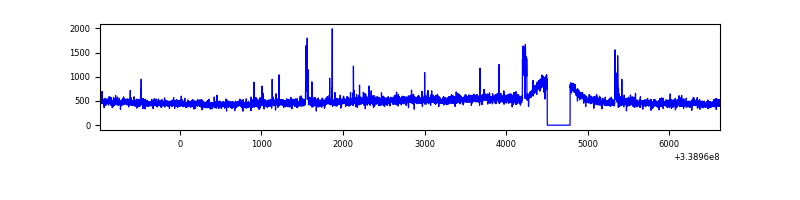 |
| C | 7597 | 7317 | 2 | 2 | 0.03% | 0.03% | 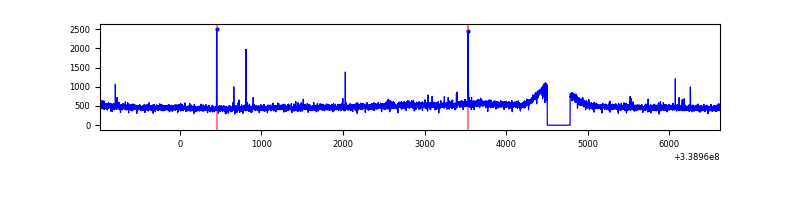 |
| D | 7597 | 7317 | 496 | 496 | 6.53% | 6.78% | 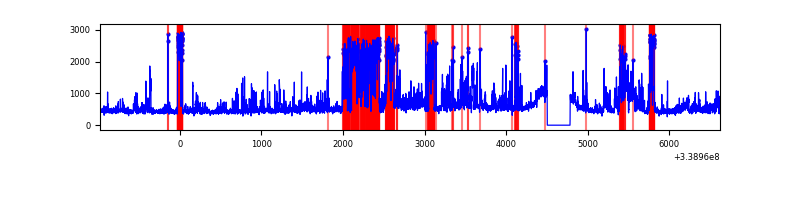 |
Top three noisy pixels from each quadrant. If the there are fewer than three noisy pixels in the level2.evt file, extra rows are filled as -1
| Pixel properties | Quadrant properties | ||||||
|---|---|---|---|---|---|---|---|
| Quadrant | DetID | PixID | Counts | Sigma | Mean | Median | Sigma |
| A | 14 | 235 | 5509702 | 33243.44 | 813 | 798 | 165.7 |
| A | 6 | 16 | 64165 | 382.38 | 813 | 798 | 165.7 |
| A | 8 | 192 | 12945 | 73.3 | 813 | 798 | 165.7 |
| B | 10 | 245 | 49686 | 275.74 | 910 | 889 | 177.0 |
| B | 12 | 111 | 21292 | 115.29 | 910 | 889 | 177.0 |
| B | 0 | 219 | 20523 | 110.95 | 910 | 889 | 177.0 |
| C | 14 | 238 | 141431 | 671.39 | 881 | 889 | 209.3 |
| C | 15 | 208 | 28988 | 134.23 | 881 | 889 | 209.3 |
| C | 13 | 61 | 5926 | 24.06 | 881 | 889 | 209.3 |
| D | 1 | 52 | 2087345 | 9892.98 | 867 | 845 | 210.9 |
| D | 2 | 250 | 90871 | 426.85 | 867 | 845 | 210.9 |
| D | 2 | 234 | 33642 | 155.5 | 867 | 845 | 210.9 |
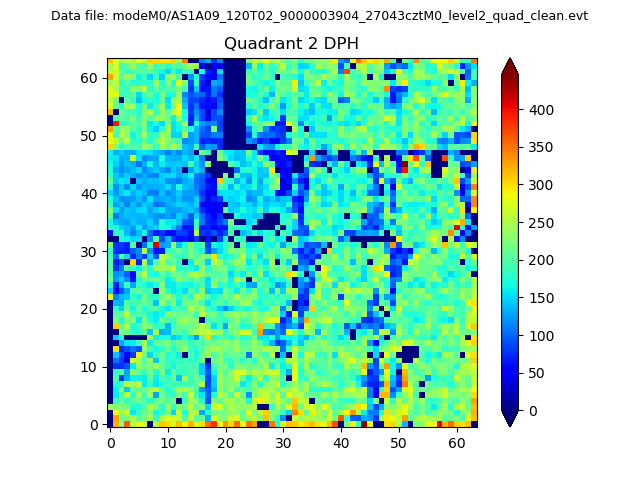
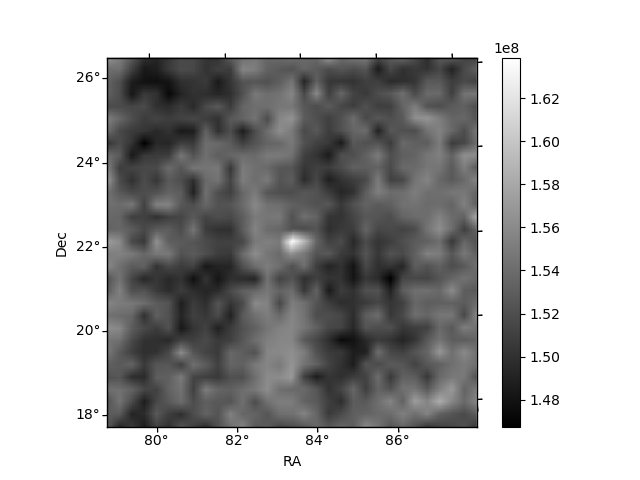
Histogram calculated using DETX and DETY for each event in the final _common_clean file
| Quadrant A | 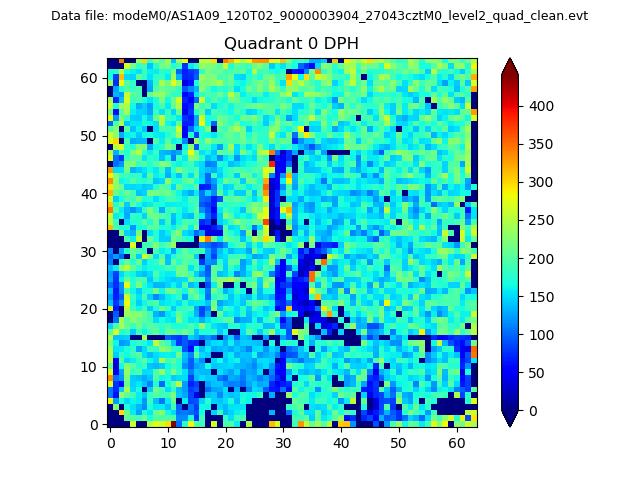 |
 |
Quadrant B |
|---|---|---|---|
| Quadrant D |  |
 |
Quadrant C |
| Plot type | Count rate plots | Images |
|---|---|---|
| Comparison with Poisson distribution Blue bars denote a histogram of data divided into 1 sec bins. Red curve is a Poisson curve with rate = median count rate of data. |
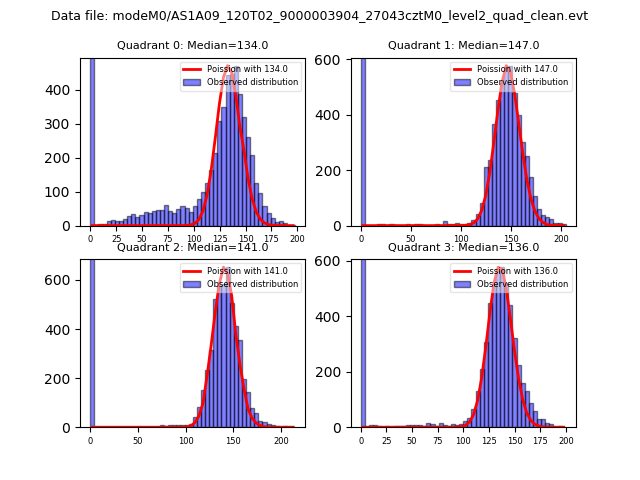 |
 |
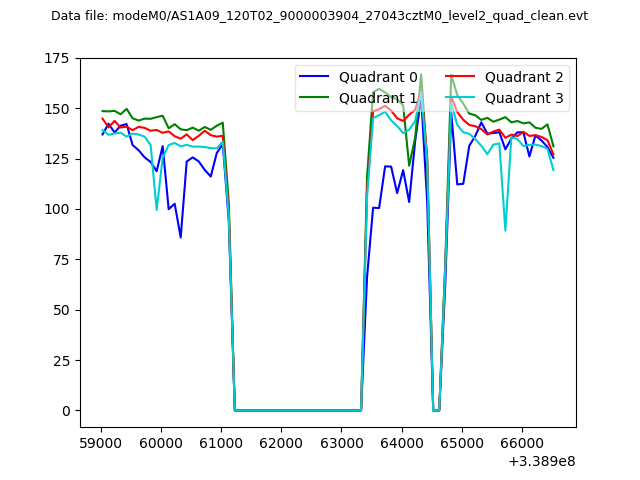
| Quadrant-wise count rates Data is divided into 100 sec bins |
 |
|
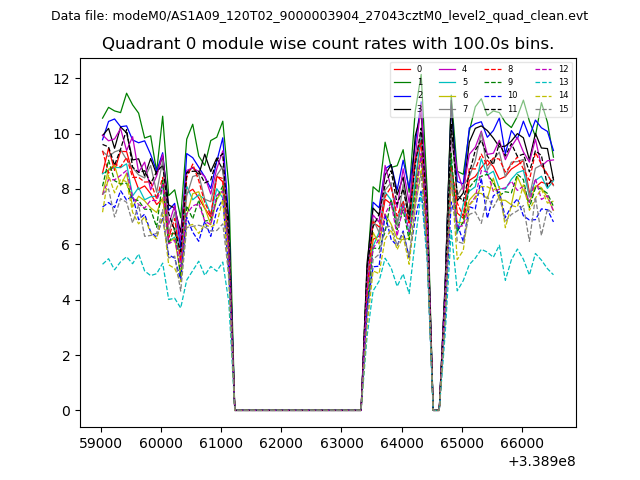
| Module-wise count rates for Quadrant A Data is divided into 100 sec bins |
 |
 |
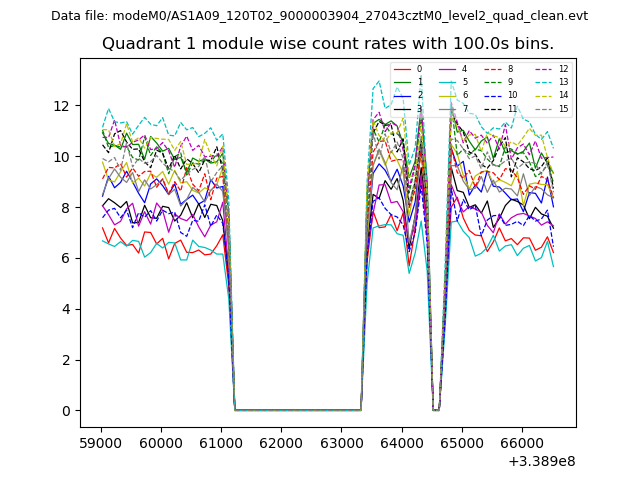
| Module-wise count rates for Quadrant B Data is divided into 100 sec bins |
 |
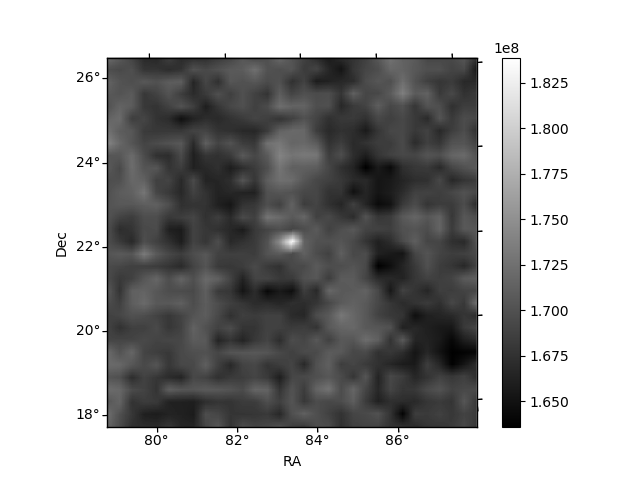 |
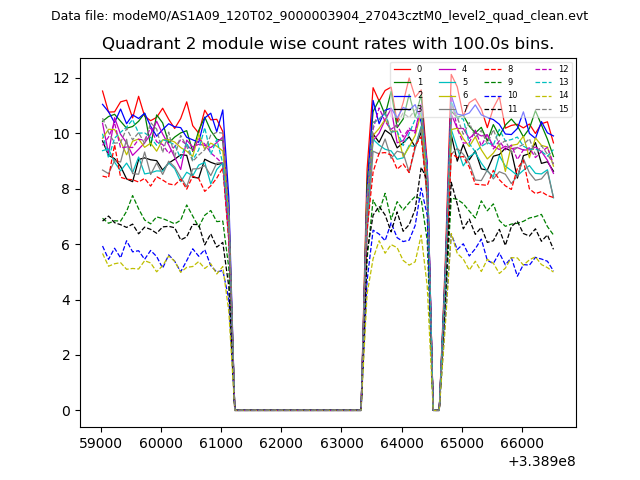
| Module-wise count rates for Quadrant C Data is divided into 100 sec bins |
 |
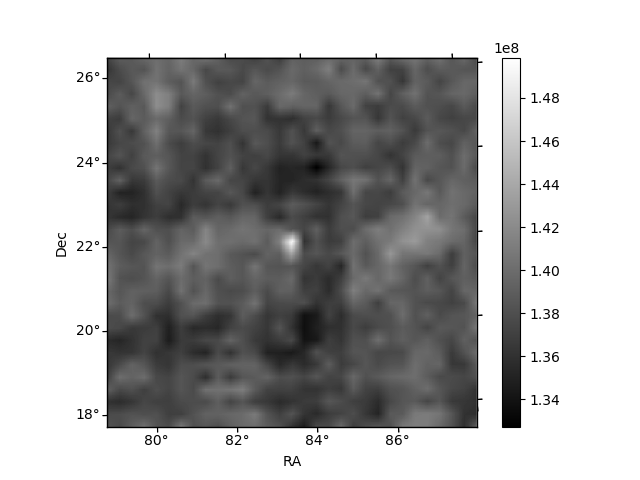 |
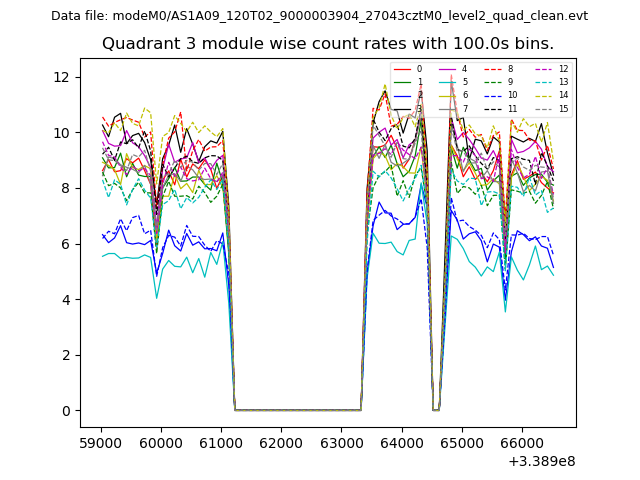
| Module-wise count rates for Quadrant D Data is divided into 100 sec bins |
 |
 |
| Parameter | Plot |
|---|---|
| CZT HV Monitor |  |
| D_VDD | 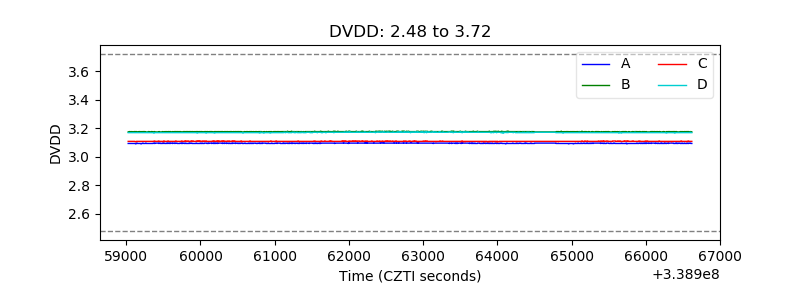 |
| Temperature 1 | 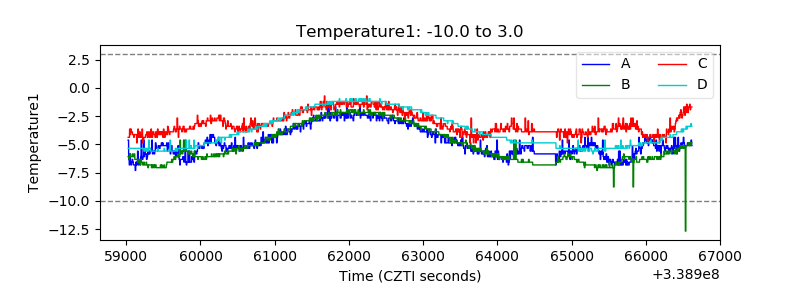 |
| Veto HV Monitor | 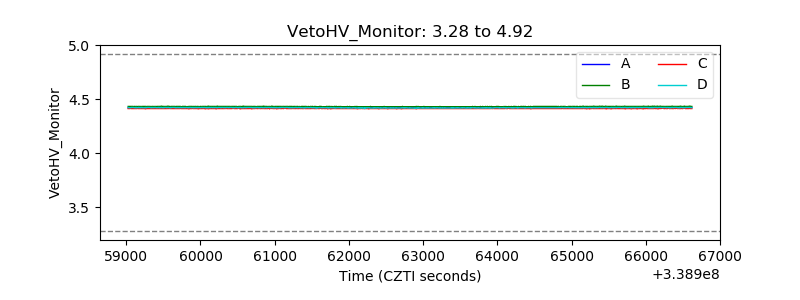 |
| Veto LLD | 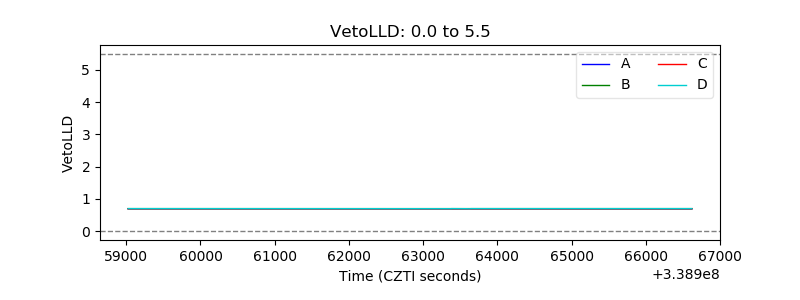 |
| Alpha Counter | 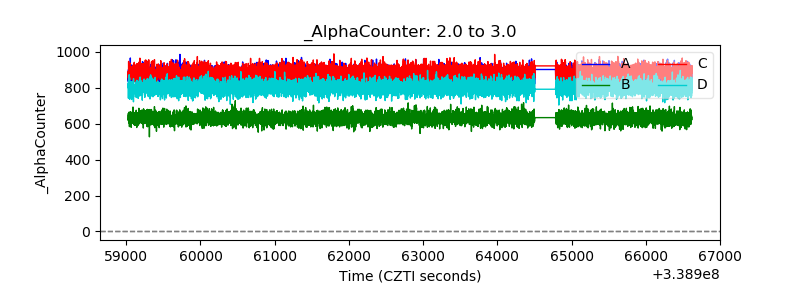 |
| _CPM_Rate | 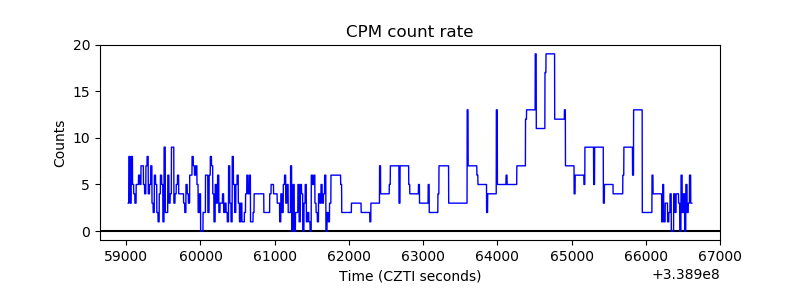 |
| CZT Counter | 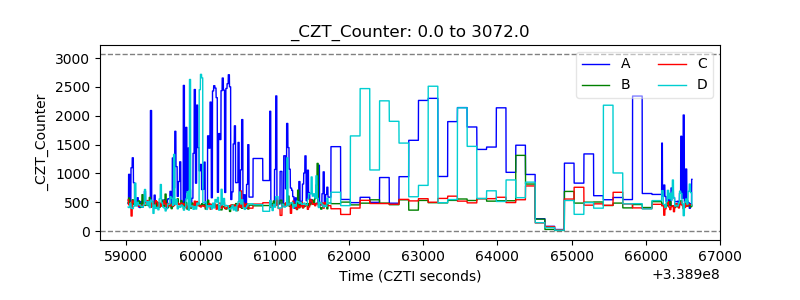 |
| +2.5 Volts monitor |  |
| +5 Volts monitor | 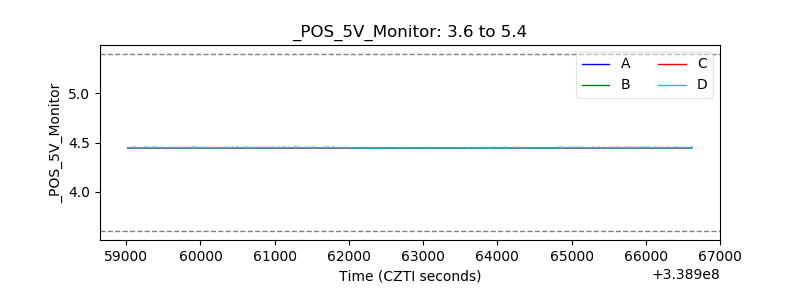 |
| _ROLL_ROT | 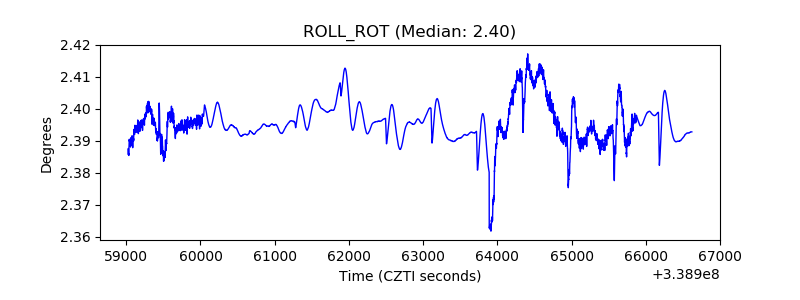 |
| _Roll_DEC | 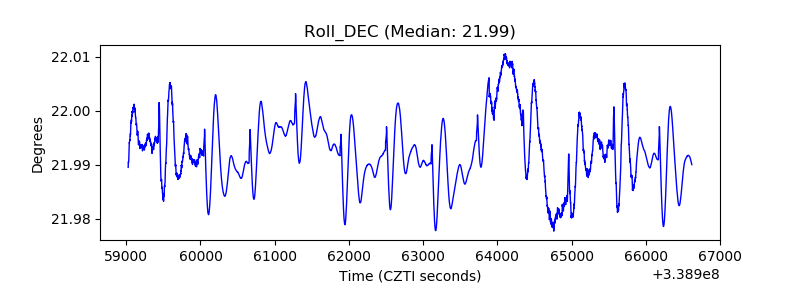 |
| _Roll_RA |  |
| Veto Counter | 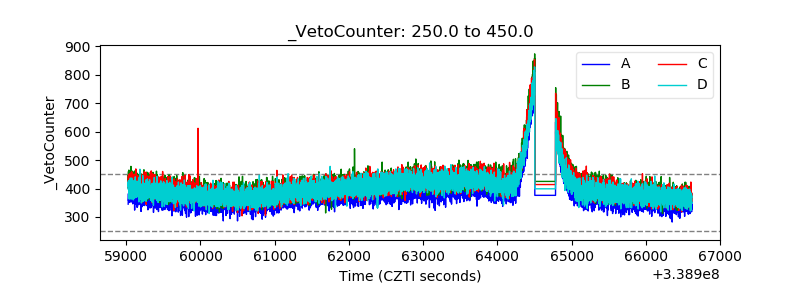 |