| Param | Original file | Final file |
|---|---|---|
| Filename | modeM0/AS1A09_120T02_9000003904_27044cztM0_level2.evt | modeM0/AS1A09_120T02_9000003904_27044cztM0_level2_quad_clean.evt |
| Size (bytes) | 590,811,840 | 93,695,040 |
| Size | 563.4 MB | 89.4 MB |
| Events in quadrant A | 5,799,260 | 566,484 |
| Events in quadrant B | 3,281,067 | 636,764 |
| Events in quadrant C | 3,264,078 | 608,408 |
| Events in quadrant D | 5,103,119 | 566,974 |
| Mode M9 | |||
|---|---|---|---|
| Quadrant | BADHDUFLAG | Total packets | Discarded packets |
| A | 0 | 1 | 0 |
| B | 0 | 1 | 0 |
| C | 0 | 1 | 0 |
| D | 0 | 1 | 0 |
| Mode M0 | |||
|---|---|---|---|
| Quadrant | BADHDUFLAG | Total packets | Discarded packets |
| A | 0 | 21550 | 0 |
| B | 0 | 13779 | 0 |
| C | 0 | 13710 | 0 |
| D | 0 | 19566 | 0 |
| Quadrant | Total seconds | Saturated seconds | Saturation percentage |
|---|---|---|---|
| A | 6566 | 919 | 13.996345% |
| B | 6567 | 205 | 3.121669% |
| C | 6567 | 205 | 3.121669% |
| D | 6567 | 566 | 8.618852% |
Noise dominated data is calculated using 1-second bins in cleaned event files. If a bin has >2000 counts, and if more than 50% of those come from <1% of pixels, then it is considered to be noise-dominated and hence unusable.
| Quadrant | # 1 sec bins | Bins with >0 counts | Bins with >2000 counts | High rate bins dominated by noise | Noise dominated (total time) | Noise dominated (detector-on time) | Marked lightcurve |
|---|---|---|---|---|---|---|---|
| A | 6690 | 6565 | 559 | 559 | 8.36% | 8.51% | 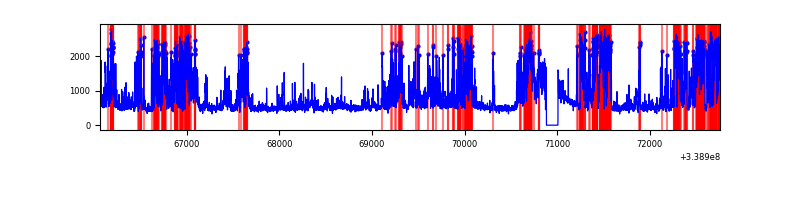 |
| B | 6692 | 6567 | 16 | 16 | 0.24% | 0.24% | 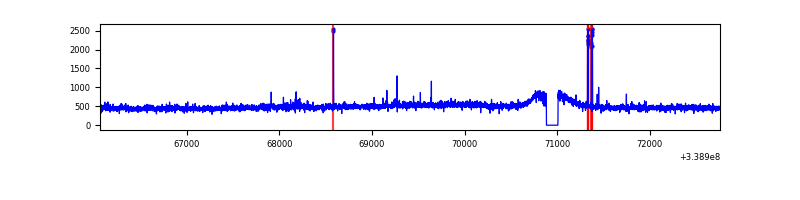 |
| C | 6692 | 6567 | 5 | 5 | 0.07% | 0.08% | 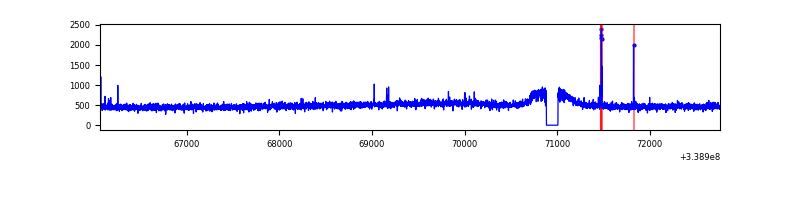 |
| D | 6692 | 6567 | 433 | 433 | 6.47% | 6.59% | 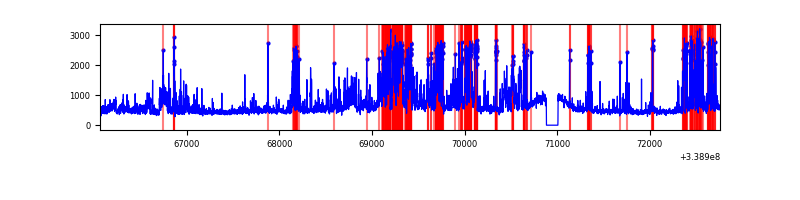 |
Top three noisy pixels from each quadrant. If the there are fewer than three noisy pixels in the level2.evt file, extra rows are filled as -1
| Pixel properties | Quadrant properties | ||||||
|---|---|---|---|---|---|---|---|
| Quadrant | DetID | PixID | Counts | Sigma | Mean | Median | Sigma |
| A | 14 | 235 | 2666334 | 16608.17 | 786 | 771 | 160.5 |
| A | 6 | 16 | 92767 | 573.19 | 786 | 771 | 160.5 |
| A | 13 | 254 | 9861 | 56.64 | 786 | 771 | 160.5 |
| B | 0 | 189 | 39682 | 241.27 | 823 | 805 | 161.1 |
| B | 12 | 111 | 19345 | 115.06 | 823 | 805 | 161.1 |
| B | 11 | 111 | 17586 | 104.14 | 823 | 805 | 161.1 |
| C | 14 | 238 | 124855 | 661.16 | 796 | 804 | 187.6 |
| C | 15 | 208 | 25932 | 133.93 | 796 | 804 | 187.6 |
| C | 8 | 128 | 5540 | 25.24 | 796 | 804 | 187.6 |
| D | 1 | 52 | 1880097 | 10015.53 | 782 | 760 | 187.6 |
| D | 2 | 250 | 158713 | 841.78 | 782 | 760 | 187.6 |
| D | 11 | 176 | 79686 | 420.62 | 782 | 760 | 187.6 |
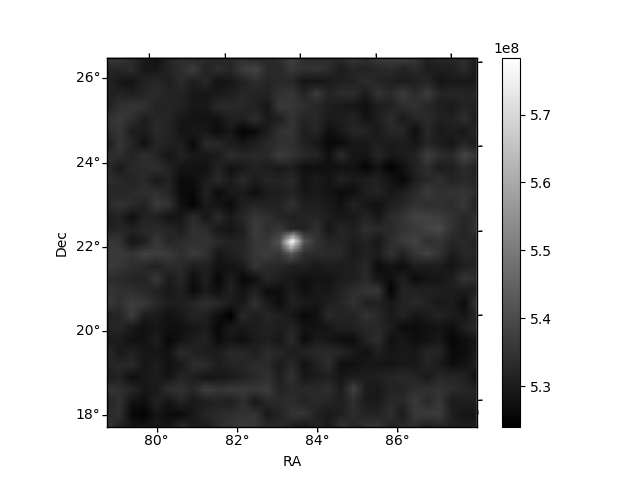
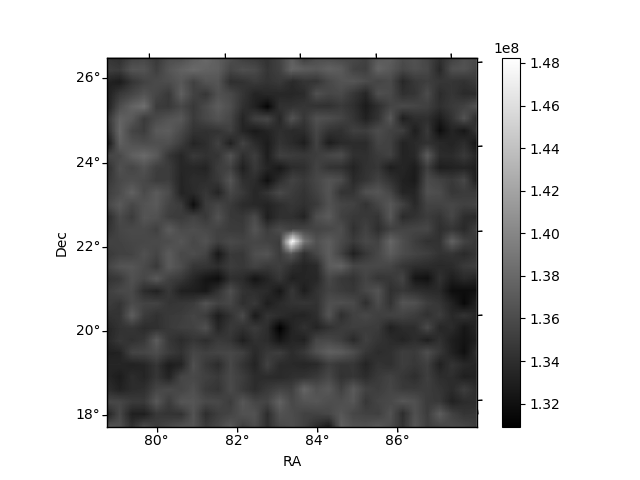
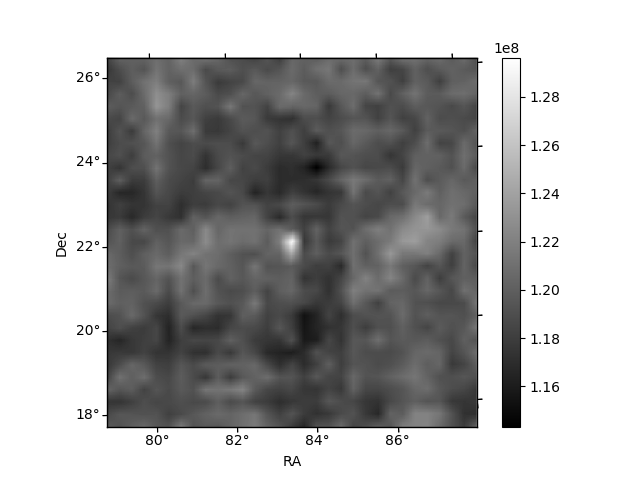
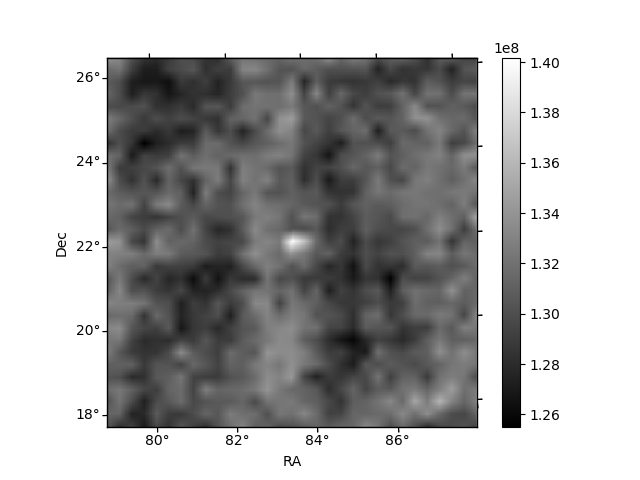
Histogram calculated using DETX and DETY for each event in the final _common_clean file
| Quadrant A |  |
 |
Quadrant B |
|---|---|---|---|
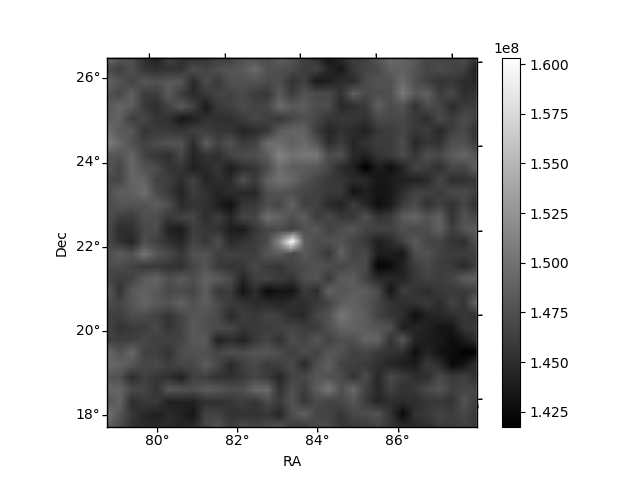
| Quadrant D |  |
 |
Quadrant C |
| Plot type | Count rate plots | Images |
|---|---|---|
| Comparison with Poisson distribution Blue bars denote a histogram of data divided into 1 sec bins. Red curve is a Poisson curve with rate = median count rate of data. |
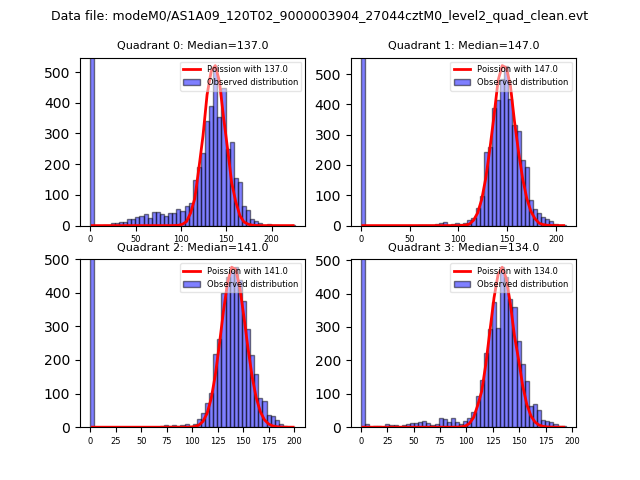 |
 |
| Quadrant-wise count rates Data is divided into 100 sec bins |
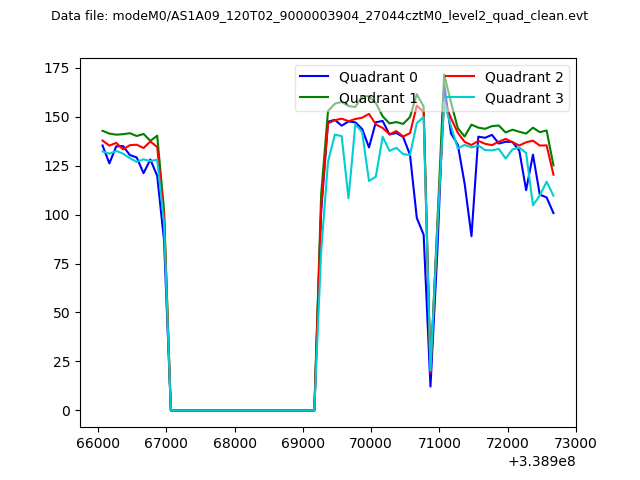 |
|
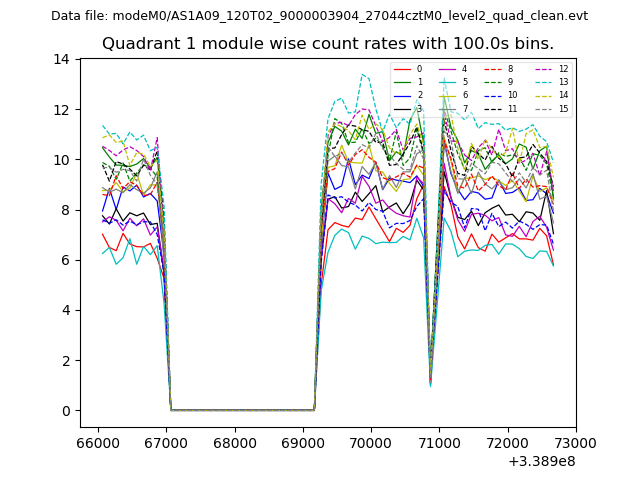
| Module-wise count rates for Quadrant A Data is divided into 100 sec bins |
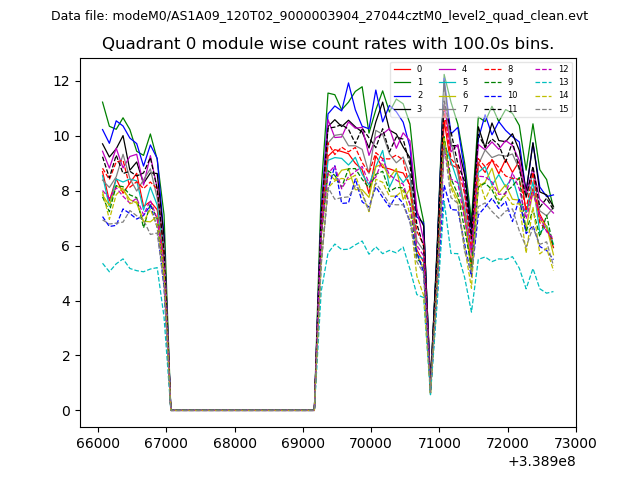 |
 |
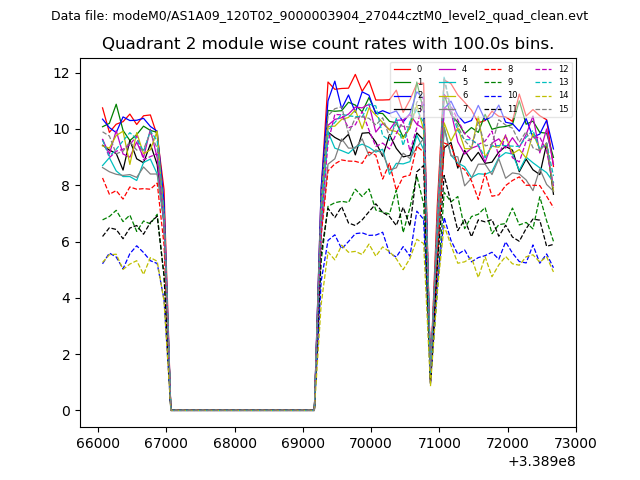
| Module-wise count rates for Quadrant B Data is divided into 100 sec bins |
 |
 |
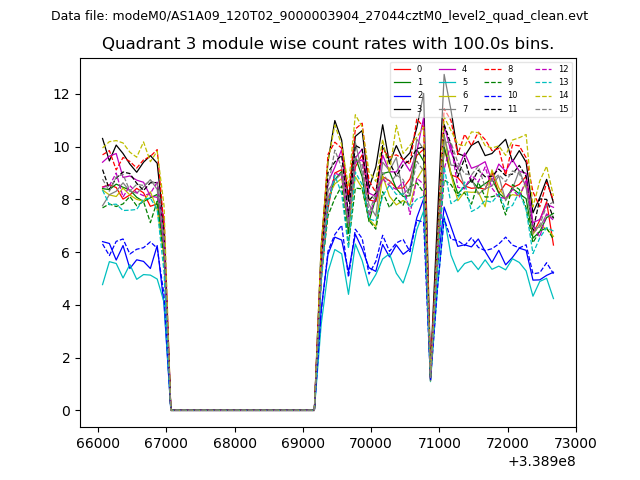
| Module-wise count rates for Quadrant C Data is divided into 100 sec bins |
 |
 |
| Module-wise count rates for Quadrant D Data is divided into 100 sec bins |
 |
 |
| Parameter | Plot |
|---|---|
| CZT HV Monitor | 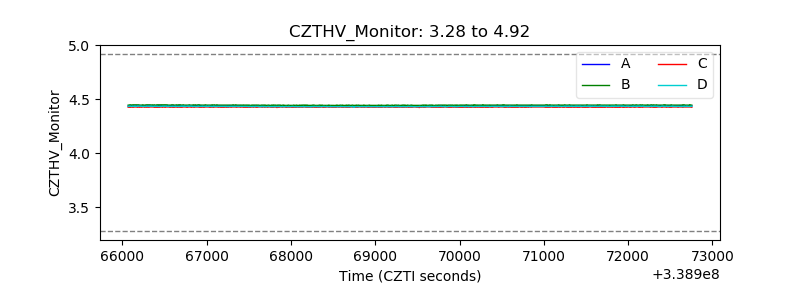 |
| D_VDD | 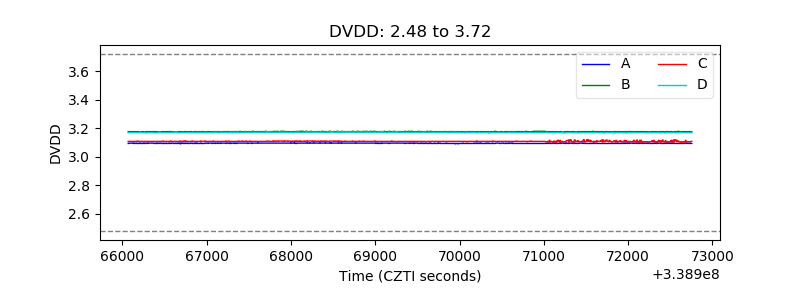 |
| Temperature 1 | 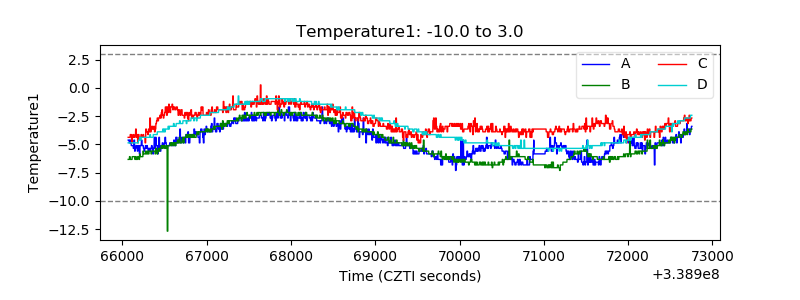 |
| Veto HV Monitor | 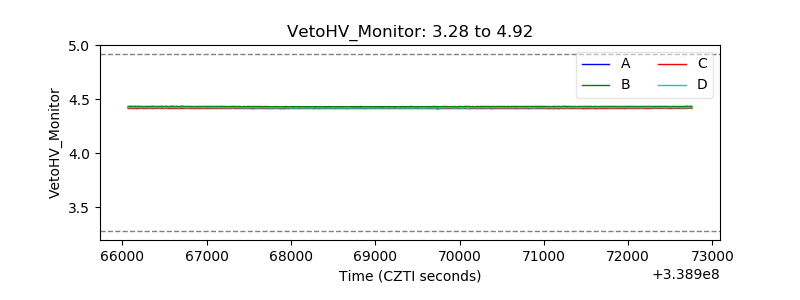 |
| Veto LLD | 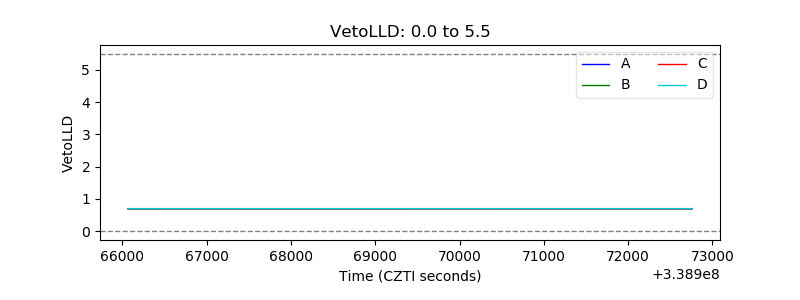 |
| Alpha Counter | 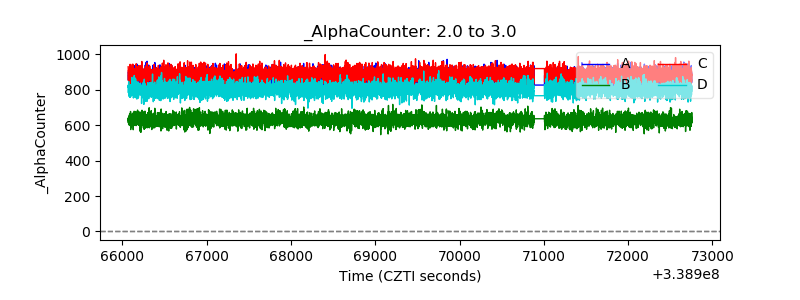 |
| _CPM_Rate | 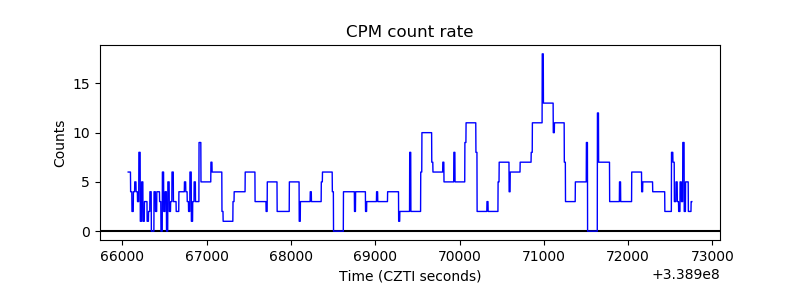 |
| CZT Counter |  |
| +2.5 Volts monitor |  |
| +5 Volts monitor |  |
| _ROLL_ROT | 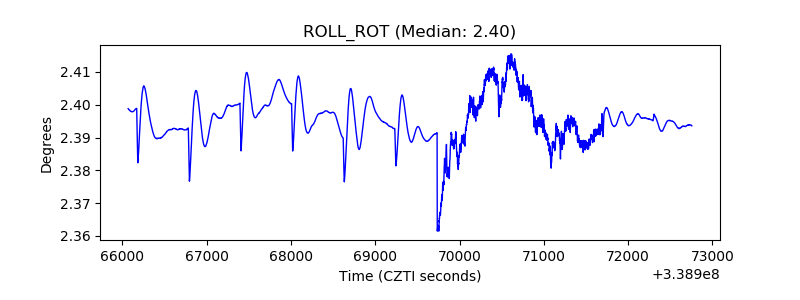 |
| _Roll_DEC | 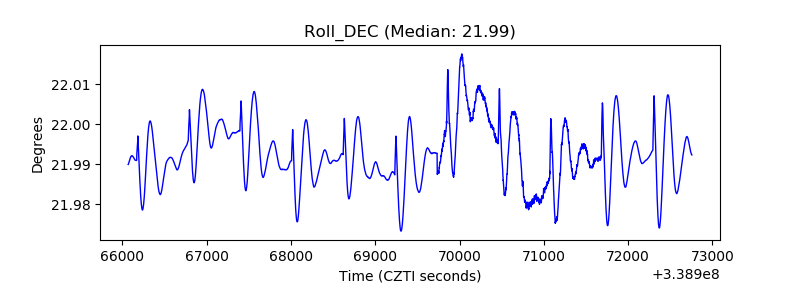 |
| _Roll_RA | 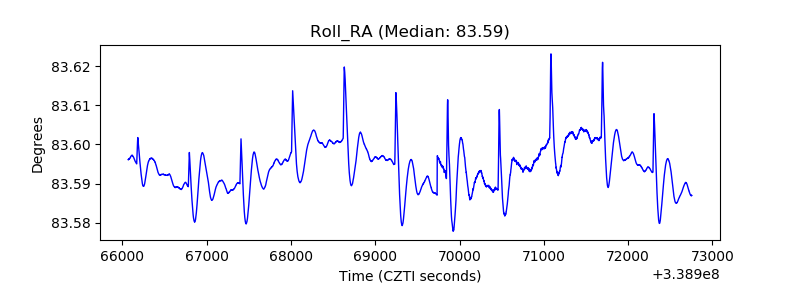 |
| Veto Counter | 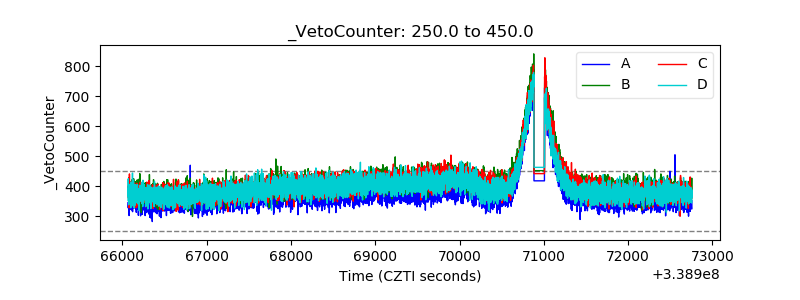 |