| Param | Original file | Final file |
|---|---|---|
| Filename | modeM0/AS1A09_120T02_9000003904_27047cztM0_level2.evt | modeM0/AS1A09_120T02_9000003904_27047cztM0_level2_quad_clean.evt |
| Size (bytes) | 1,671,010,560 | 227,776,320 |
| Size | 1.6 GB | 217.2 MB |
| Events in quadrant A | 19,604,295 | 1,312,156 |
| Events in quadrant B | 9,347,261 | 1,510,563 |
| Events in quadrant C | 8,826,193 | 1,445,573 |
| Events in quadrant D | 11,610,973 | 1,384,127 |
| Mode M9 | |||
|---|---|---|---|
| Quadrant | BADHDUFLAG | Total packets | Discarded packets |
| A | 0 | 17 | 0 |
| B | 0 | 17 | 0 |
| C | 0 | 17 | 0 |
| D | 0 | 17 | 0 |
| Mode M0 | |||
|---|---|---|---|
| Quadrant | BADHDUFLAG | Total packets | Discarded packets |
| A | 0 | 70326 | 0 |
| B | 0 | 38514 | 0 |
| C | 0 | 36968 | 0 |
| D | 0 | 46068 | 0 |
| Quadrant | Total seconds | Saturated seconds | Saturation percentage |
|---|---|---|---|
| A | 18062 | 4051 | 22.428303% |
| B | 18063 | 282 | 1.561202% |
| C | 18063 | 222 | 1.229032% |
| D | 18063 | 664 | 3.676023% |
Noise dominated data is calculated using 1-second bins in cleaned event files. If a bin has >2000 counts, and if more than 50% of those come from <1% of pixels, then it is considered to be noise-dominated and hence unusable.
| Quadrant | # 1 sec bins | Bins with >0 counts | Bins with >2000 counts | High rate bins dominated by noise | Noise dominated (total time) | Noise dominated (detector-on time) | Marked lightcurve |
|---|---|---|---|---|---|---|---|
| A | 19807 | 18062 | 2857 | 2857 | 14.42% | 15.82% | 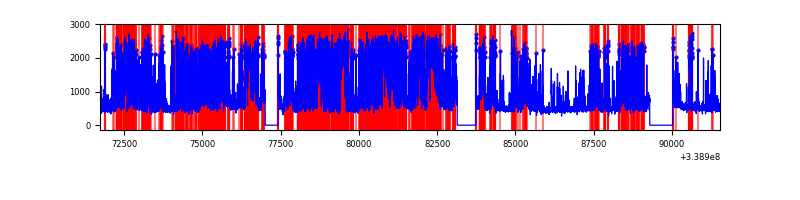 |
| B | 19808 | 18063 | 92 | 92 | 0.46% | 0.51% | 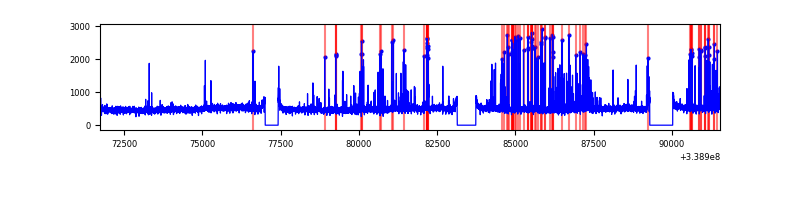 |
| C | 19808 | 18063 | 6 | 6 | 0.03% | 0.03% | 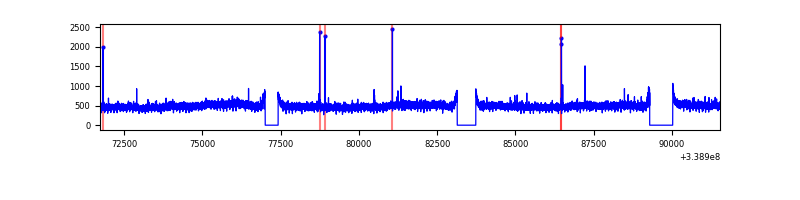 |
| D | 19808 | 18063 | 547 | 547 | 2.76% | 3.03% | 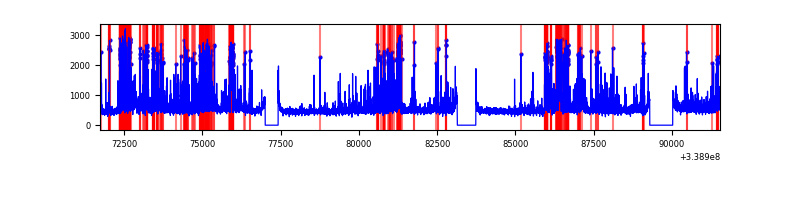 |
Top three noisy pixels from each quadrant. If the there are fewer than three noisy pixels in the level2.evt file, extra rows are filled as -1
| Pixel properties | Quadrant properties | ||||||
|---|---|---|---|---|---|---|---|
| Quadrant | DetID | PixID | Counts | Sigma | Mean | Median | Sigma |
| A | 14 | 235 | 11555876 | 27898.59 | 2061 | 2022 | 414.1 |
| A | 6 | 16 | 53700 | 124.78 | 2061 | 2022 | 414.1 |
| A | 8 | 192 | 43501 | 100.16 | 2061 | 2022 | 414.1 |
| B | 0 | 189 | 388776 | 905.57 | 2233 | 2177 | 426.9 |
| B | 10 | 246 | 104133 | 238.82 | 2233 | 2177 | 426.9 |
| B | 0 | 219 | 55301 | 124.44 | 2233 | 2177 | 426.9 |
| C | 14 | 238 | 343632 | 668.31 | 2161 | 2180 | 510.9 |
| C | 15 | 208 | 39462 | 72.97 | 2161 | 2180 | 510.9 |
| C | 13 | 61 | 14737 | 24.58 | 2161 | 2180 | 510.9 |
| D | 1 | 52 | 2949656 | 5751.48 | 2150 | 2095 | 512.5 |
| D | 2 | 250 | 386224 | 749.54 | 2150 | 2095 | 512.5 |
| D | 2 | 234 | 78185 | 148.47 | 2150 | 2095 | 512.5 |
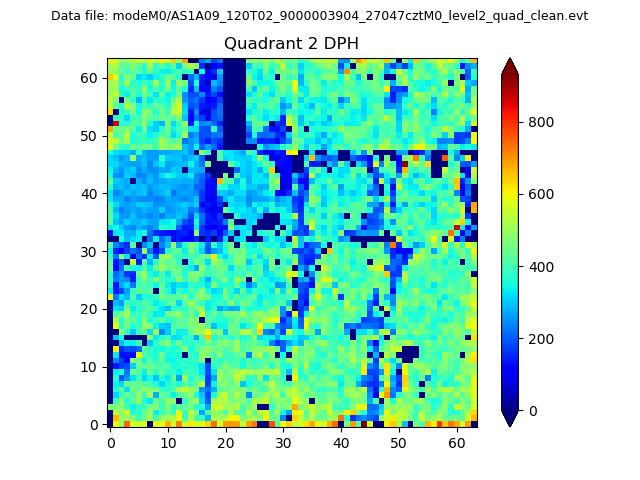
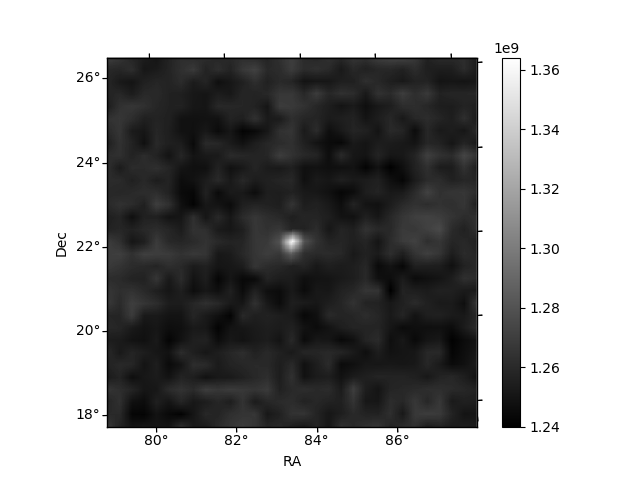
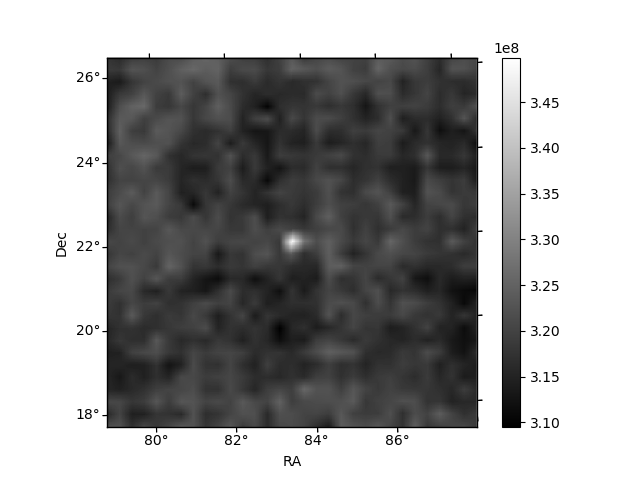
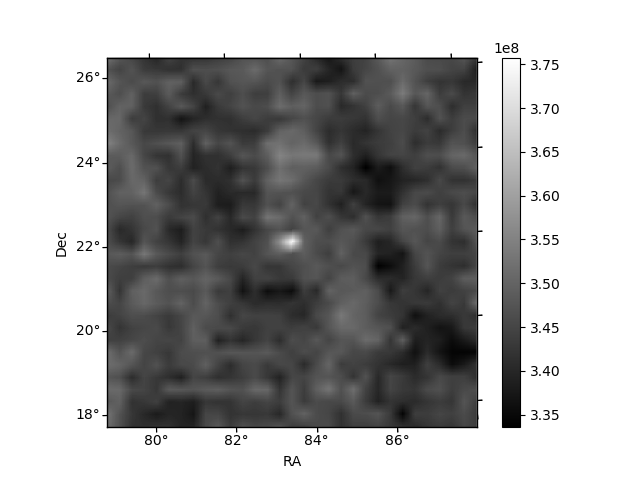
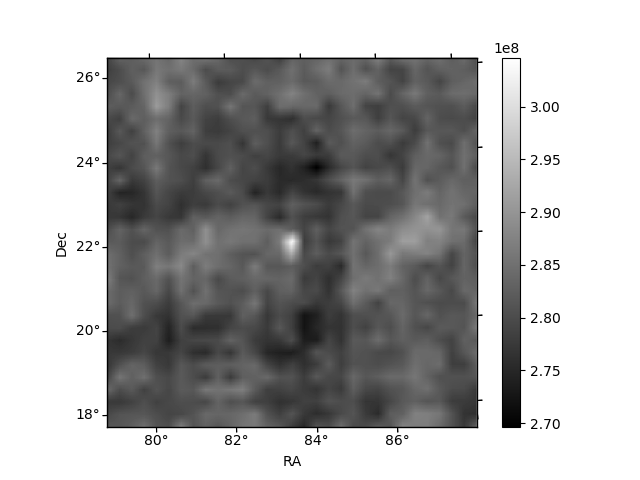
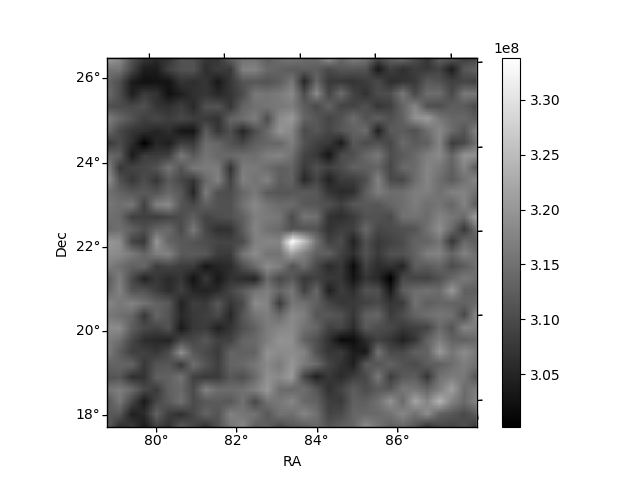
Histogram calculated using DETX and DETY for each event in the final _common_clean file
| Quadrant A | 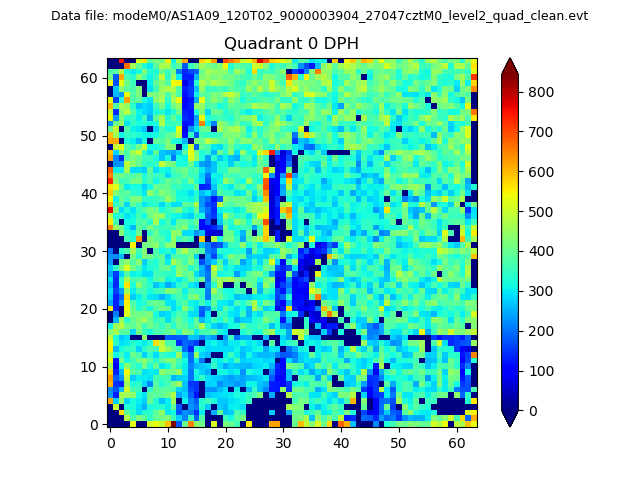 |
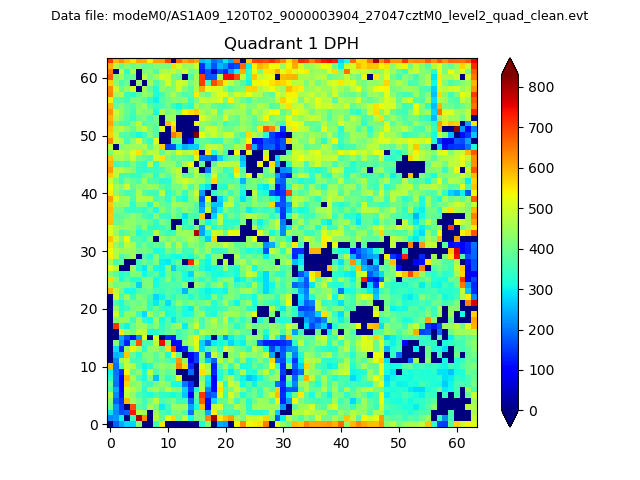 |
Quadrant B |
|---|---|---|---|
| Quadrant D | 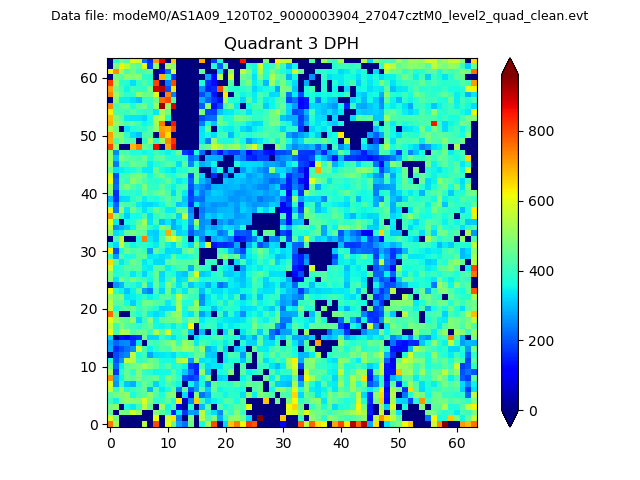 |
 |
Quadrant C |
| Plot type | Count rate plots | Images |
|---|---|---|
| Comparison with Poisson distribution Blue bars denote a histogram of data divided into 1 sec bins. Red curve is a Poisson curve with rate = median count rate of data. |
 |
 |
| Quadrant-wise count rates Data is divided into 100 sec bins |
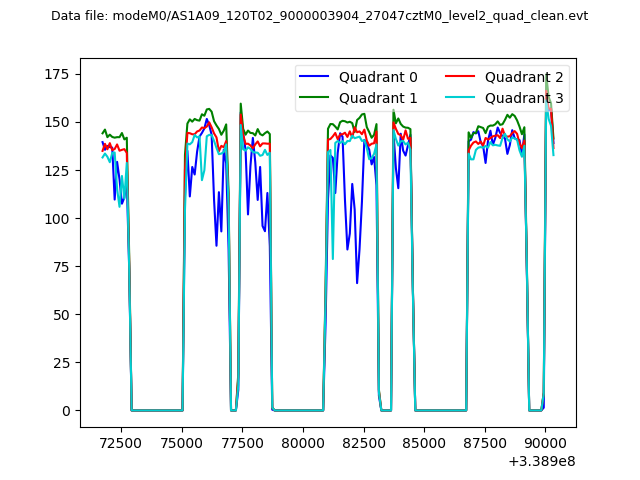 |
|
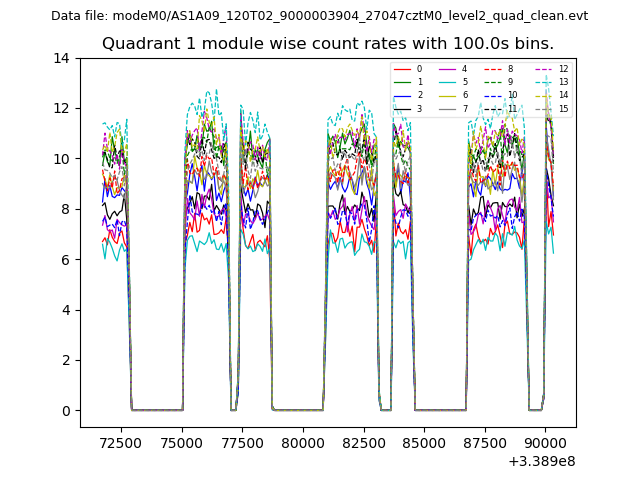
| Module-wise count rates for Quadrant A Data is divided into 100 sec bins |
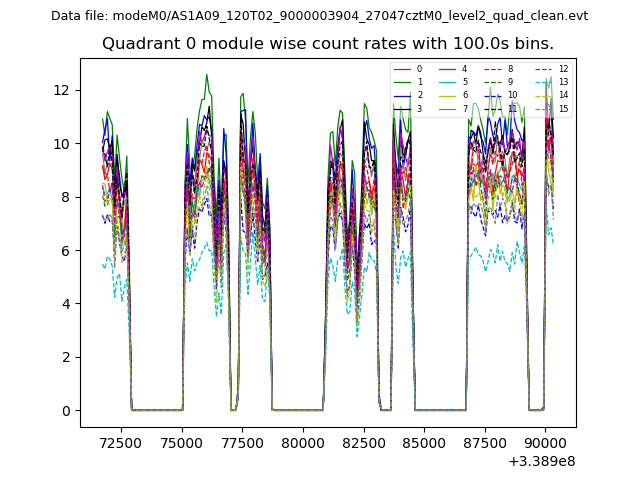 |
 |
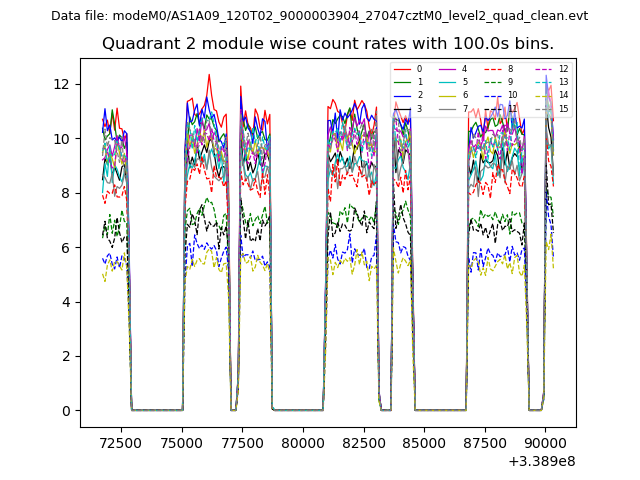
| Module-wise count rates for Quadrant B Data is divided into 100 sec bins |
 |
 |
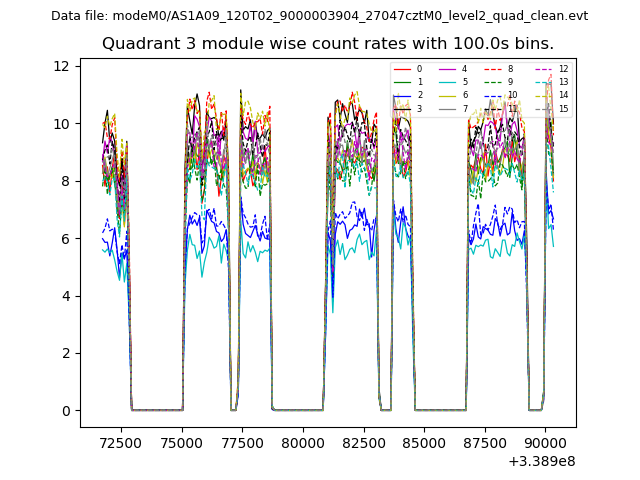
| Module-wise count rates for Quadrant C Data is divided into 100 sec bins |
 |
 |
| Module-wise count rates for Quadrant D Data is divided into 100 sec bins |
 |
 |
| Parameter | Plot |
|---|---|
| CZT HV Monitor | 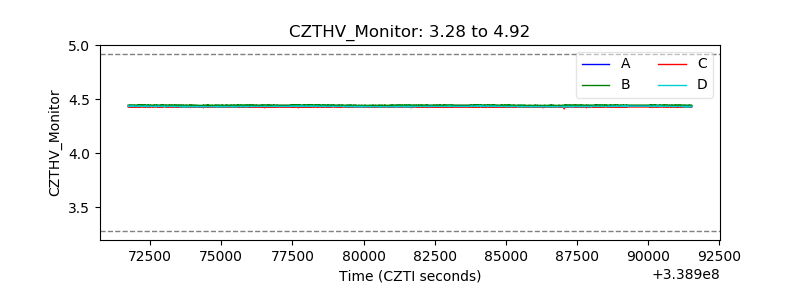 |
| D_VDD | 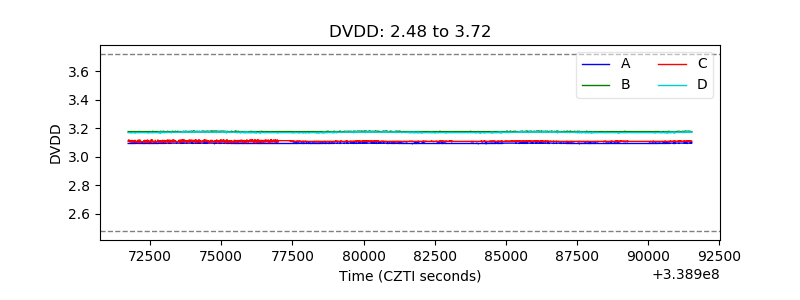 |
| Temperature 1 |  |
| Veto HV Monitor |  |
| Veto LLD |  |
| Alpha Counter | 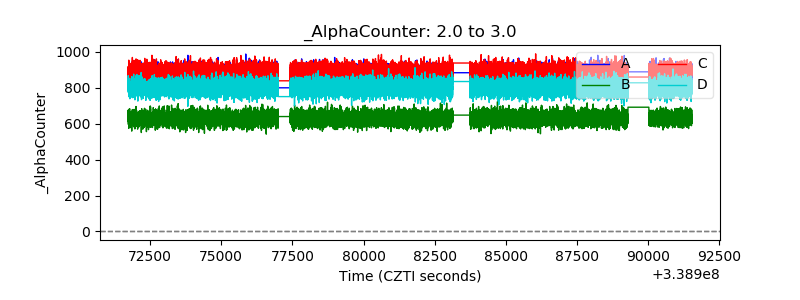 |
| _CPM_Rate | 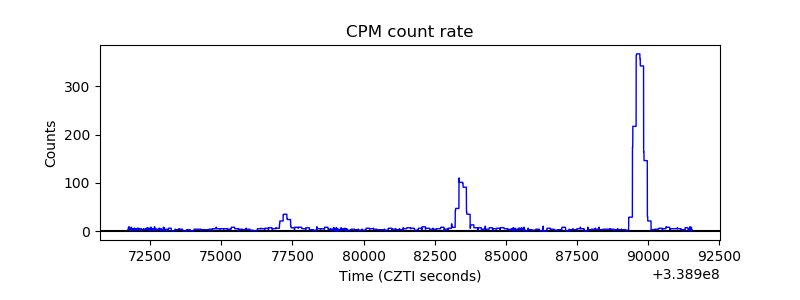 |
| CZT Counter |  |
| +2.5 Volts monitor |  |
| +5 Volts monitor | 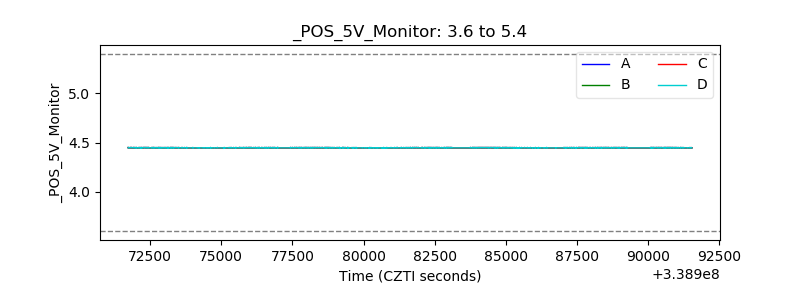 |
| _ROLL_ROT | 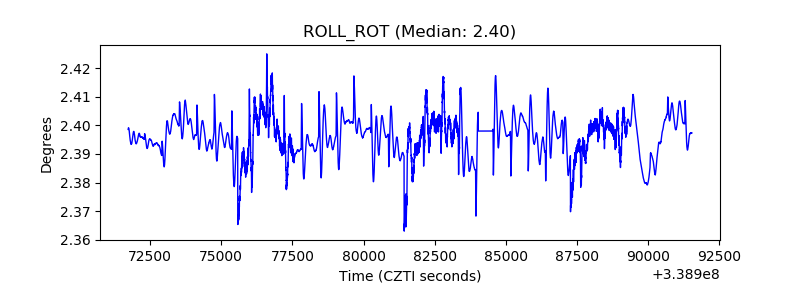 |
| _Roll_DEC | 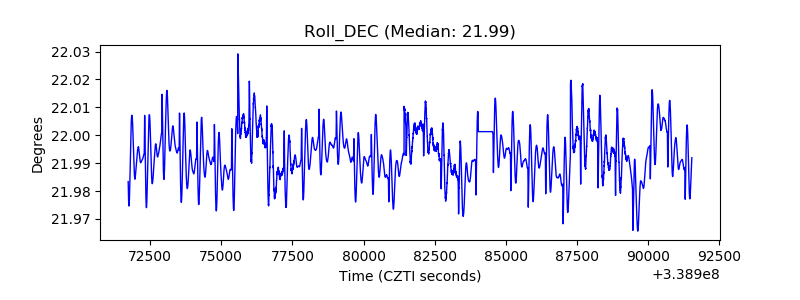 |
| _Roll_RA |  |
| Veto Counter | 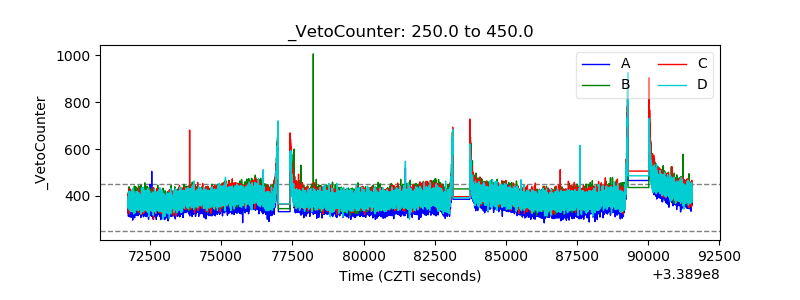 |