| Param | Original file | Final file |
|---|---|---|
| Filename | modeM0/AS1A09_120T02_9000003904_27048cztM0_level2.evt | modeM0/AS1A09_120T02_9000003904_27048cztM0_level2_quad_clean.evt |
| Size (bytes) | 720,429,120 | 71,657,280 |
| Size | 687.1 MB | 68.3 MB |
| Events in quadrant A | 6,716,982 | 384,914 |
| Events in quadrant B | 6,526,633 | 444,858 |
| Events in quadrant C | 3,432,582 | 440,053 |
| Events in quadrant D | 4,680,630 | 423,939 |
| Mode M9 | |||
|---|---|---|---|
| Quadrant | BADHDUFLAG | Total packets | Discarded packets |
| A | 0 | 9 | 0 |
| B | 0 | 9 | 0 |
| C | 0 | 9 | 0 |
| D | 0 | 9 | 0 |
| Mode M0 | |||
|---|---|---|---|
| Quadrant | BADHDUFLAG | Total packets | Discarded packets |
| A | 0 | 24430 | 0 |
| B | 0 | 23613 | 0 |
| C | 0 | 14150 | 0 |
| D | 0 | 18320 | 0 |
| Quadrant | Total seconds | Saturated seconds | Saturation percentage |
|---|---|---|---|
| A | 6821 | 1359 | 19.923765% |
| B | 6822 | 1423 | 20.858986% |
| C | 6822 | 104 | 1.524480% |
| D | 6822 | 202 | 2.961009% |
Noise dominated data is calculated using 1-second bins in cleaned event files. If a bin has >2000 counts, and if more than 50% of those come from <1% of pixels, then it is considered to be noise-dominated and hence unusable.
| Quadrant | # 1 sec bins | Bins with >0 counts | Bins with >2000 counts | High rate bins dominated by noise | Noise dominated (total time) | Noise dominated (detector-on time) | Marked lightcurve |
|---|---|---|---|---|---|---|---|
| A | 7746 | 6821 | 898 | 898 | 11.59% | 13.17% | 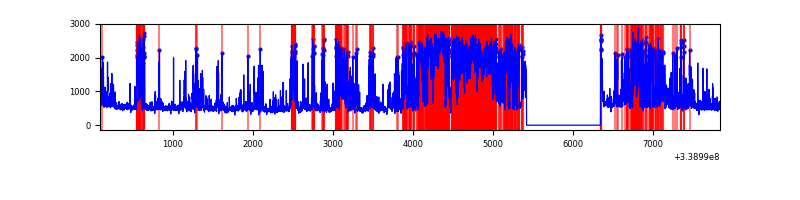 |
| B | 7746 | 6821 | 1077 | 1077 | 13.90% | 15.79% | 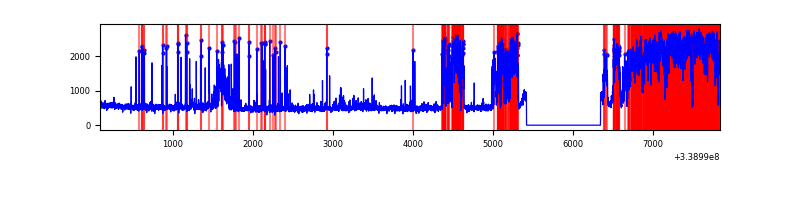 |
| C | 7747 | 6822 | 0 | 0 | 0.00% | 0.00% | 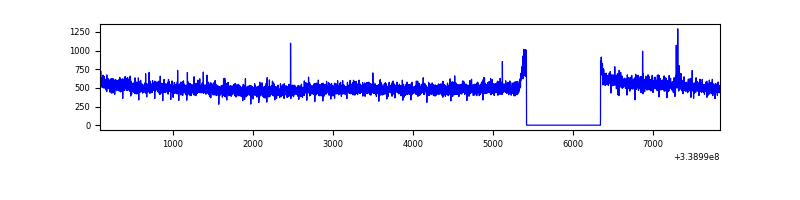 |
| D | 7747 | 6822 | 148 | 148 | 1.91% | 2.17% | 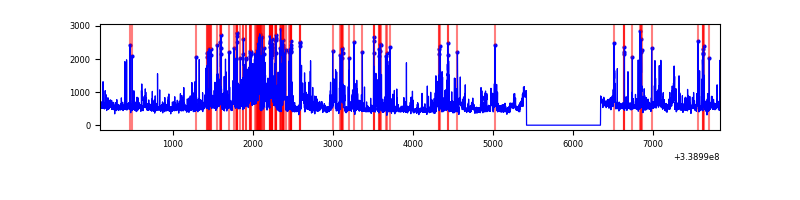 |
Top three noisy pixels from each quadrant. If the there are fewer than three noisy pixels in the level2.evt file, extra rows are filled as -1
| Pixel properties | Quadrant properties | ||||||
|---|---|---|---|---|---|---|---|
| Quadrant | DetID | PixID | Counts | Sigma | Mean | Median | Sigma |
| A | 14 | 235 | 3560101 | 21797.97 | 812 | 794 | 163.3 |
| A | 8 | 192 | 15512 | 90.14 | 812 | 794 | 163.3 |
| A | 13 | 254 | 10505 | 59.47 | 812 | 794 | 163.3 |
| B | 0 | 189 | 3087688 | 19536.69 | 817 | 799 | 158.0 |
| B | 10 | 246 | 145154 | 913.61 | 817 | 799 | 158.0 |
| B | 3 | 112 | 46447 | 288.9 | 817 | 799 | 158.0 |
| C | 14 | 238 | 136276 | 682.35 | 842 | 850 | 198.5 |
| C | 15 | 208 | 10480 | 48.52 | 842 | 850 | 198.5 |
| C | 13 | 61 | 5733 | 24.6 | 842 | 850 | 198.5 |
| D | 1 | 52 | 995969 | 4892.41 | 845 | 823 | 203.4 |
| D | 2 | 250 | 447163 | 2194.33 | 845 | 823 | 203.4 |
| D | 2 | 234 | 29876 | 142.83 | 845 | 823 | 203.4 |
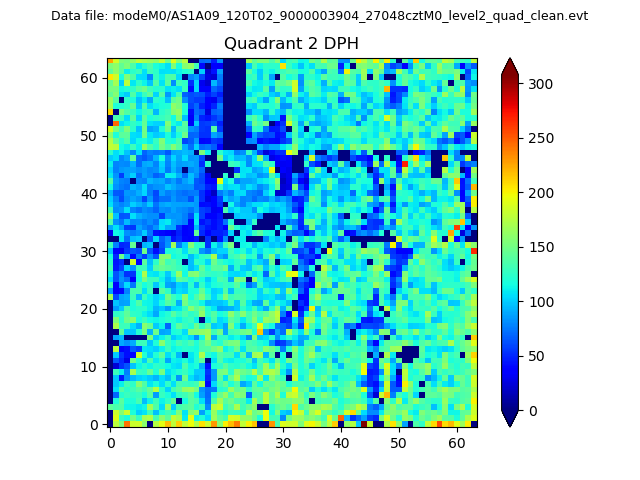
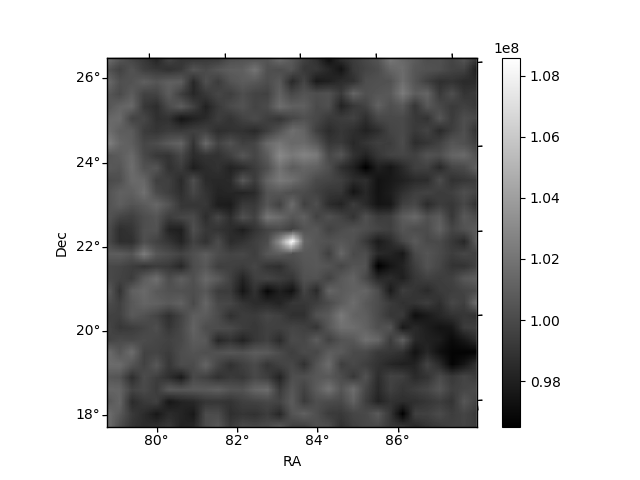
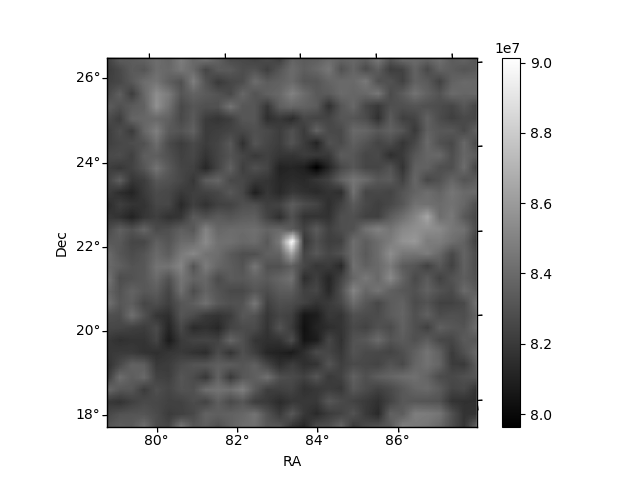
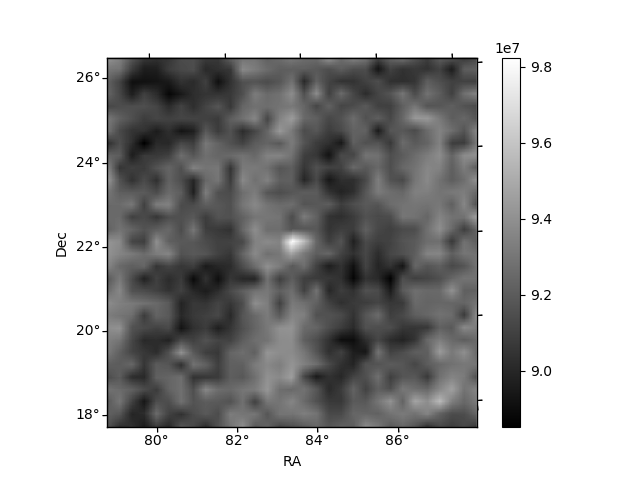
Histogram calculated using DETX and DETY for each event in the final _common_clean file
| Quadrant A | 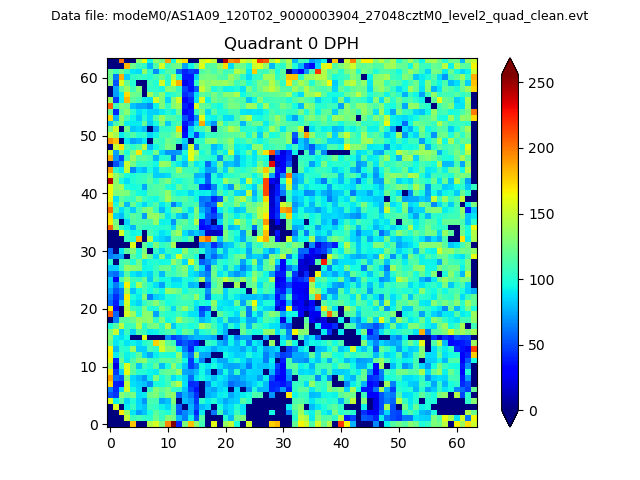 |
 |
Quadrant B |
|---|---|---|---|
| Quadrant D |  |
 |
Quadrant C |
| Plot type | Count rate plots | Images |
|---|---|---|
| Comparison with Poisson distribution Blue bars denote a histogram of data divided into 1 sec bins. Red curve is a Poisson curve with rate = median count rate of data. |
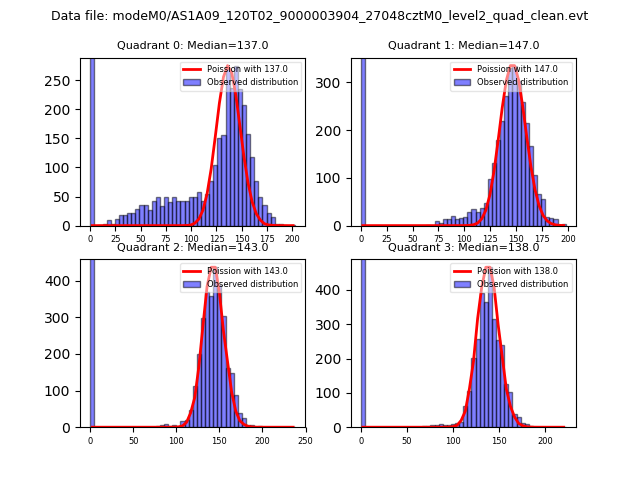 |
 |
| Quadrant-wise count rates Data is divided into 100 sec bins |
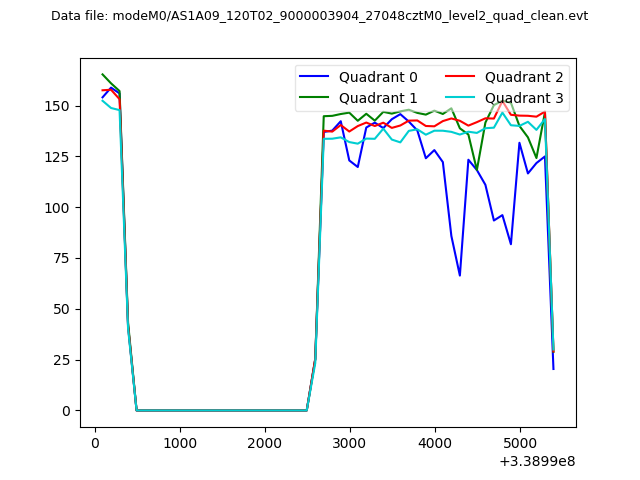 |
|
| Module-wise count rates for Quadrant A Data is divided into 100 sec bins |
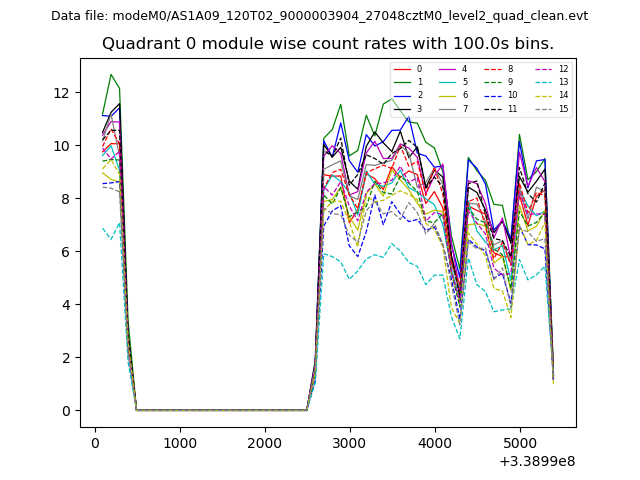 |
 |
| Module-wise count rates for Quadrant B Data is divided into 100 sec bins |
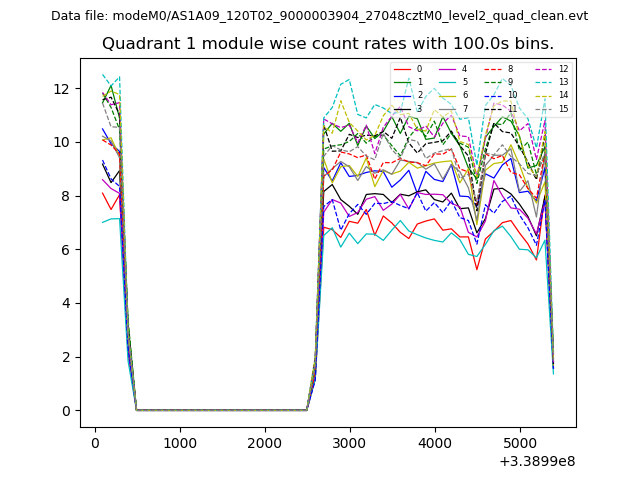 |
 |
| Module-wise count rates for Quadrant C Data is divided into 100 sec bins |
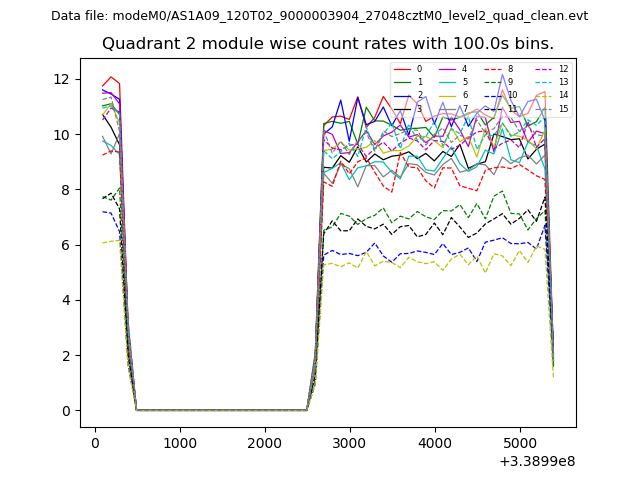 |
 |
| Module-wise count rates for Quadrant D Data is divided into 100 sec bins |
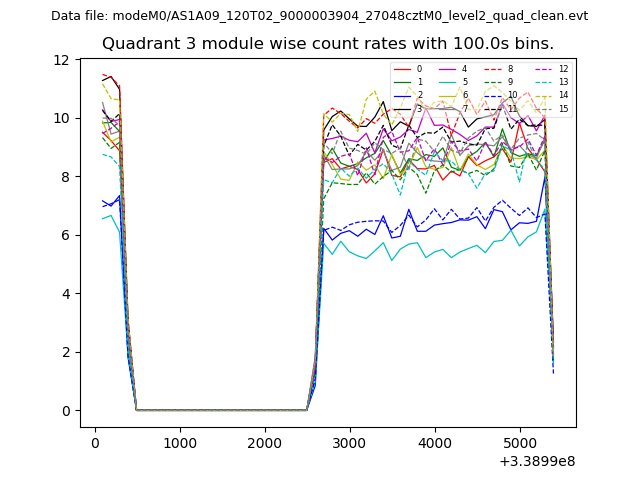 |
 |
| Parameter | Plot |
|---|---|
| CZT HV Monitor |  |
| D_VDD | 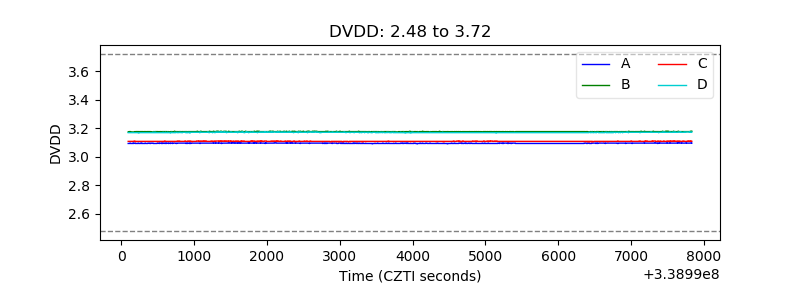 |
| Temperature 1 | 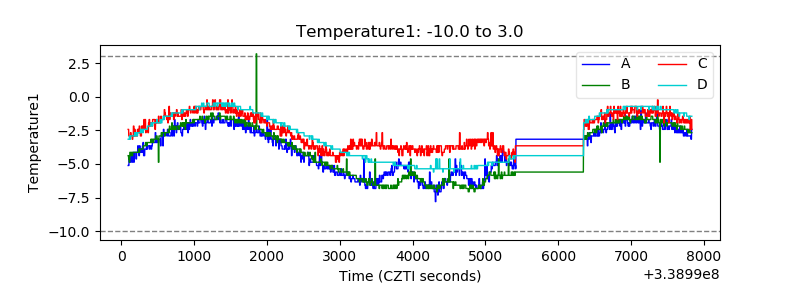 |
| Veto HV Monitor | 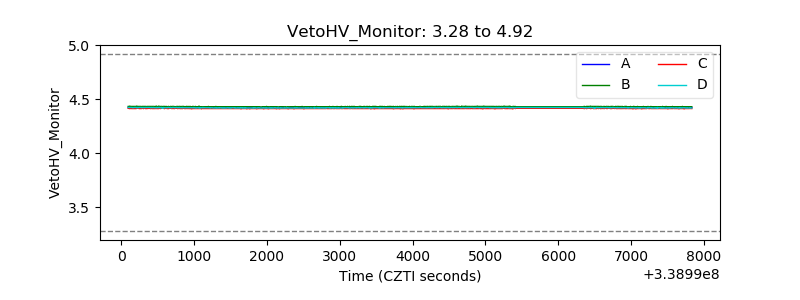 |
| Veto LLD | 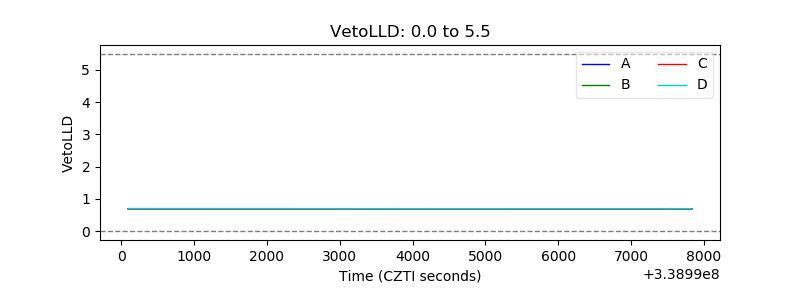 |
| Alpha Counter | 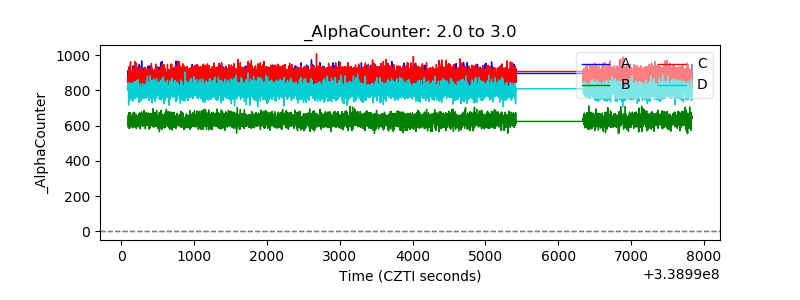 |
| _CPM_Rate | 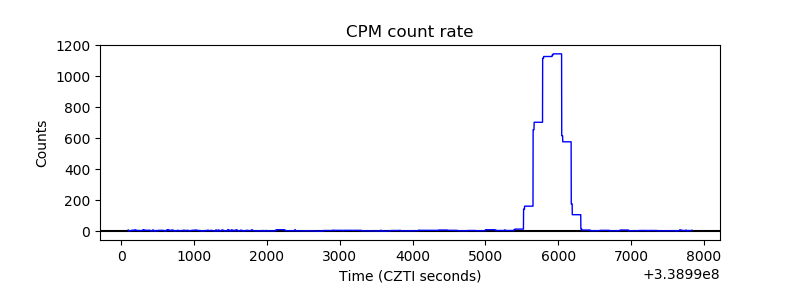 |
| CZT Counter | 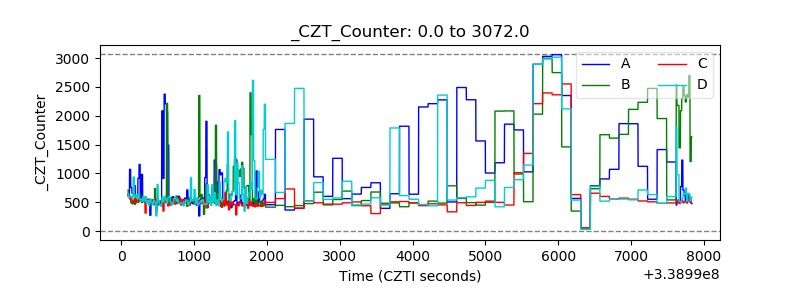 |
| +2.5 Volts monitor |  |
| +5 Volts monitor |  |
| _ROLL_ROT | 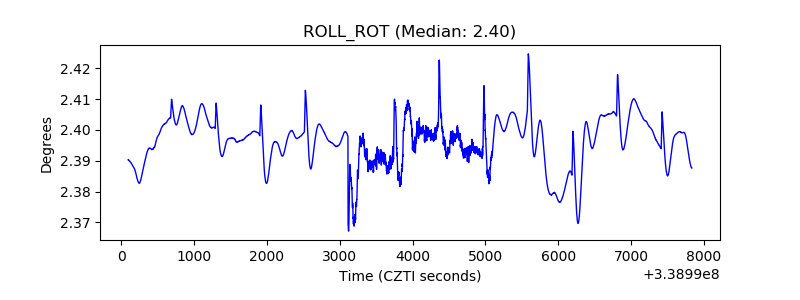 |
| _Roll_DEC | 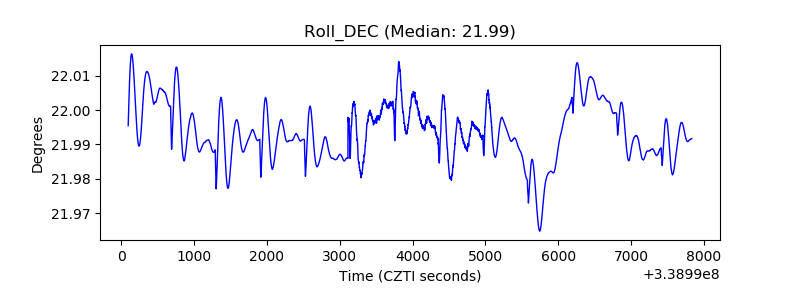 |
| _Roll_RA | 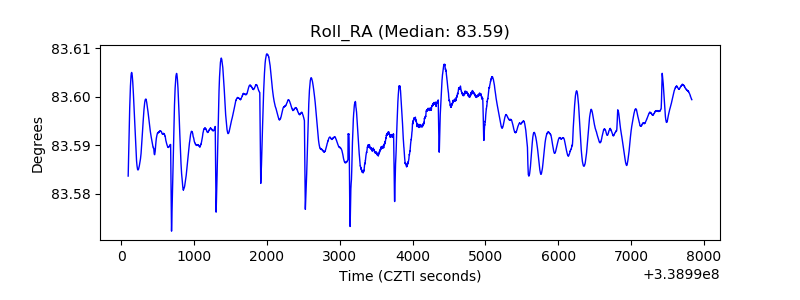 |
| Veto Counter | 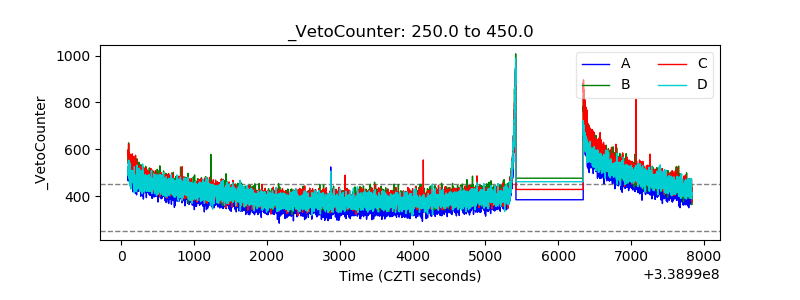 |