| Param | Original file | Final file |
|---|---|---|
| Filename | modeM0/AS1A09_120T02_9000003904_27049cztM0_level2.evt | modeM0/AS1A09_120T02_9000003904_27049cztM0_level2_quad_clean.evt |
| Size (bytes) | 716,659,200 | 67,305,600 |
| Size | 683.5 MB | 64.2 MB |
| Events in quadrant A | 7,729,301 | 328,857 |
| Events in quadrant B | 6,649,513 | 428,652 |
| Events in quadrant C | 3,101,991 | 437,954 |
| Events in quadrant D | 3,821,065 | 426,069 |
| Mode M9 | |||
|---|---|---|---|
| Quadrant | BADHDUFLAG | Total packets | Discarded packets |
| A | 0 | 11 | 0 |
| B | 0 | 11 | 0 |
| C | 0 | 11 | 0 |
| D | 0 | 11 | 0 |
| Mode M0 | |||
|---|---|---|---|
| Quadrant | BADHDUFLAG | Total packets | Discarded packets |
| A | 0 | 26966 | 0 |
| B | 0 | 23561 | 0 |
| C | 0 | 12801 | 0 |
| D | 0 | 15381 | 0 |
| Quadrant | Total seconds | Saturated seconds | Saturation percentage |
|---|---|---|---|
| A | 5946 | 1939 | 32.610158% |
| B | 5947 | 1855 | 31.192198% |
| C | 5947 | 90 | 1.513368% |
| D | 5947 | 133 | 2.236422% |
Noise dominated data is calculated using 1-second bins in cleaned event files. If a bin has >2000 counts, and if more than 50% of those come from <1% of pixels, then it is considered to be noise-dominated and hence unusable.
| Quadrant | # 1 sec bins | Bins with >0 counts | Bins with >2000 counts | High rate bins dominated by noise | Noise dominated (total time) | Noise dominated (detector-on time) | Marked lightcurve |
|---|---|---|---|---|---|---|---|
| A | 7001 | 5946 | 1669 | 1669 | 23.84% | 28.07% | 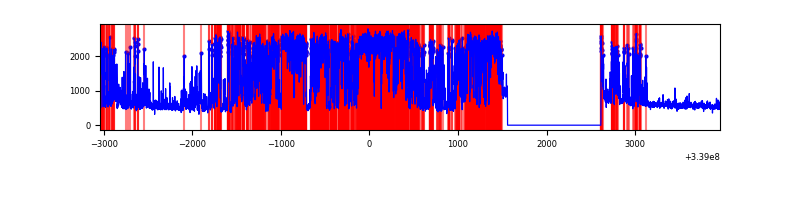 |
| B | 7002 | 5947 | 1627 | 1627 | 23.24% | 27.36% | 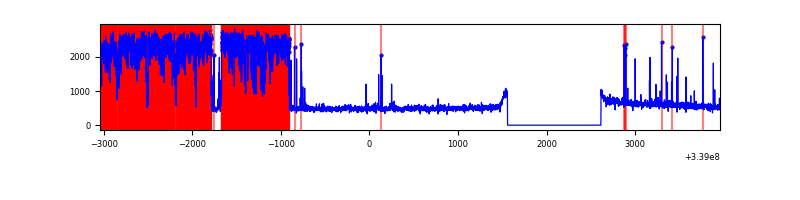 |
| C | 7002 | 5947 | 0 | 0 | 0.00% | 0.00% | 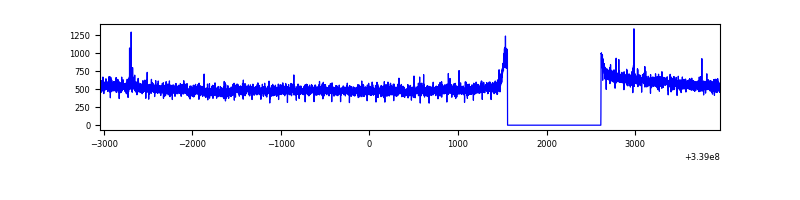 |
| D | 7002 | 5947 | 77 | 77 | 1.10% | 1.29% | 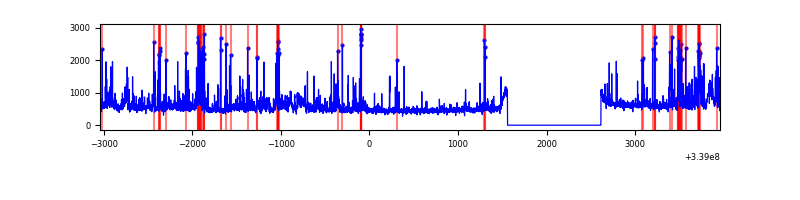 |
Top three noisy pixels from each quadrant. If the there are fewer than three noisy pixels in the level2.evt file, extra rows are filled as -1
| Pixel properties | Quadrant properties | ||||||
|---|---|---|---|---|---|---|---|
| Quadrant | DetID | PixID | Counts | Sigma | Mean | Median | Sigma |
| A | 14 | 235 | 5051679 | 36545.56 | 684 | 673 | 138.2 |
| A | 8 | 192 | 18827 | 131.35 | 684 | 673 | 138.2 |
| A | 12 | 16 | 9572 | 64.39 | 684 | 673 | 138.2 |
| B | 0 | 189 | 3827405 | 28504.33 | 703 | 685 | 134.3 |
| B | 3 | 112 | 56282 | 414.13 | 703 | 685 | 134.3 |
| B | 12 | 111 | 15549 | 110.72 | 703 | 685 | 134.3 |
| C | 14 | 238 | 122538 | 685.67 | 760 | 767 | 177.6 |
| C | 15 | 208 | 10736 | 56.13 | 760 | 767 | 177.6 |
| C | 14 | 67 | 7184 | 36.13 | 760 | 767 | 177.6 |
| D | 1 | 52 | 560261 | 3092.47 | 760 | 742 | 180.9 |
| D | 2 | 250 | 353075 | 1947.35 | 760 | 742 | 180.9 |
| D | 2 | 234 | 27629 | 148.6 | 760 | 742 | 180.9 |
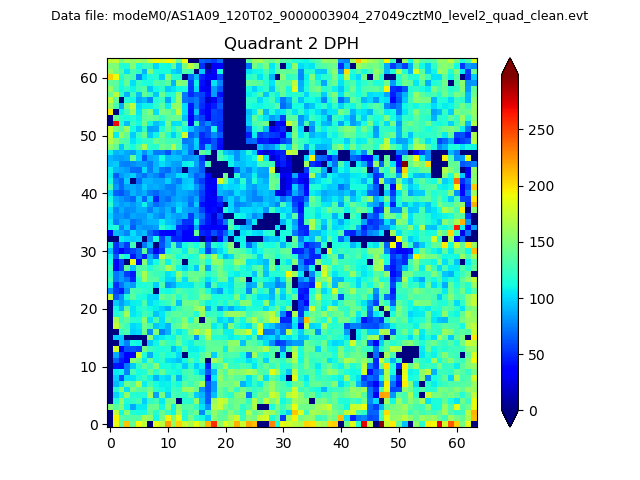
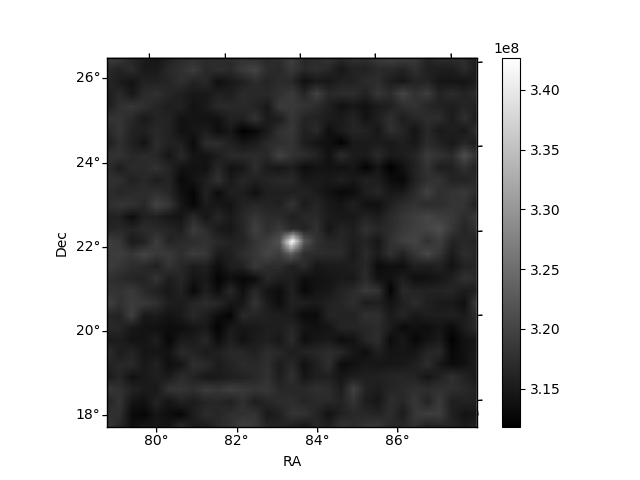
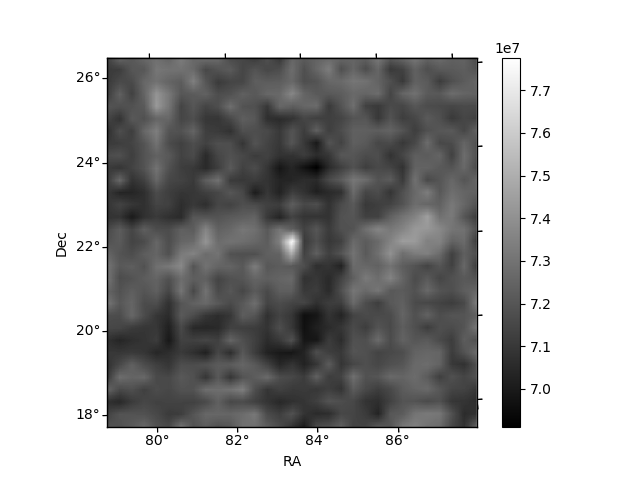
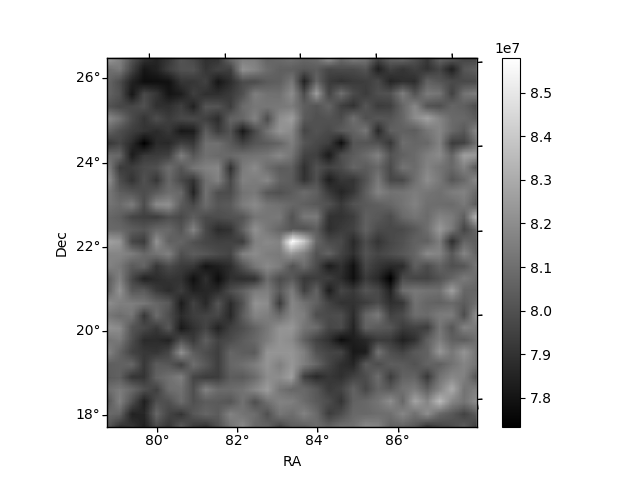
Histogram calculated using DETX and DETY for each event in the final _common_clean file
| Quadrant A | 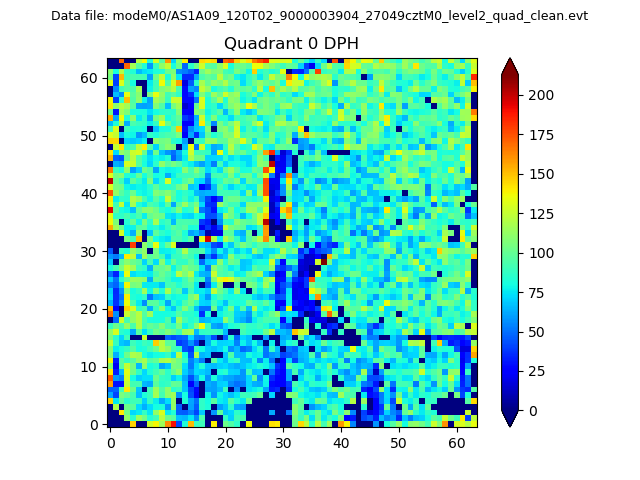 |
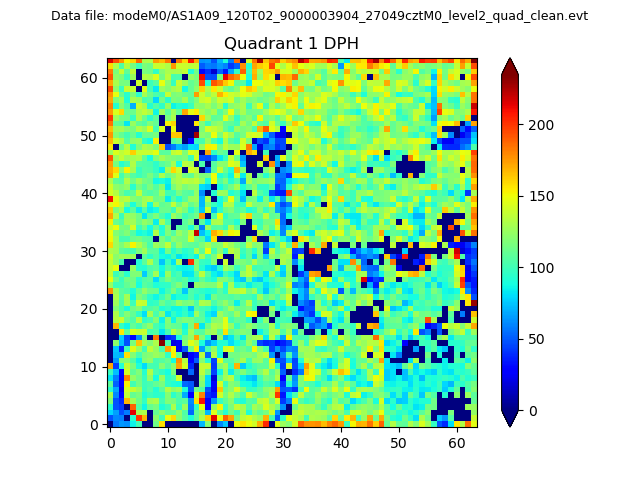 |
Quadrant B |
|---|---|---|---|
| Quadrant D | 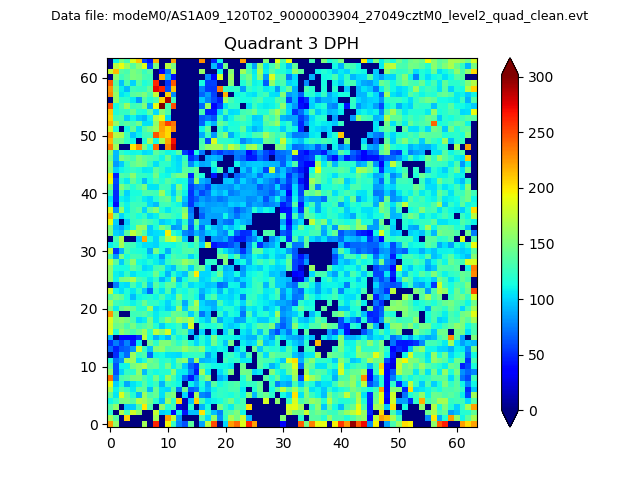 |
 |
Quadrant C |
| Plot type | Count rate plots | Images |
|---|---|---|
| Comparison with Poisson distribution Blue bars denote a histogram of data divided into 1 sec bins. Red curve is a Poisson curve with rate = median count rate of data. |
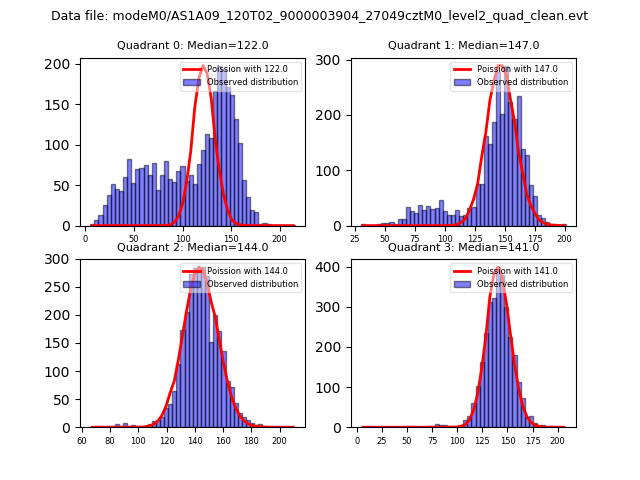 |
 |
| Quadrant-wise count rates Data is divided into 100 sec bins |
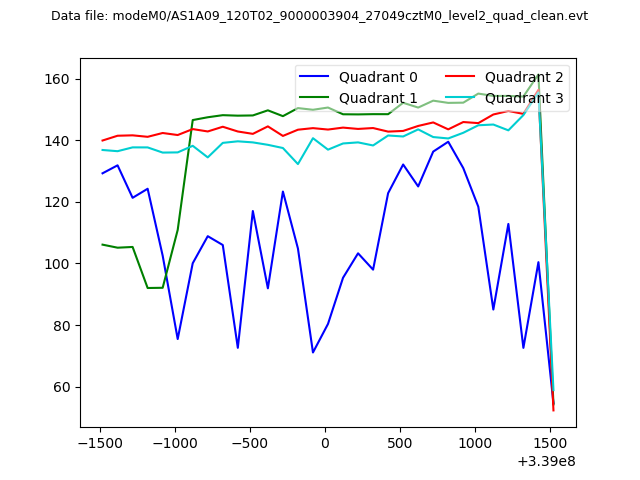 |
|
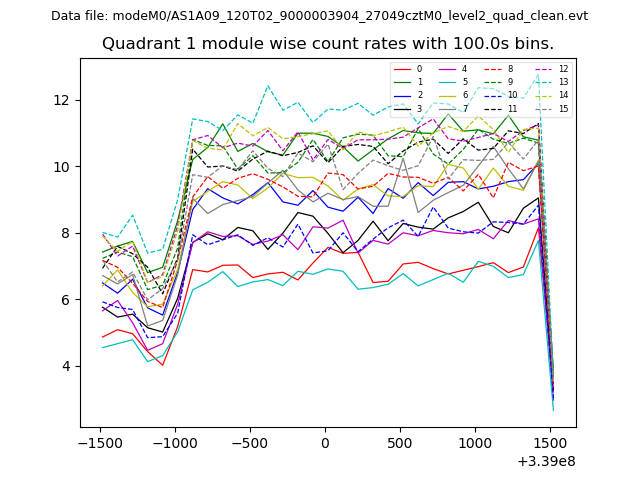
| Module-wise count rates for Quadrant A Data is divided into 100 sec bins |
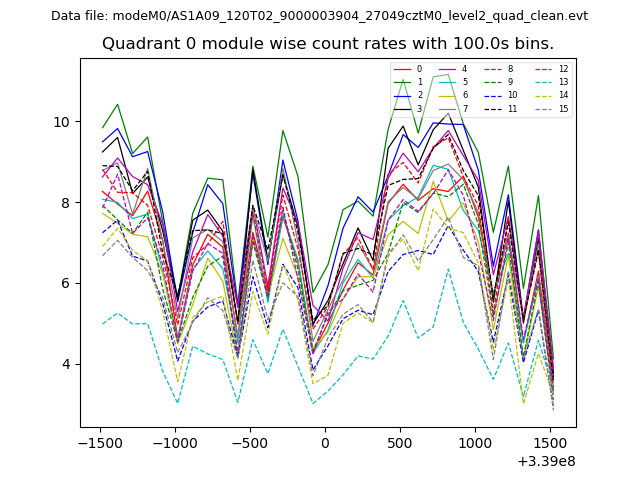 |
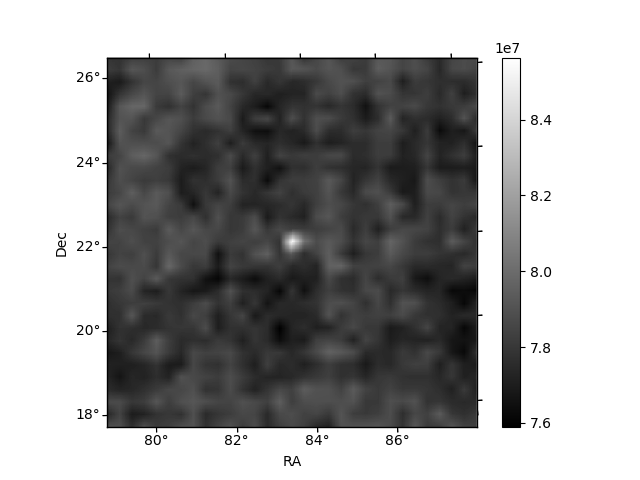 |
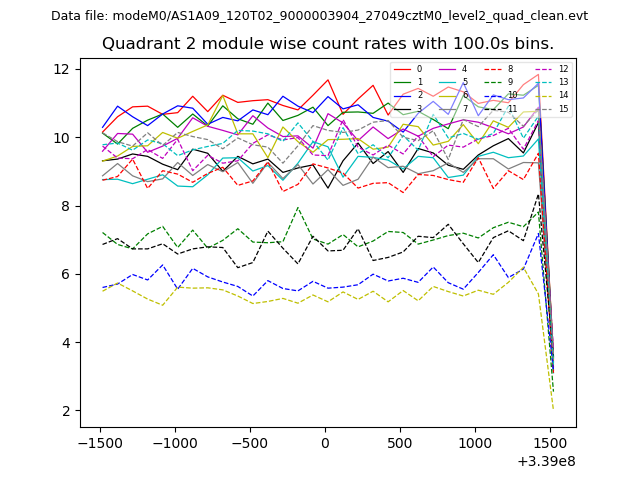
| Module-wise count rates for Quadrant B Data is divided into 100 sec bins |
 |
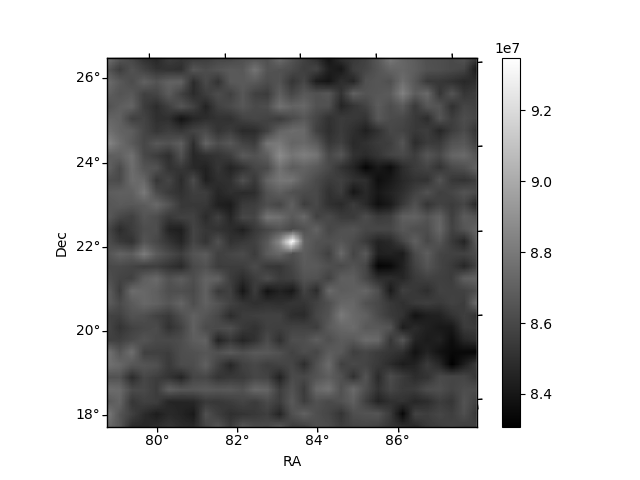 |
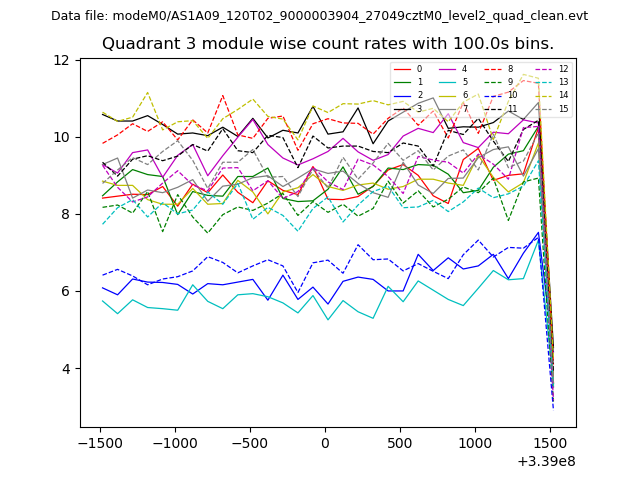
| Module-wise count rates for Quadrant C Data is divided into 100 sec bins |
 |
 |
| Module-wise count rates for Quadrant D Data is divided into 100 sec bins |
 |
 |
| Parameter | Plot |
|---|---|
| CZT HV Monitor | 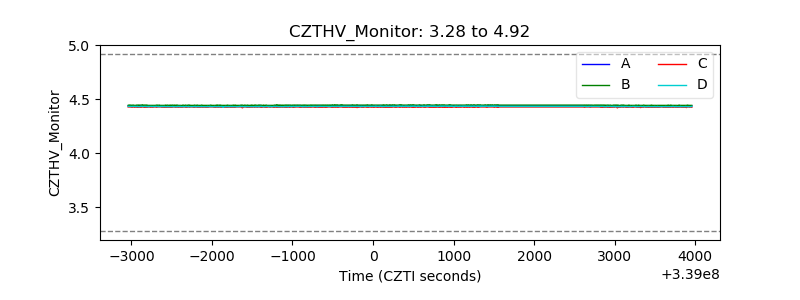 |
| D_VDD | 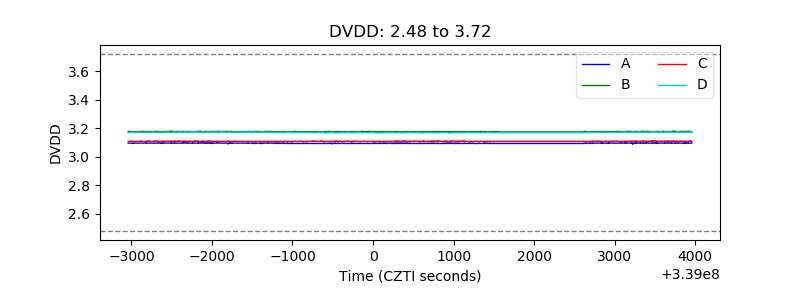 |
| Temperature 1 | 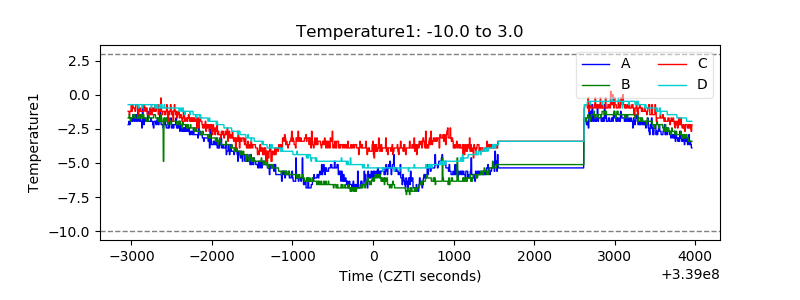 |
| Veto HV Monitor | 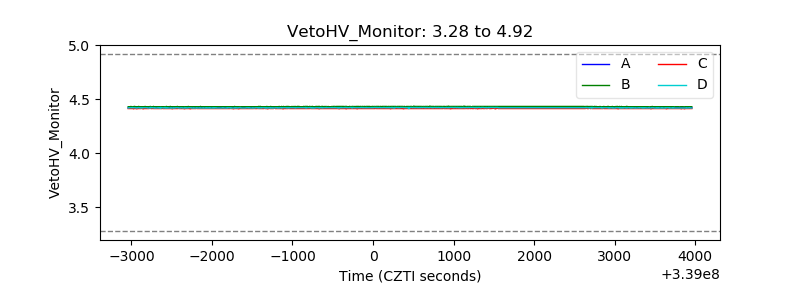 |
| Veto LLD | 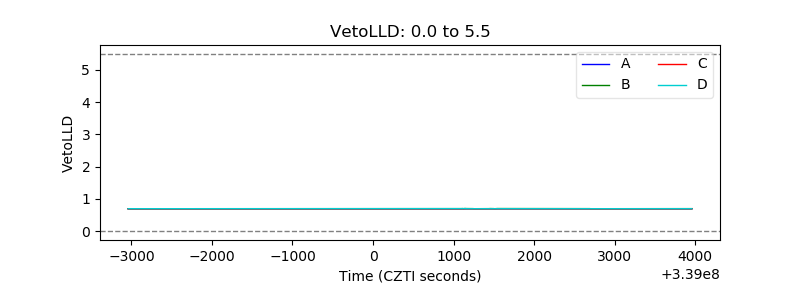 |
| Alpha Counter | 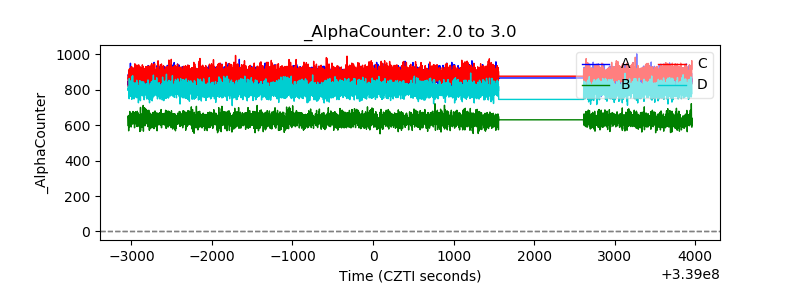 |
| _CPM_Rate | 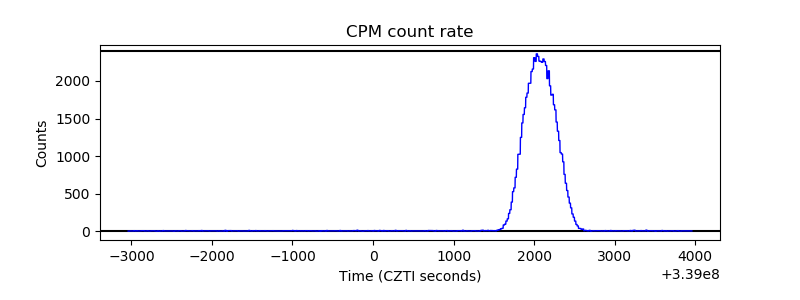 |
| CZT Counter | 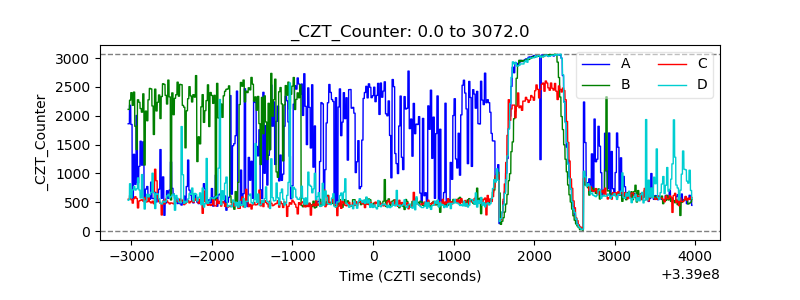 |
| +2.5 Volts monitor | 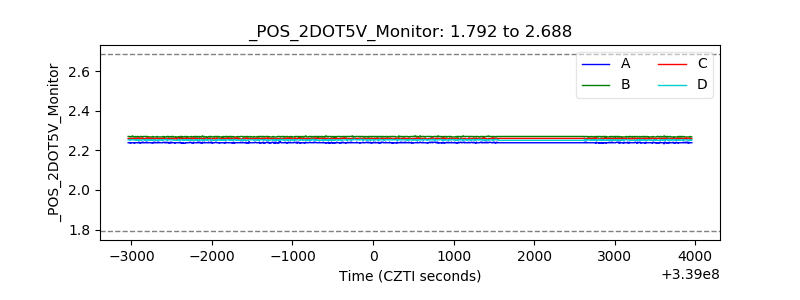 |
| +5 Volts monitor | 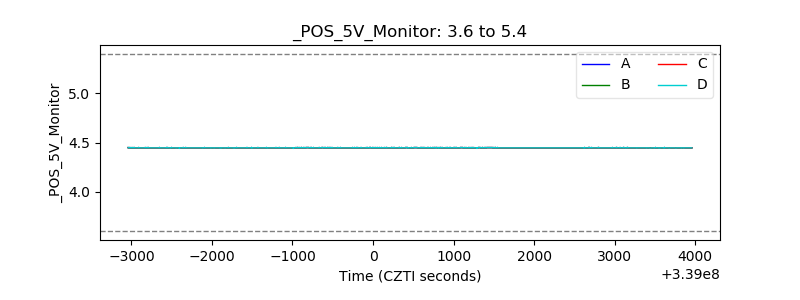 |
| _ROLL_ROT | 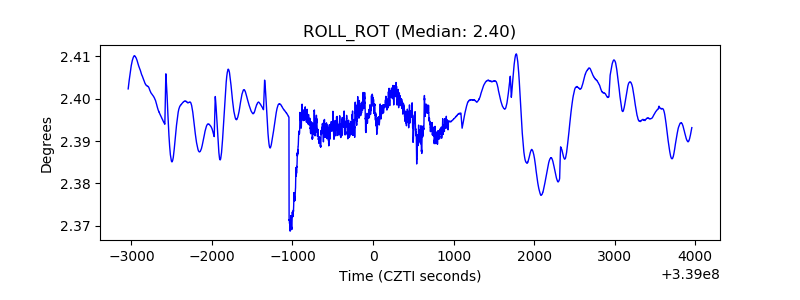 |
| _Roll_DEC | 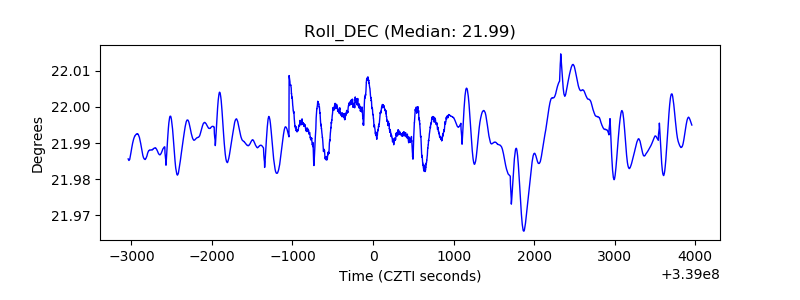 |
| _Roll_RA | 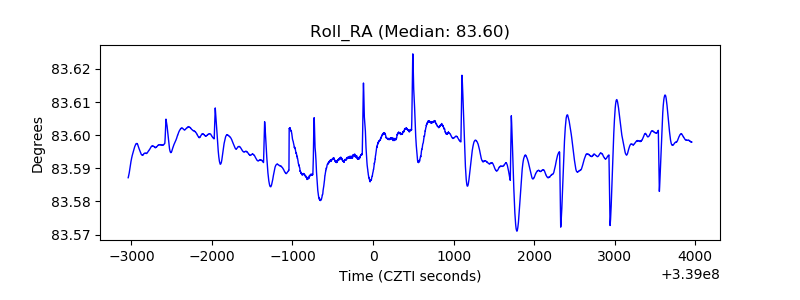 |
| Veto Counter | 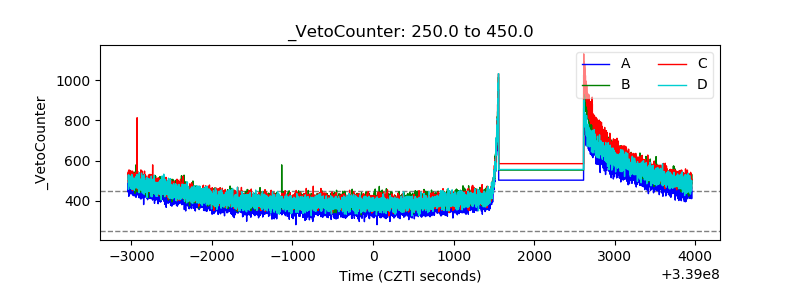 |