| Param | Original file | Final file |
|---|---|---|
| Filename | modeM0/AS1A09_120T02_9000003904_27051cztM0_level2.evt | modeM0/AS1A09_120T02_9000003904_27051cztM0_level2_quad_clean.evt |
| Size (bytes) | 712,759,680 | 78,145,920 |
| Size | 679.7 MB | 74.5 MB |
| Events in quadrant A | 6,484,751 | 434,855 |
| Events in quadrant B | 7,206,729 | 484,894 |
| Events in quadrant C | 3,569,949 | 505,033 |
| Events in quadrant D | 3,889,492 | 492,227 |
| Mode M9 | |||
|---|---|---|---|
| Quadrant | BADHDUFLAG | Total packets | Discarded packets |
| A | 0 | 18 | 0 |
| B | 0 | 19 | 0 |
| C | 0 | 19 | 0 |
| D | 0 | 19 | 0 |
| Mode M0 | |||
|---|---|---|---|
| Quadrant | BADHDUFLAG | Total packets | Discarded packets |
| A | 0 | 23630 | 0 |
| B | 0 | 25555 | 0 |
| C | 0 | 14665 | 0 |
| D | 0 | 15980 | 0 |
| Quadrant | Total seconds | Saturated seconds | Saturation percentage |
|---|---|---|---|
| A | 6431 | 1174 | 18.255326% |
| B | 6430 | 1874 | 29.144635% |
| C | 6430 | 122 | 1.897356% |
| D | 6430 | 124 | 1.928460% |
Noise dominated data is calculated using 1-second bins in cleaned event files. If a bin has >2000 counts, and if more than 50% of those come from <1% of pixels, then it is considered to be noise-dominated and hence unusable.
| Quadrant | # 1 sec bins | Bins with >0 counts | Bins with >2000 counts | High rate bins dominated by noise | Noise dominated (total time) | Noise dominated (detector-on time) | Marked lightcurve |
|---|---|---|---|---|---|---|---|
| A | 7606 | 6431 | 930 | 930 | 12.23% | 14.46% | 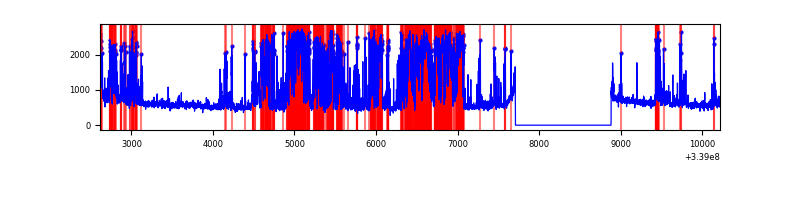 |
| B | 7605 | 6430 | 1549 | 1549 | 20.37% | 24.09% | 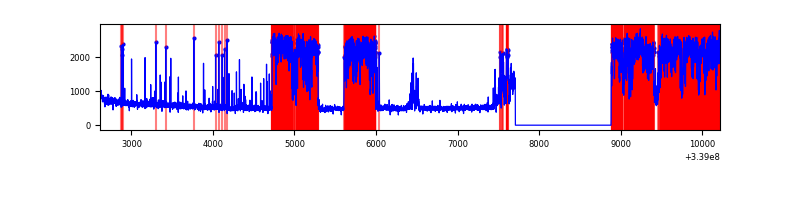 |
| C | 7604 | 6429 | 0 | 0 | 0.00% | 0.00% | 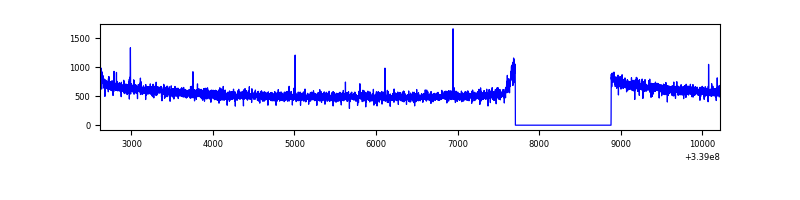 |
| D | 7605 | 6430 | 57 | 57 | 0.75% | 0.89% | 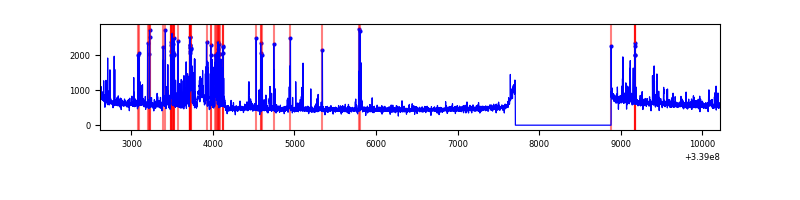 |
Top three noisy pixels from each quadrant. If the there are fewer than three noisy pixels in the level2.evt file, extra rows are filled as -1
| Pixel properties | Quadrant properties | ||||||
|---|---|---|---|---|---|---|---|
| Quadrant | DetID | PixID | Counts | Sigma | Mean | Median | Sigma |
| A | 14 | 235 | 3216900 | 19558.14 | 832 | 821 | 164.4 |
| A | 6 | 16 | 29638 | 175.25 | 832 | 821 | 164.4 |
| A | 8 | 192 | 19017 | 110.66 | 832 | 821 | 164.4 |
| B | 0 | 189 | 3959411 | 26023.93 | 813 | 797 | 152.1 |
| B | 3 | 112 | 43356 | 279.78 | 813 | 797 | 152.1 |
| B | 12 | 111 | 17405 | 109.18 | 813 | 797 | 152.1 |
| C | 14 | 238 | 141130 | 691.79 | 875 | 884 | 202.7 |
| C | 2 | 16 | 8134 | 35.76 | 875 | 884 | 202.7 |
| C | 15 | 208 | 7096 | 30.64 | 875 | 884 | 202.7 |
| D | 2 | 250 | 394490 | 1898.29 | 876 | 856 | 207.4 |
| D | 1 | 52 | 142305 | 682.13 | 876 | 856 | 207.4 |
| D | 2 | 234 | 29548 | 138.36 | 876 | 856 | 207.4 |
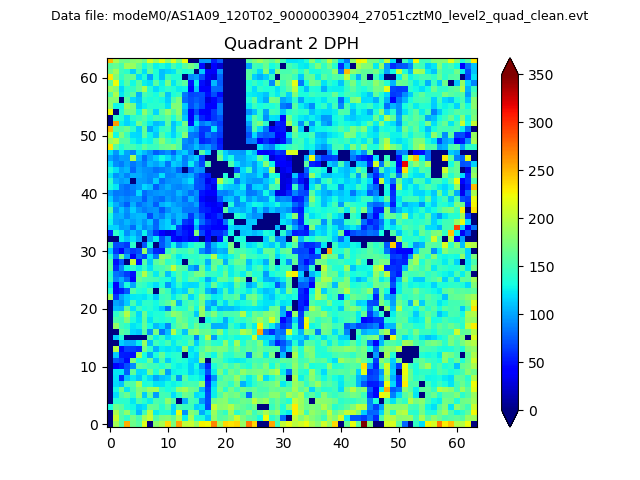
Histogram calculated using DETX and DETY for each event in the final _common_clean file
| Quadrant A | 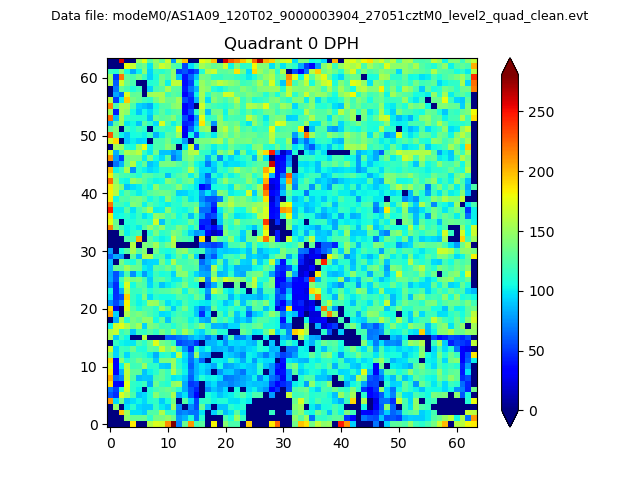 |
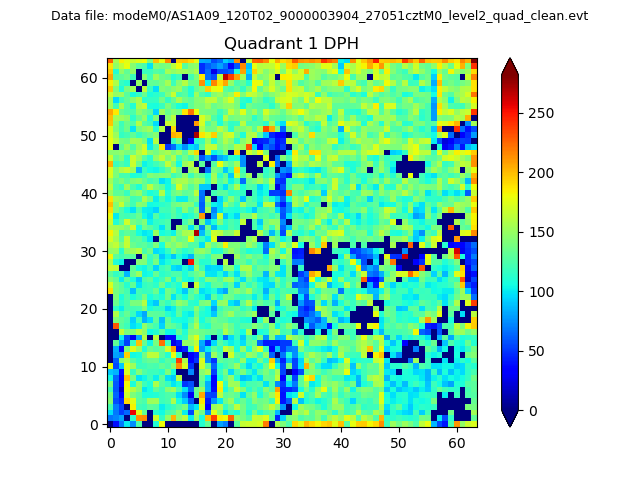 |
Quadrant B |
|---|---|---|---|
| Quadrant D | 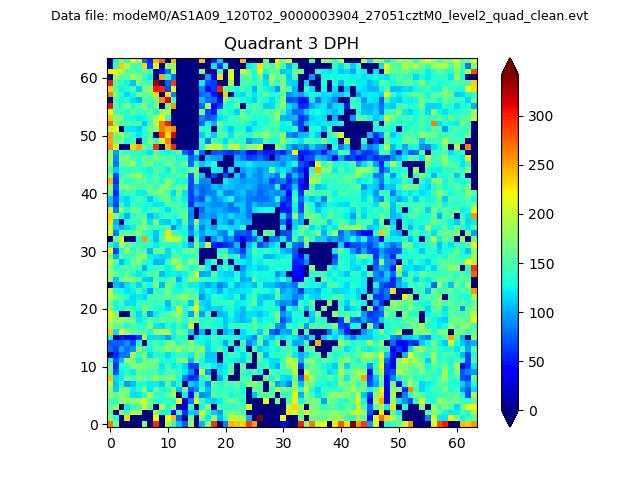 |
 |
Quadrant C |
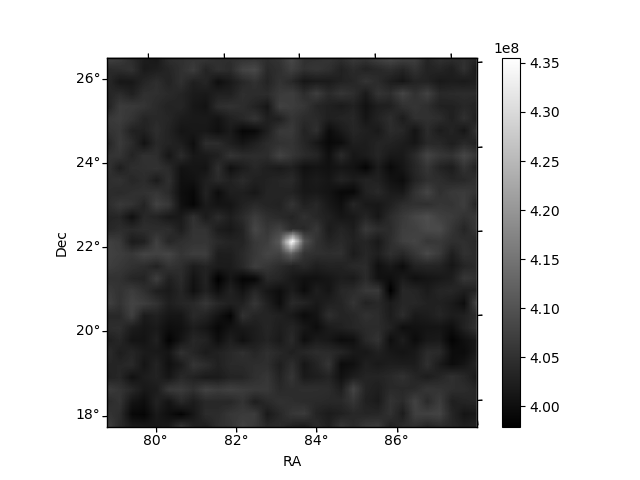
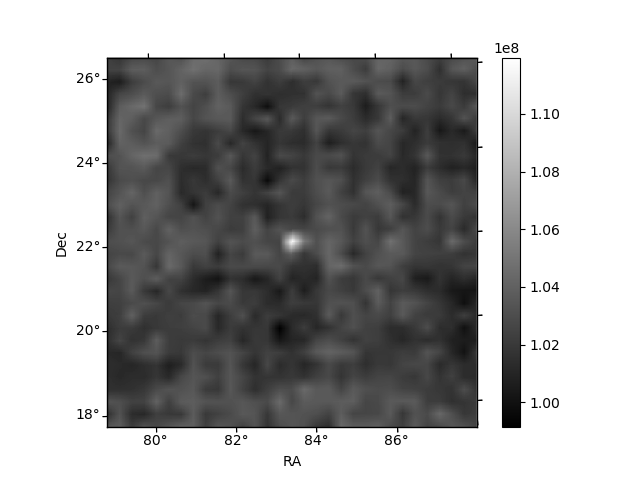
| Plot type | Count rate plots | Images |
|---|---|---|
| Comparison with Poisson distribution Blue bars denote a histogram of data divided into 1 sec bins. Red curve is a Poisson curve with rate = median count rate of data. |
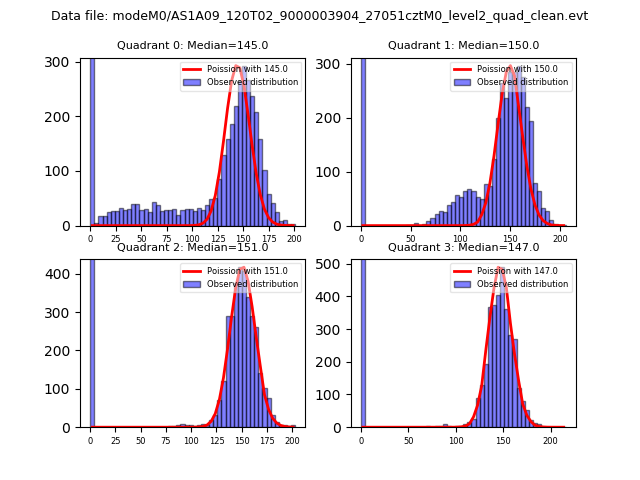 |
 |
| Quadrant-wise count rates Data is divided into 100 sec bins |
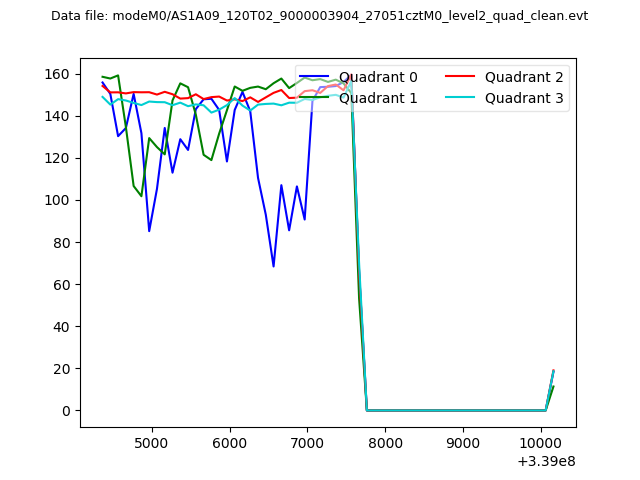 |
|
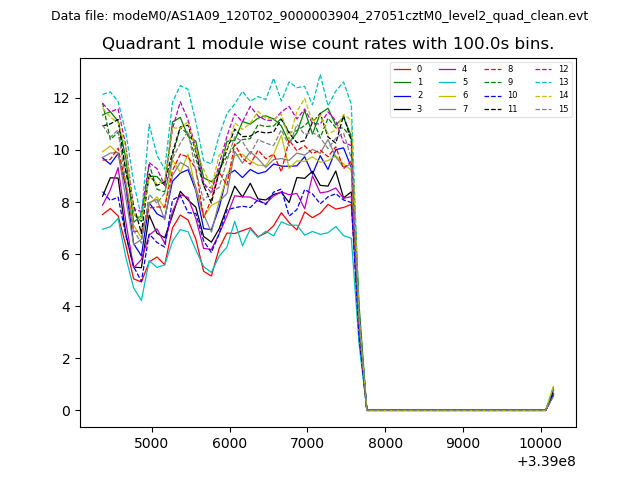
| Module-wise count rates for Quadrant A Data is divided into 100 sec bins |
 |
 |
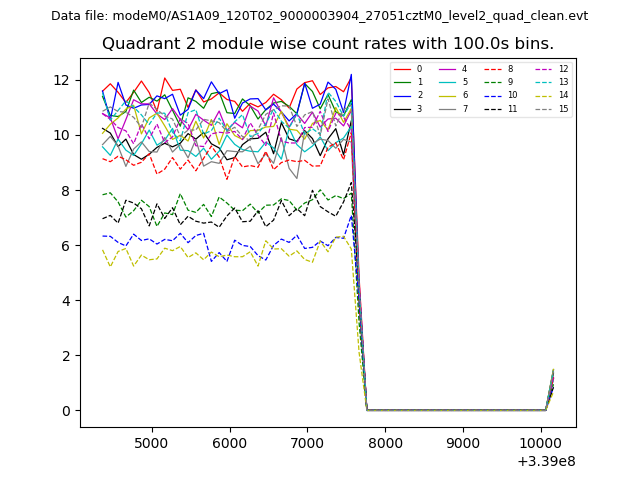
| Module-wise count rates for Quadrant B Data is divided into 100 sec bins |
 |
 |
| Module-wise count rates for Quadrant C Data is divided into 100 sec bins |
 |
 |
| Module-wise count rates for Quadrant D Data is divided into 100 sec bins |
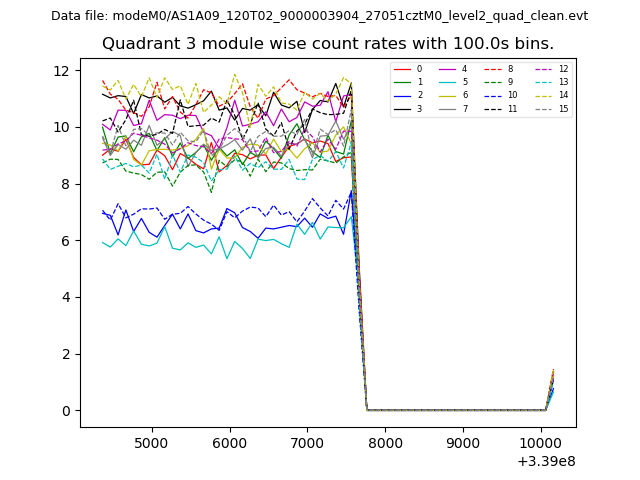 |
 |
| Parameter | Plot |
|---|---|
| CZT HV Monitor |  |
| D_VDD | 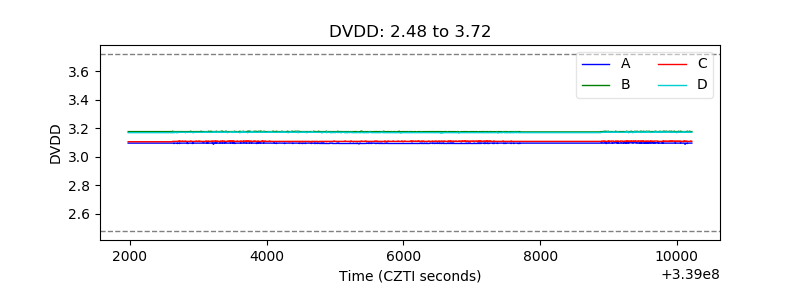 |
| Temperature 1 | 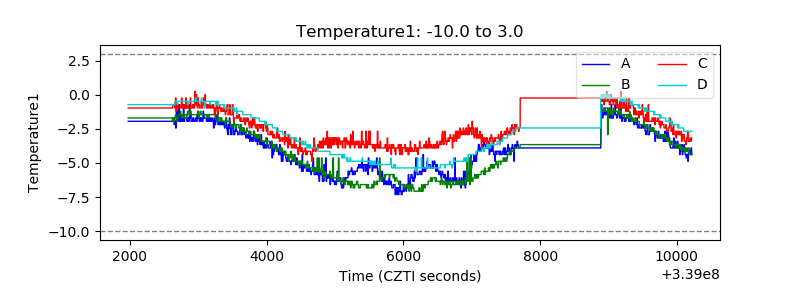 |
| Veto HV Monitor | 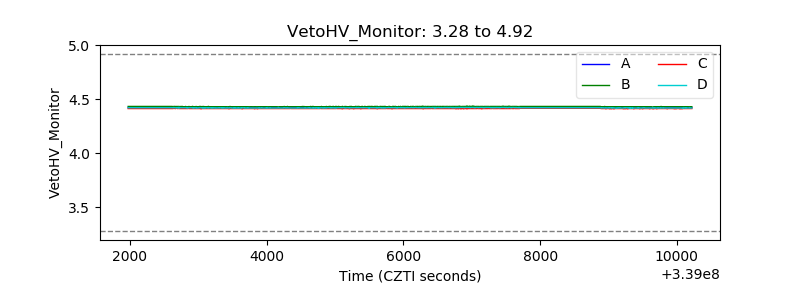 |
| Veto LLD |  |
| Alpha Counter | 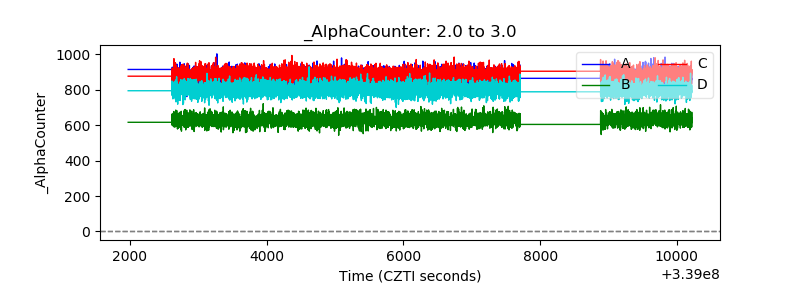 |
| _CPM_Rate |  |
| CZT Counter | 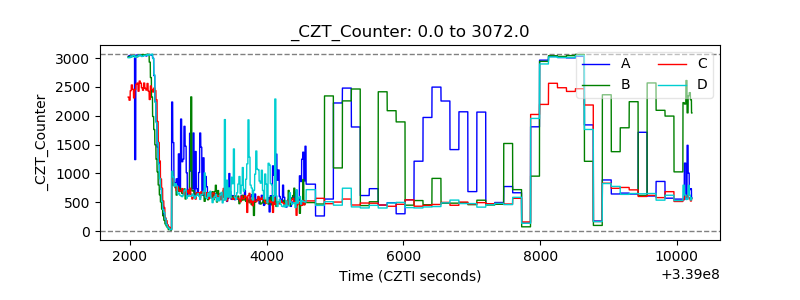 |
| +2.5 Volts monitor |  |
| +5 Volts monitor |  |
| _ROLL_ROT |  |
| _Roll_DEC |  |
| _Roll_RA | 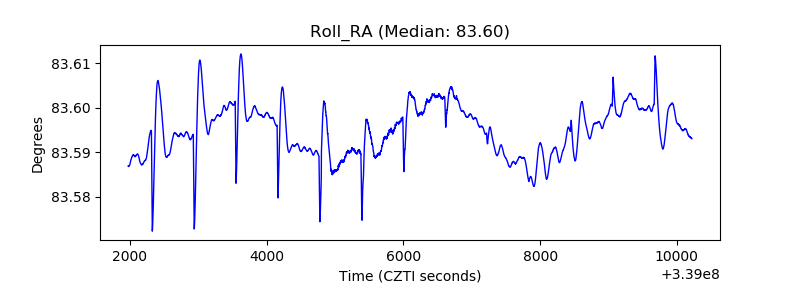 |
| Veto Counter | 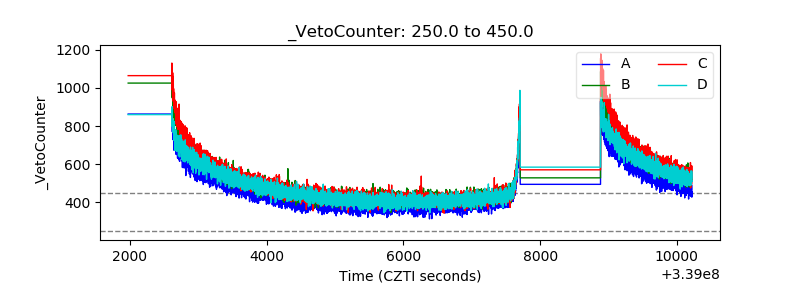 |