| Param | Original file | Final file |
|---|---|---|
| Filename | modeM0/AS1A09_120T02_9000003904_27052cztM0_level2.evt | modeM0/AS1A09_120T02_9000003904_27052cztM0_level2_quad_clean.evt |
| Size (bytes) | 695,534,400 | 92,243,520 |
| Size | 663.3 MB | 88.0 MB |
| Events in quadrant A | 6,976,164 | 532,979 |
| Events in quadrant B | 6,950,630 | 594,567 |
| Events in quadrant C | 3,350,635 | 635,859 |
| Events in quadrant D | 3,385,989 | 615,266 |
| Mode M9 | |||
|---|---|---|---|
| Quadrant | BADHDUFLAG | Total packets | Discarded packets |
| A | 0 | 13 | 0 |
| B | 0 | 13 | 0 |
| C | 0 | 13 | 0 |
| D | 0 | 13 | 0 |
| Mode M0 | |||
|---|---|---|---|
| Quadrant | BADHDUFLAG | Total packets | Discarded packets |
| A | 0 | 24816 | 0 |
| B | 0 | 24548 | 0 |
| C | 0 | 13787 | 0 |
| D | 0 | 13957 | 0 |
| Quadrant | Total seconds | Saturated seconds | Saturation percentage |
|---|---|---|---|
| A | 5928 | 1586 | 26.754386% |
| B | 5927 | 1780 | 30.032057% |
| C | 5927 | 103 | 1.737810% |
| D | 5927 | 61 | 1.029188% |
Noise dominated data is calculated using 1-second bins in cleaned event files. If a bin has >2000 counts, and if more than 50% of those come from <1% of pixels, then it is considered to be noise-dominated and hence unusable.
| Quadrant | # 1 sec bins | Bins with >0 counts | Bins with >2000 counts | High rate bins dominated by noise | Noise dominated (total time) | Noise dominated (detector-on time) | Marked lightcurve |
|---|---|---|---|---|---|---|---|
| A | 7208 | 5928 | 1287 | 1287 | 17.86% | 21.71% | 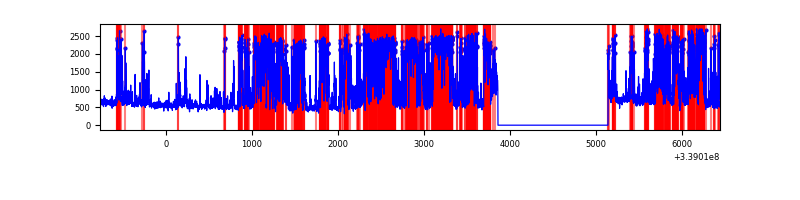 |
| B | 7206 | 5926 | 1522 | 1522 | 21.12% | 25.68% | 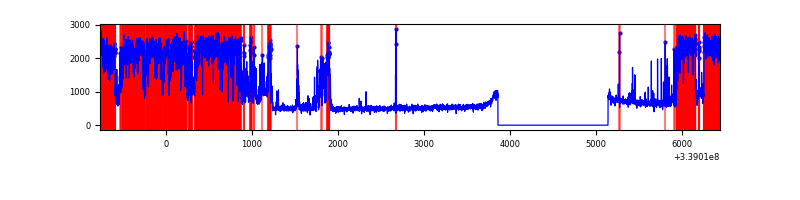 |
| C | 7207 | 5927 | 1 | 1 | 0.01% | 0.02% | 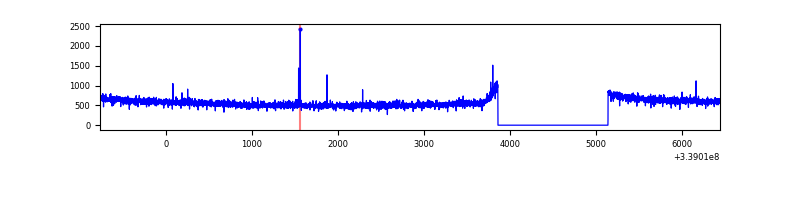 |
| D | 7207 | 5927 | 25 | 25 | 0.35% | 0.42% | 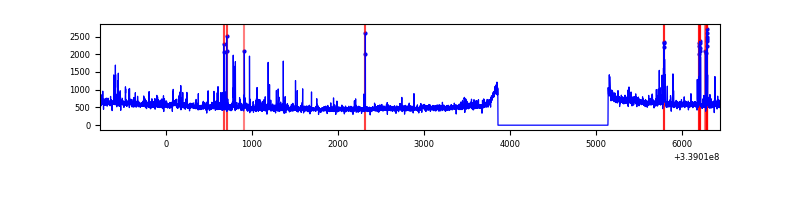 |
Top three noisy pixels from each quadrant. If the there are fewer than three noisy pixels in the level2.evt file, extra rows are filled as -1
| Pixel properties | Quadrant properties | ||||||
|---|---|---|---|---|---|---|---|
| Quadrant | DetID | PixID | Counts | Sigma | Mean | Median | Sigma |
| A | 14 | 235 | 4127095 | 28469.21 | 738 | 730 | 144.9 |
| A | 13 | 254 | 8695 | 54.95 | 738 | 730 | 144.9 |
| A | 0 | 226 | 6218 | 37.86 | 738 | 730 | 144.9 |
| B | 0 | 189 | 3891832 | 27360.25 | 756 | 743 | 142.2 |
| B | 3 | 112 | 45889 | 317.44 | 756 | 743 | 142.2 |
| B | 10 | 246 | 21673 | 147.17 | 756 | 743 | 142.2 |
| C | 14 | 238 | 133426 | 697.75 | 819 | 830 | 190.0 |
| C | 15 | 208 | 17297 | 86.65 | 819 | 830 | 190.0 |
| C | 13 | 61 | 5565 | 24.92 | 819 | 830 | 190.0 |
| D | 1 | 52 | 157447 | 800.91 | 820 | 804 | 195.6 |
| D | 2 | 250 | 66799 | 337.43 | 820 | 804 | 195.6 |
| D | 12 | 233 | 46300 | 232.62 | 820 | 804 | 195.6 |
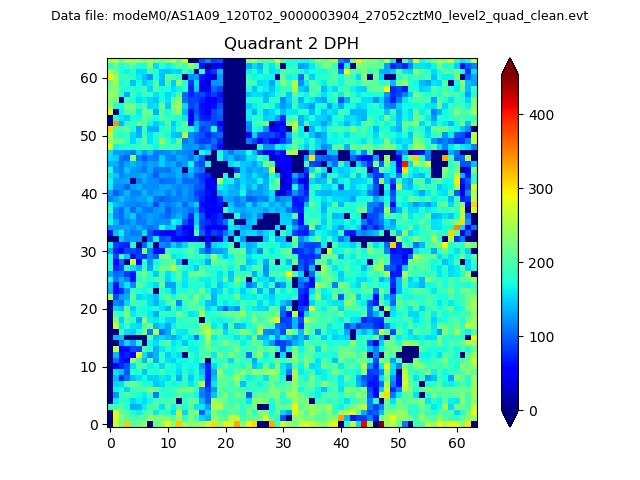
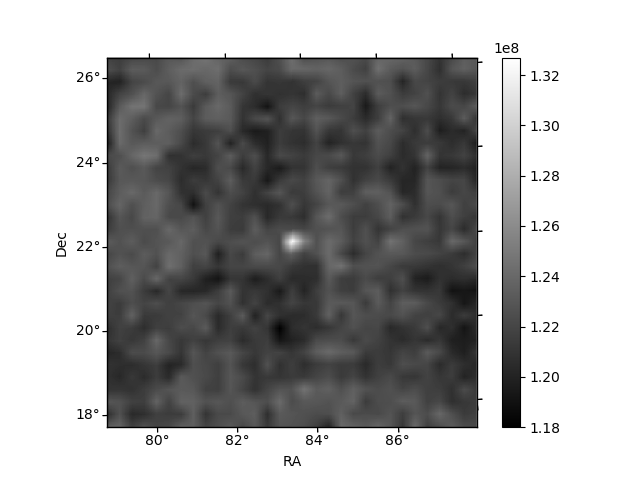
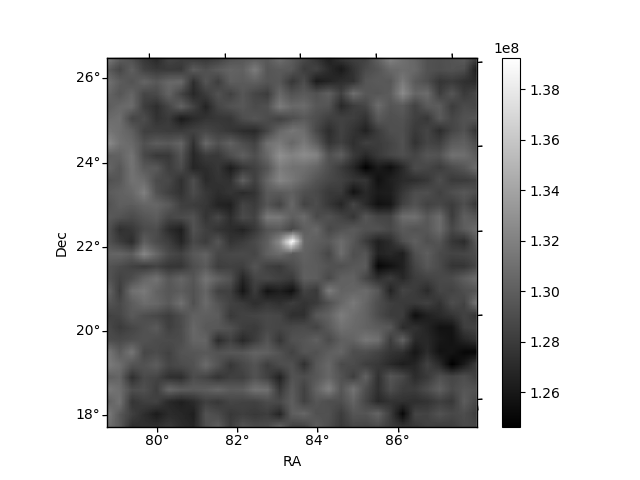
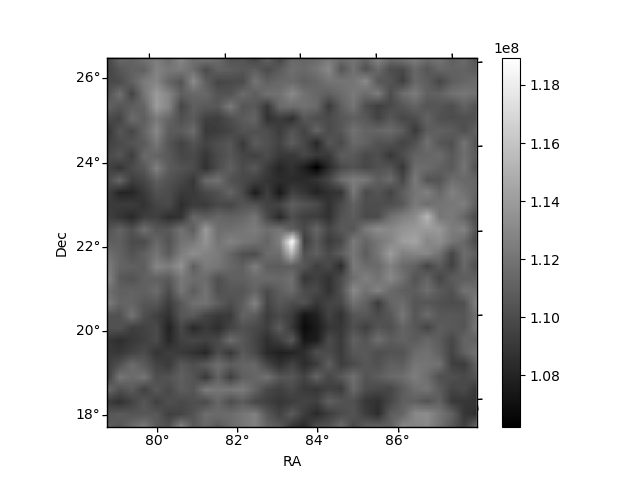
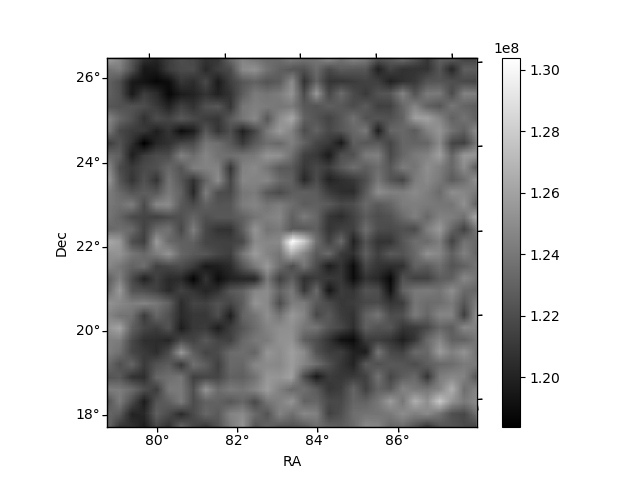
Histogram calculated using DETX and DETY for each event in the final _common_clean file
| Quadrant A | 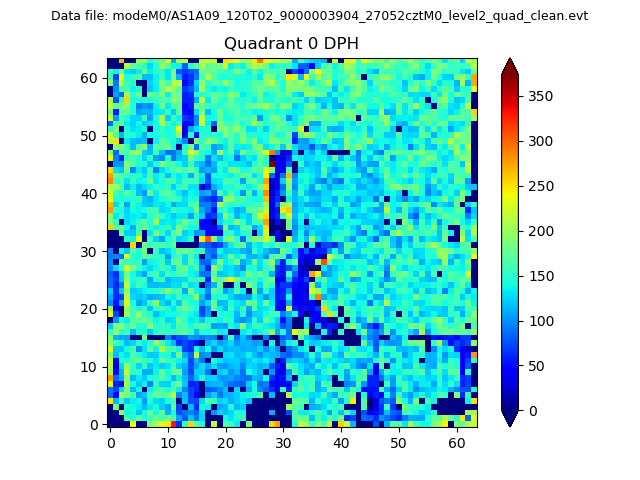 |
 |
Quadrant B |
|---|---|---|---|
| Quadrant D |  |
 |
Quadrant C |
| Plot type | Count rate plots | Images |
|---|---|---|
| Comparison with Poisson distribution Blue bars denote a histogram of data divided into 1 sec bins. Red curve is a Poisson curve with rate = median count rate of data. |
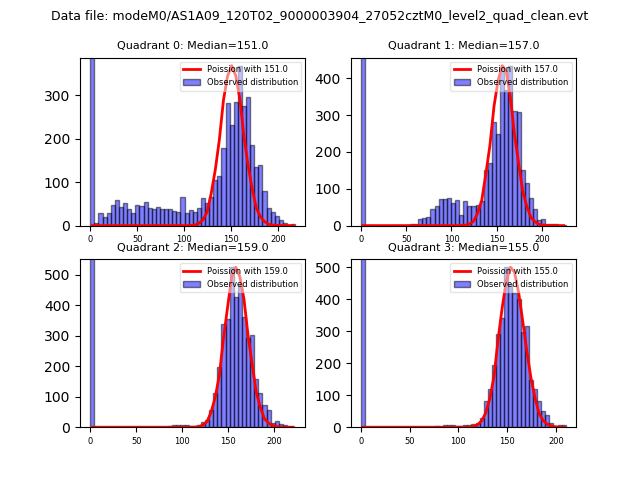 |
 |
| Quadrant-wise count rates Data is divided into 100 sec bins |
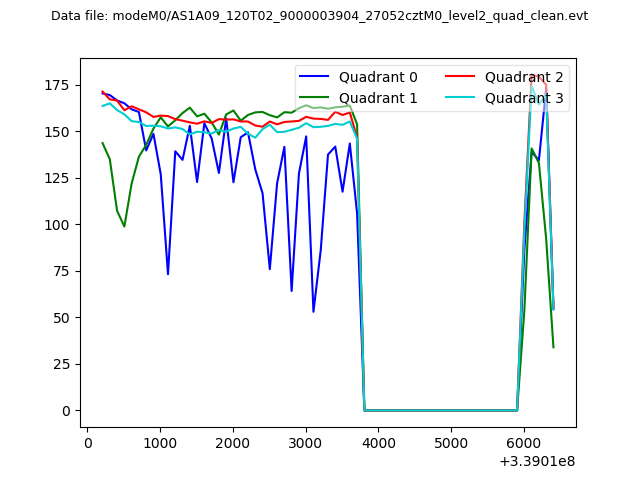 |
|
| Module-wise count rates for Quadrant A Data is divided into 100 sec bins |
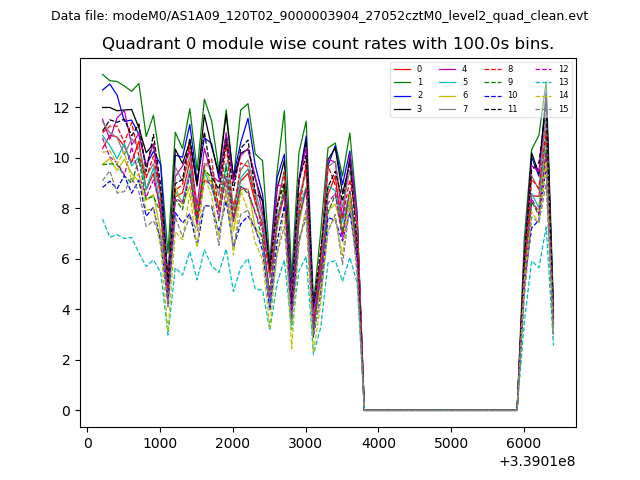 |
 |
| Module-wise count rates for Quadrant B Data is divided into 100 sec bins |
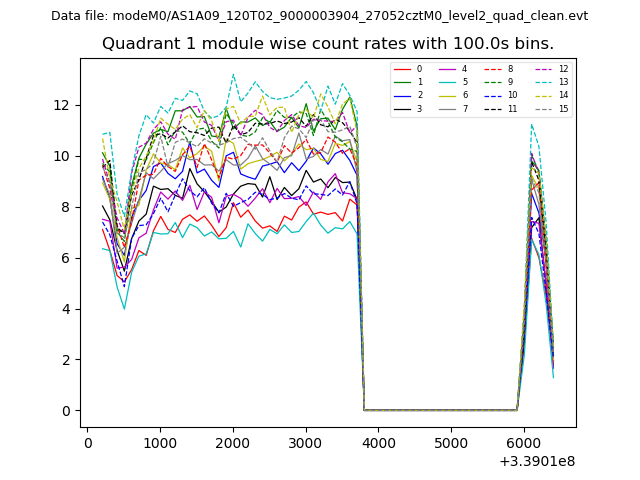 |
 |
| Module-wise count rates for Quadrant C Data is divided into 100 sec bins |
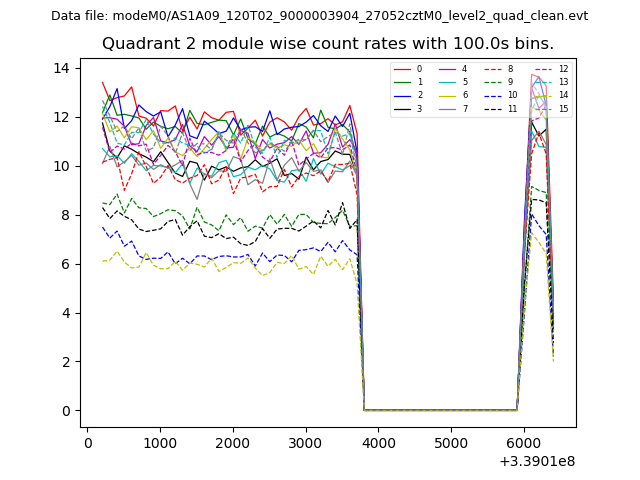 |
 |
| Module-wise count rates for Quadrant D Data is divided into 100 sec bins |
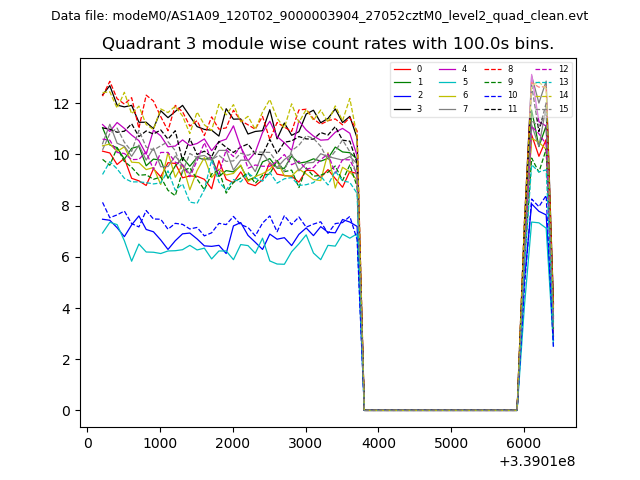 |
 |
| Parameter | Plot |
|---|---|
| CZT HV Monitor |  |
| D_VDD | 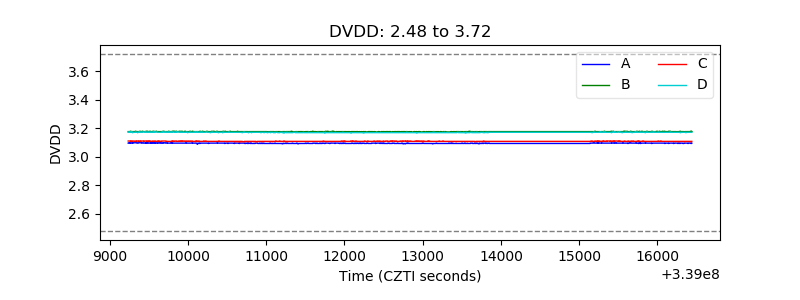 |
| Temperature 1 | 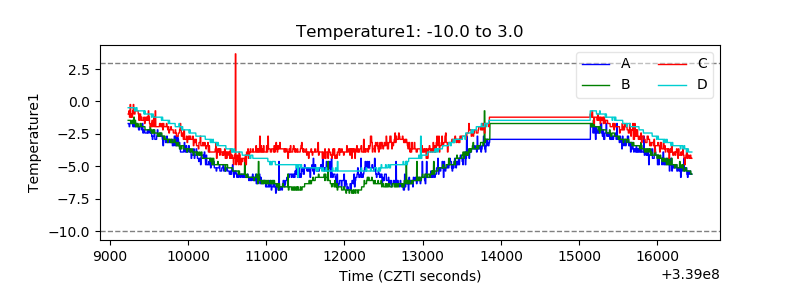 |
| Veto HV Monitor | 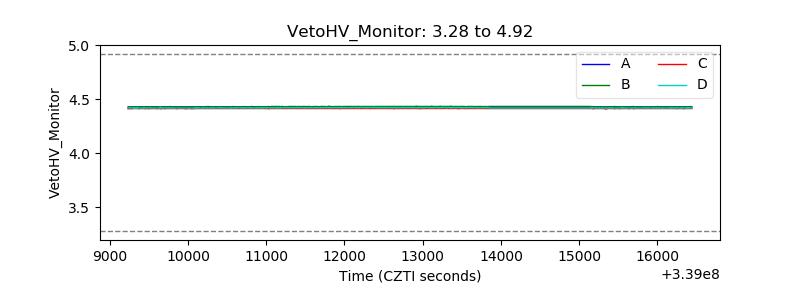 |
| Veto LLD | 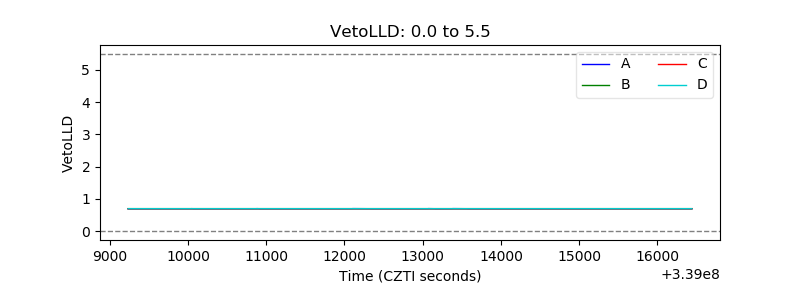 |
| Alpha Counter | 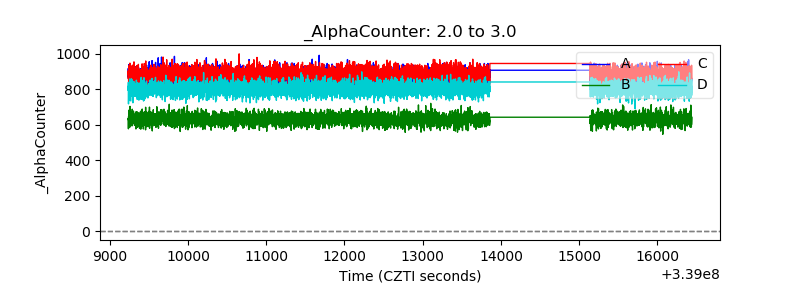 |
| _CPM_Rate | 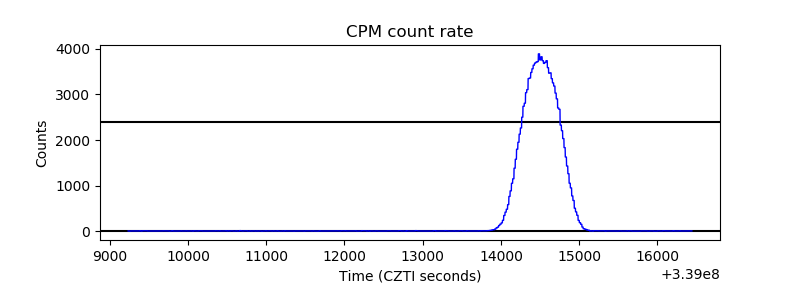 |
| CZT Counter | 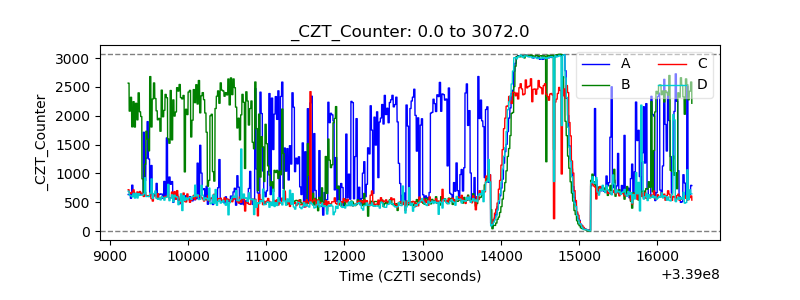 |
| +2.5 Volts monitor |  |
| +5 Volts monitor |  |
| _ROLL_ROT | 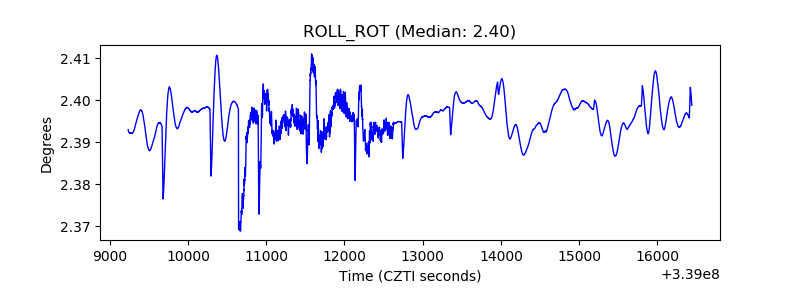 |
| _Roll_DEC | 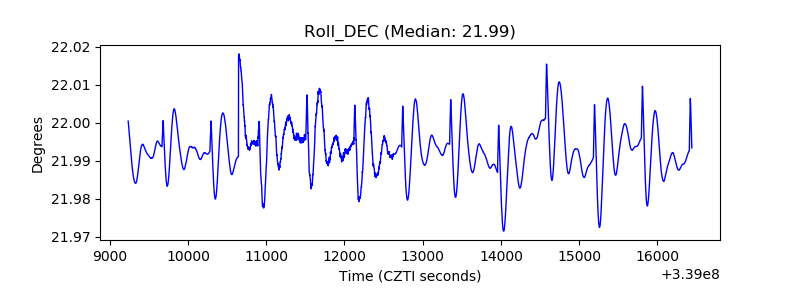 |
| _Roll_RA | 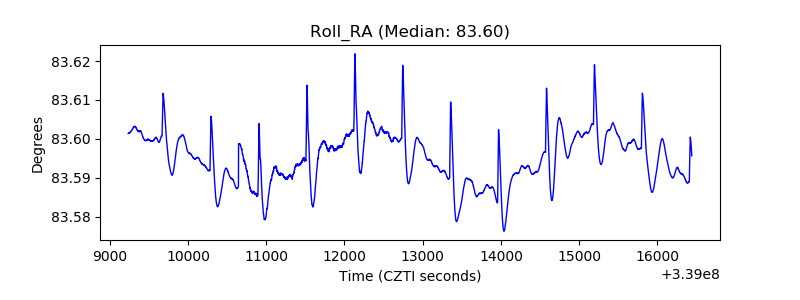 |
| Veto Counter | 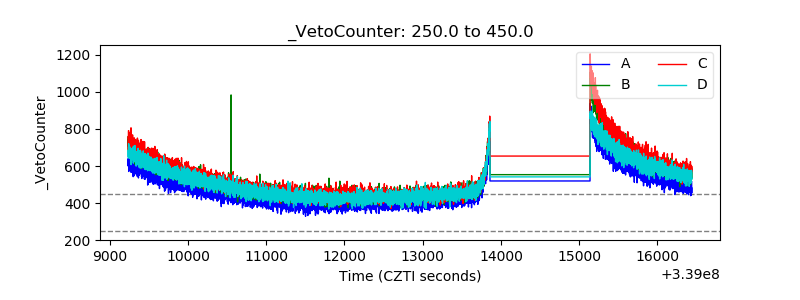 |