| Param | Original file | Final file |
|---|---|---|
| Filename | modeM0/AS1A09_120T02_9000003904_27053cztM0_level2.evt | modeM0/AS1A09_120T02_9000003904_27053cztM0_level2_quad_clean.evt |
| Size (bytes) | 718,784,640 | 102,556,800 |
| Size | 685.5 MB | 97.8 MB |
| Events in quadrant A | 6,858,728 | 638,750 |
| Events in quadrant B | 7,694,195 | 662,706 |
| Events in quadrant C | 3,286,173 | 714,690 |
| Events in quadrant D | 3,538,502 | 684,711 |
| Mode M9 | |||
|---|---|---|---|
| Quadrant | BADHDUFLAG | Total packets | Discarded packets |
| A | 0 | 13 | 0 |
| B | 0 | 13 | 0 |
| C | 0 | 13 | 0 |
| D | 0 | 13 | 0 |
| Mode M0 | |||
|---|---|---|---|
| Quadrant | BADHDUFLAG | Total packets | Discarded packets |
| A | 0 | 24377 | 0 |
| B | 0 | 26777 | 0 |
| C | 0 | 13495 | 0 |
| D | 0 | 14232 | 0 |
| Quadrant | Total seconds | Saturated seconds | Saturation percentage |
|---|---|---|---|
| A | 5781 | 1401 | 24.234561% |
| B | 5781 | 1951 | 33.748486% |
| C | 5782 | 125 | 2.161882% |
| D | 5782 | 138 | 2.386717% |
Noise dominated data is calculated using 1-second bins in cleaned event files. If a bin has >2000 counts, and if more than 50% of those come from <1% of pixels, then it is considered to be noise-dominated and hence unusable.
| Quadrant | # 1 sec bins | Bins with >0 counts | Bins with >2000 counts | High rate bins dominated by noise | Noise dominated (total time) | Noise dominated (detector-on time) | Marked lightcurve |
|---|---|---|---|---|---|---|---|
| A | 7076 | 5781 | 1184 | 1184 | 16.73% | 20.48% | 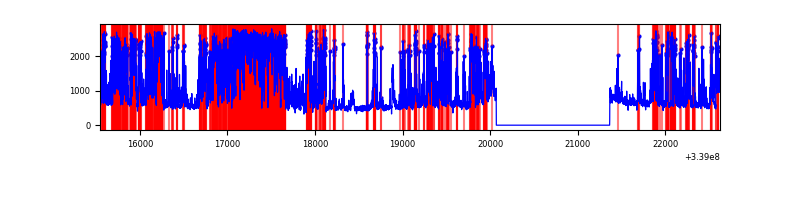 |
| B | 7075 | 5780 | 1620 | 1620 | 22.90% | 28.03% | 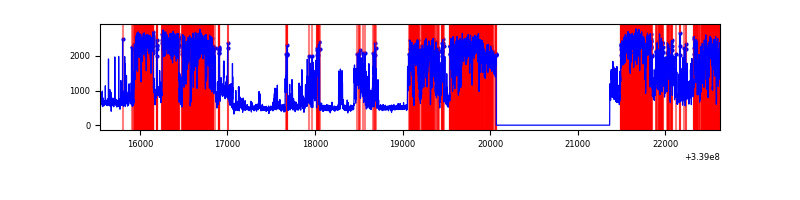 |
| C | 7077 | 5782 | 5 | 5 | 0.07% | 0.09% | 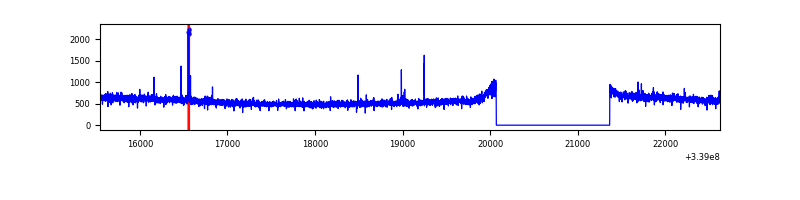 |
| D | 7077 | 5782 | 74 | 74 | 1.05% | 1.28% | 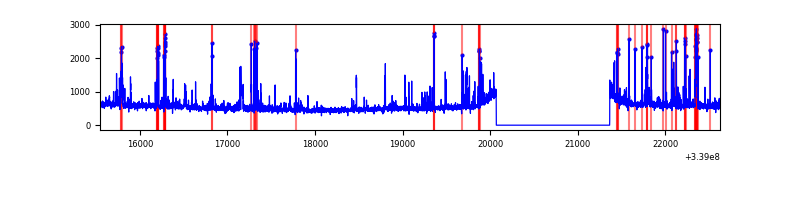 |
Top three noisy pixels from each quadrant. If the there are fewer than three noisy pixels in the level2.evt file, extra rows are filled as -1
| Pixel properties | Quadrant properties | ||||||
|---|---|---|---|---|---|---|---|
| Quadrant | DetID | PixID | Counts | Sigma | Mean | Median | Sigma |
| A | 14 | 235 | 3986203 | 26709.31 | 744 | 733 | 149.2 |
| A | 13 | 254 | 9339 | 57.67 | 744 | 733 | 149.2 |
| A | 0 | 226 | 6331 | 37.52 | 744 | 733 | 149.2 |
| B | 0 | 189 | 4706489 | 34741.56 | 721 | 705 | 135.5 |
| B | 10 | 246 | 81987 | 600.08 | 721 | 705 | 135.5 |
| B | 3 | 112 | 53581 | 390.37 | 721 | 705 | 135.5 |
| C | 14 | 238 | 130758 | 695.26 | 801 | 813 | 186.9 |
| C | 15 | 208 | 31827 | 165.94 | 801 | 813 | 186.9 |
| C | 13 | 61 | 5428 | 24.69 | 801 | 813 | 186.9 |
| D | 1 | 52 | 316463 | 1670.67 | 795 | 779 | 189.0 |
| D | 2 | 250 | 171694 | 904.52 | 795 | 779 | 189.0 |
| D | 2 | 234 | 25493 | 130.79 | 795 | 779 | 189.0 |
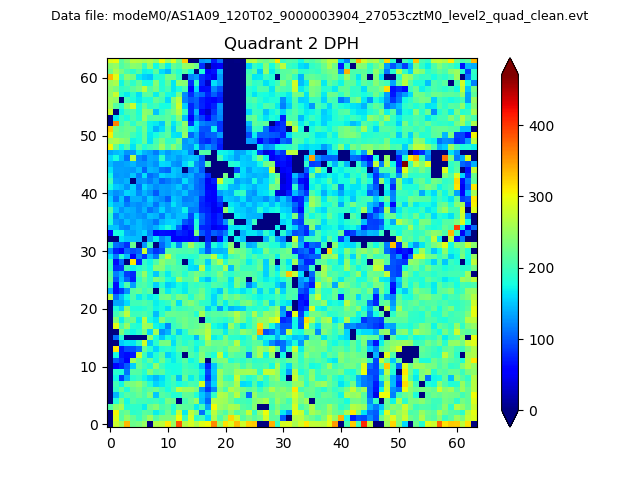
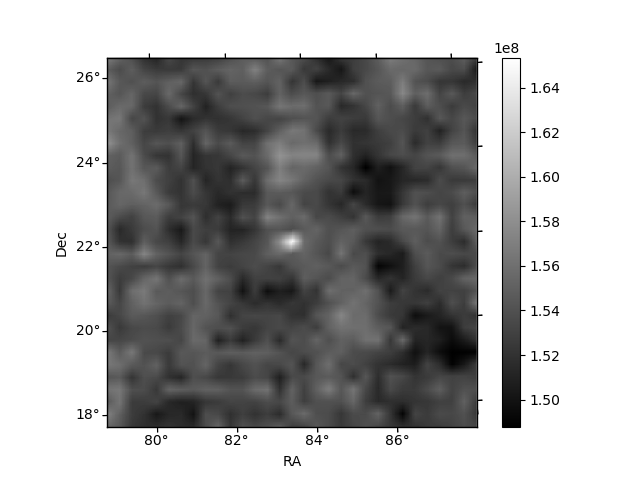
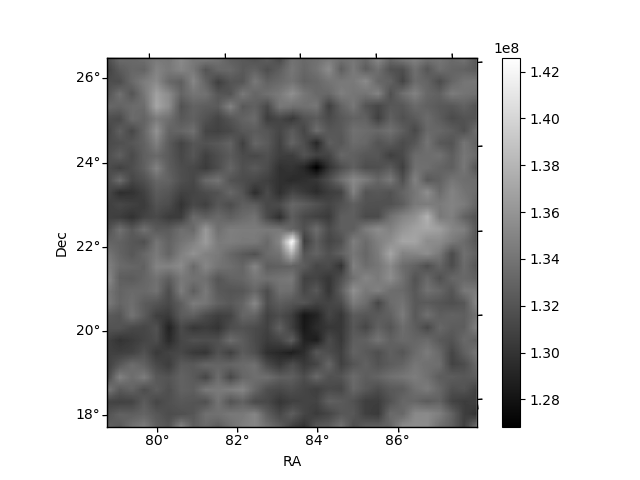
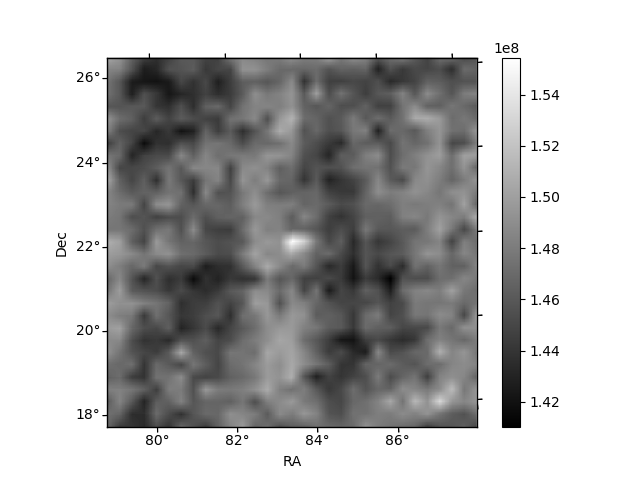
Histogram calculated using DETX and DETY for each event in the final _common_clean file
| Quadrant A | 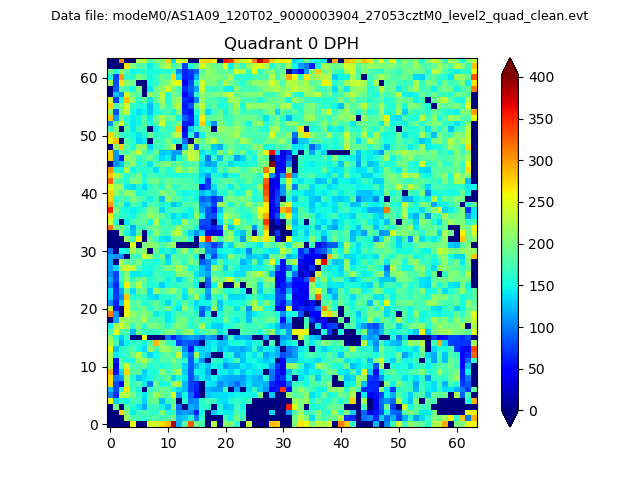 |
 |
Quadrant B |
|---|---|---|---|
| Quadrant D | 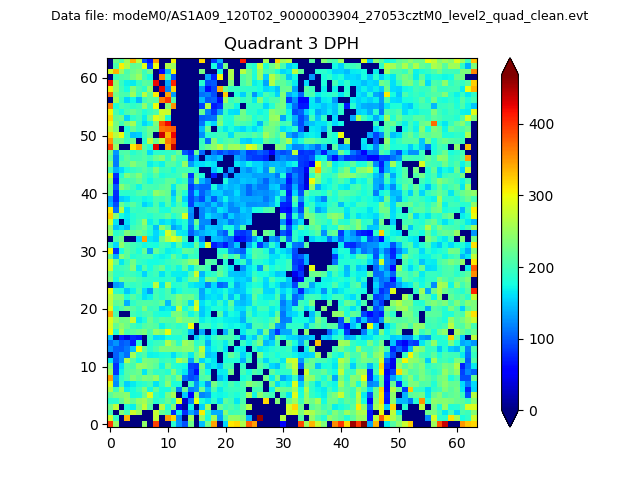 |
 |
Quadrant C |
| Plot type | Count rate plots | Images |
|---|---|---|
| Comparison with Poisson distribution Blue bars denote a histogram of data divided into 1 sec bins. Red curve is a Poisson curve with rate = median count rate of data. |
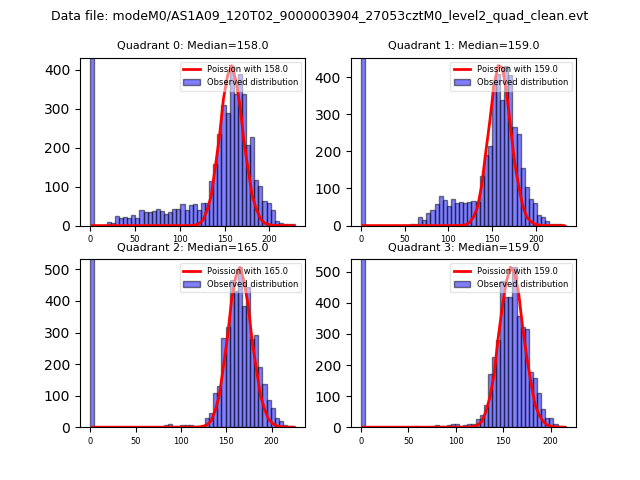 |
 |
| Quadrant-wise count rates Data is divided into 100 sec bins |
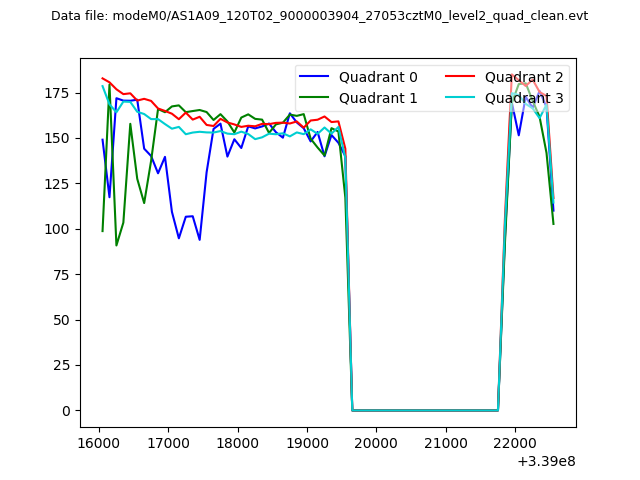 |
|
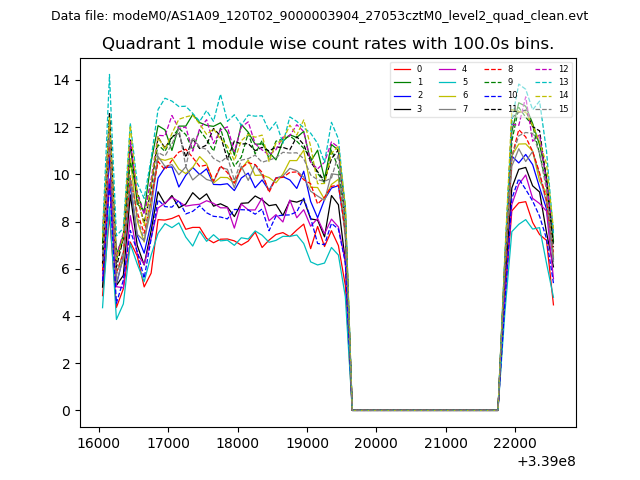
| Module-wise count rates for Quadrant A Data is divided into 100 sec bins |
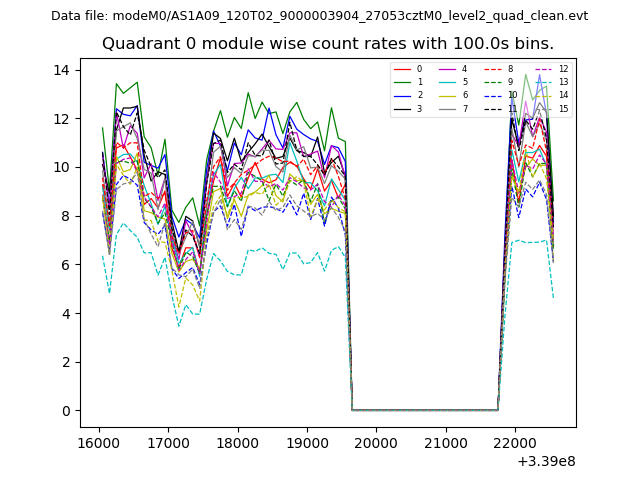 |
 |
| Module-wise count rates for Quadrant B Data is divided into 100 sec bins |
 |
 |
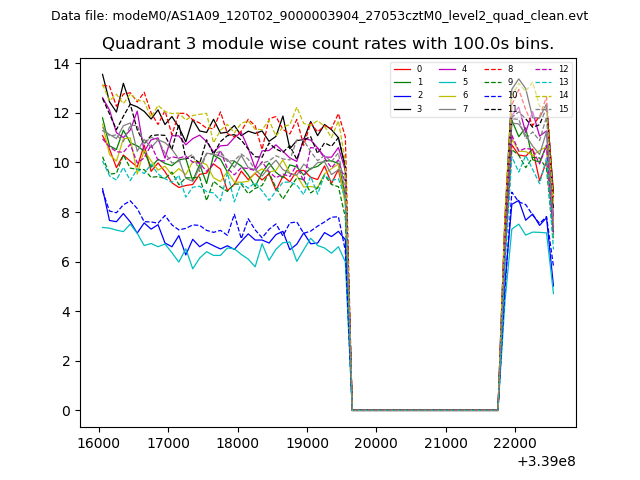
| Module-wise count rates for Quadrant C Data is divided into 100 sec bins |
 |
 |
| Module-wise count rates for Quadrant D Data is divided into 100 sec bins |
 |
 |
| Parameter | Plot |
|---|---|
| CZT HV Monitor | 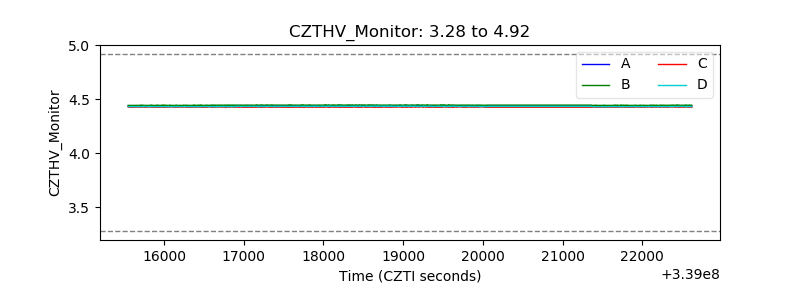 |
| D_VDD | 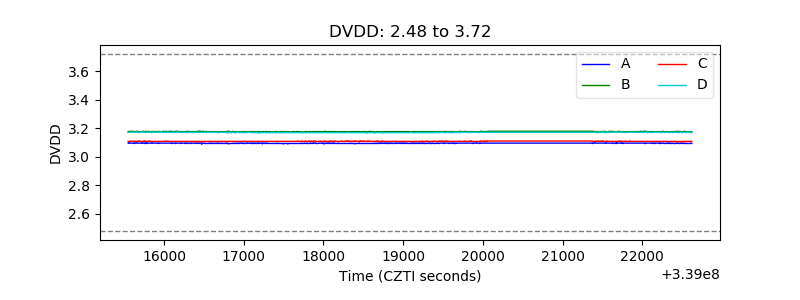 |
| Temperature 1 | 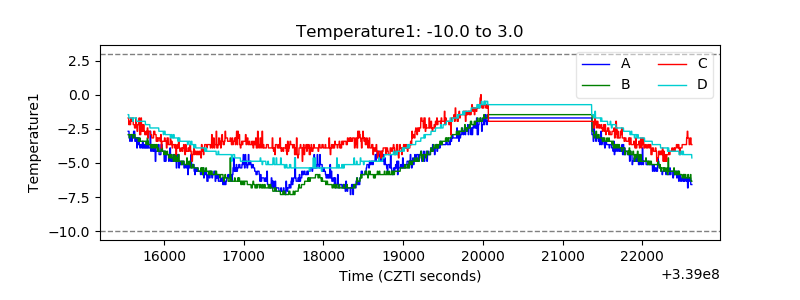 |
| Veto HV Monitor | 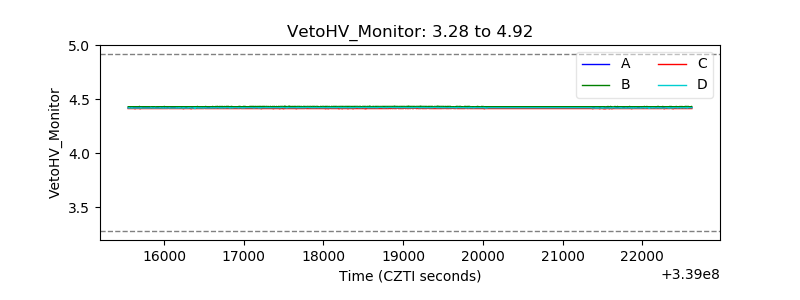 |
| Veto LLD | 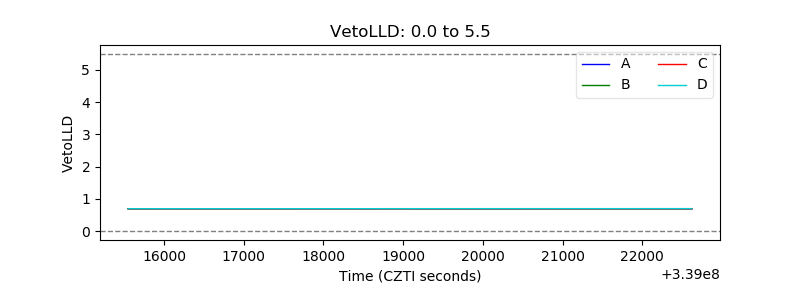 |
| Alpha Counter | 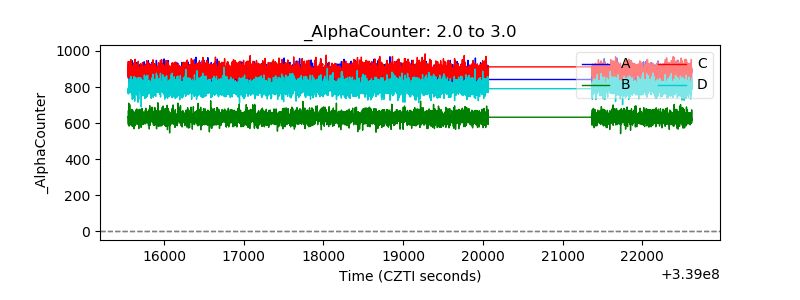 |
| _CPM_Rate | 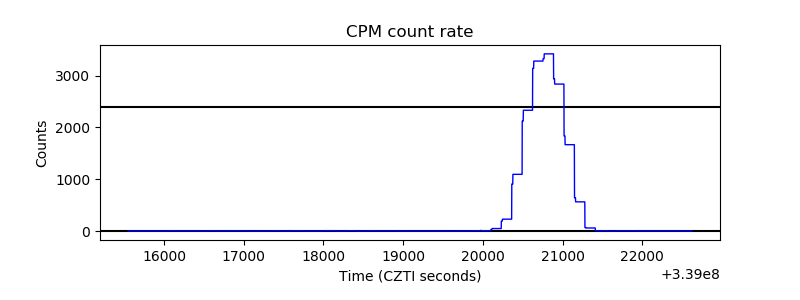 |
| CZT Counter | 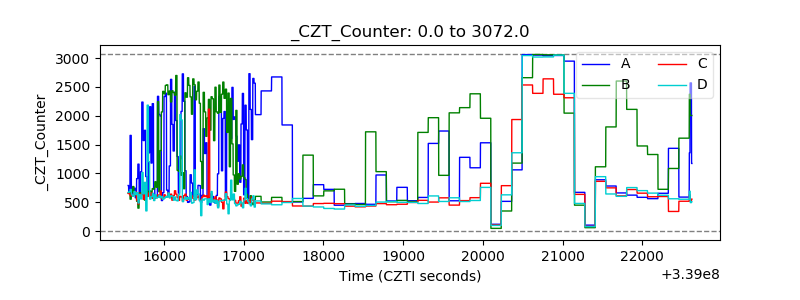 |
| +2.5 Volts monitor |  |
| +5 Volts monitor | 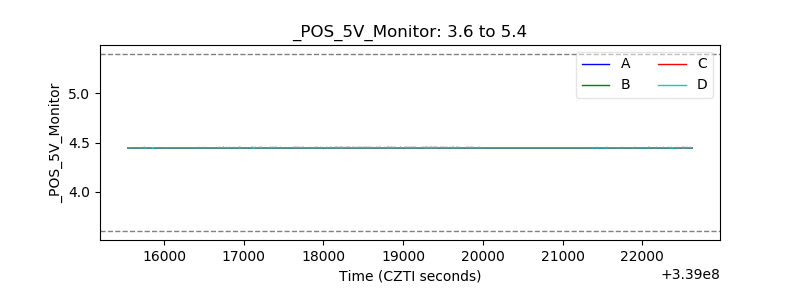 |
| _ROLL_ROT | 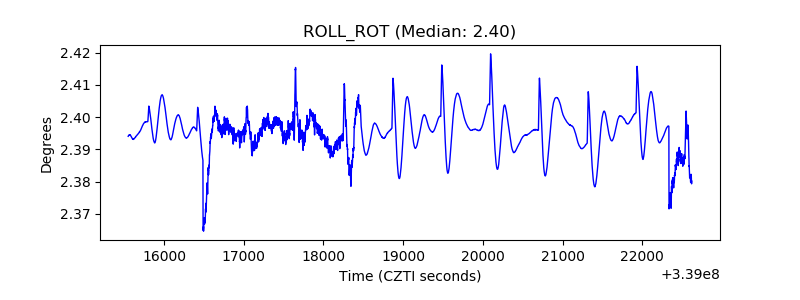 |
| _Roll_DEC | 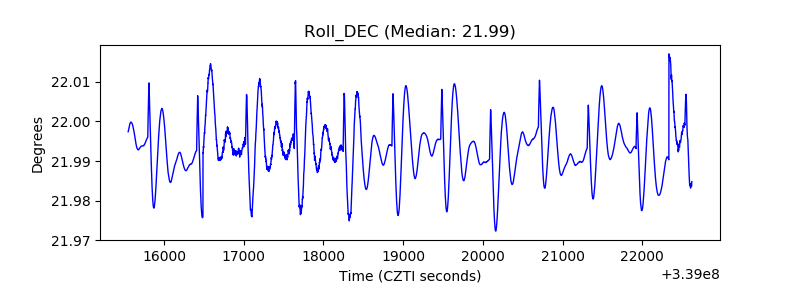 |
| _Roll_RA | 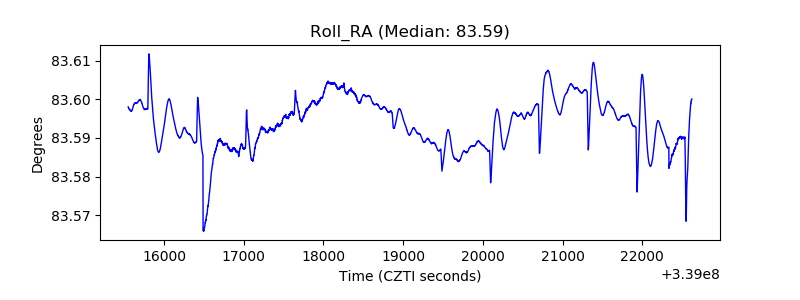 |
| Veto Counter |  |