| Param | Original file | Final file |
|---|---|---|
| Filename | modeM0/AS1A09_120T02_9000003904_27054cztM0_level2.evt | modeM0/AS1A09_120T02_9000003904_27054cztM0_level2_quad_clean.evt |
| Size (bytes) | 631,704,960 | 112,864,320 |
| Size | 602.4 MB | 107.6 MB |
| Events in quadrant A | 5,389,970 | 749,935 |
| Events in quadrant B | 6,518,012 | 737,561 |
| Events in quadrant C | 3,204,773 | 779,811 |
| Events in quadrant D | 3,625,243 | 744,005 |
| Mode M9 | |||
|---|---|---|---|
| Quadrant | BADHDUFLAG | Total packets | Discarded packets |
| A | 0 | 13 | 0 |
| B | 0 | 13 | 0 |
| C | 0 | 13 | 0 |
| D | 0 | 13 | 0 |
| Mode M0 | |||
|---|---|---|---|
| Quadrant | BADHDUFLAG | Total packets | Discarded packets |
| A | 0 | 20002 | 0 |
| B | 0 | 23144 | 0 |
| C | 0 | 13078 | 0 |
| D | 0 | 14526 | 0 |
| Quadrant | Total seconds | Saturated seconds | Saturation percentage |
|---|---|---|---|
| A | 5807 | 562 | 9.677975% |
| B | 5808 | 1454 | 25.034435% |
| C | 5807 | 73 | 1.257103% |
| D | 5807 | 92 | 1.584295% |
Noise dominated data is calculated using 1-second bins in cleaned event files. If a bin has >2000 counts, and if more than 50% of those come from <1% of pixels, then it is considered to be noise-dominated and hence unusable.
| Quadrant | # 1 sec bins | Bins with >0 counts | Bins with >2000 counts | High rate bins dominated by noise | Noise dominated (total time) | Noise dominated (detector-on time) | Marked lightcurve |
|---|---|---|---|---|---|---|---|
| A | 7152 | 5807 | 460 | 460 | 6.43% | 7.92% | 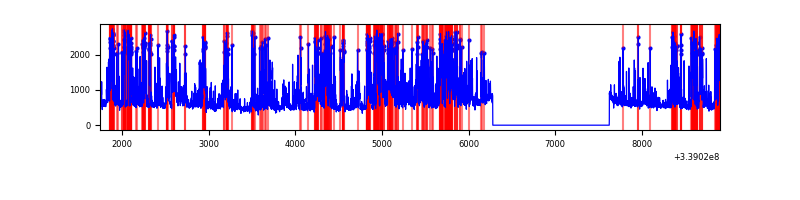 |
| B | 7152 | 5807 | 1089 | 1089 | 15.23% | 18.75% | 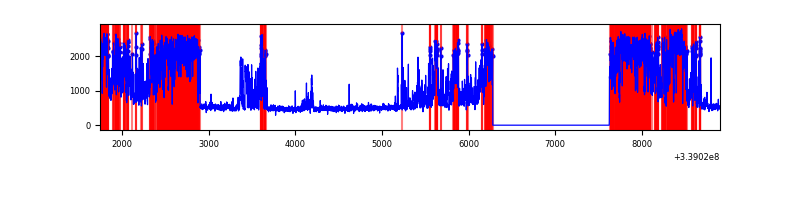 |
| C | 7151 | 5807 | 3 | 3 | 0.04% | 0.05% | 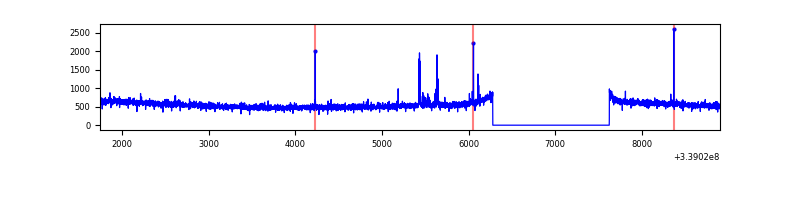 |
| D | 7151 | 5806 | 73 | 73 | 1.02% | 1.26% | 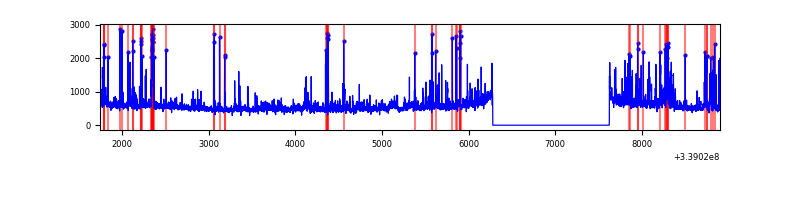 |
Top three noisy pixels from each quadrant. If the there are fewer than three noisy pixels in the level2.evt file, extra rows are filled as -1
| Pixel properties | Quadrant properties | ||||||
|---|---|---|---|---|---|---|---|
| Quadrant | DetID | PixID | Counts | Sigma | Mean | Median | Sigma |
| A | 14 | 235 | 2427181 | 15718.79 | 766 | 755 | 154.4 |
| A | 2 | 79 | 10024 | 60.04 | 766 | 755 | 154.4 |
| A | 13 | 254 | 9538 | 56.89 | 766 | 755 | 154.4 |
| B | 0 | 189 | 3504192 | 25404.9 | 734 | 720 | 137.9 |
| B | 10 | 246 | 101213 | 728.71 | 734 | 720 | 137.9 |
| B | 0 | 219 | 25599 | 180.41 | 734 | 720 | 137.9 |
| C | 14 | 238 | 126105 | 690.7 | 776 | 786 | 181.4 |
| C | 10 | 22 | 34825 | 187.61 | 776 | 786 | 181.4 |
| C | 15 | 208 | 17460 | 91.9 | 776 | 786 | 181.4 |
| D | 1 | 52 | 521800 | 2852.05 | 767 | 751 | 182.7 |
| D | 2 | 250 | 171173 | 932.83 | 767 | 751 | 182.7 |
| D | 2 | 234 | 25300 | 134.37 | 767 | 751 | 182.7 |
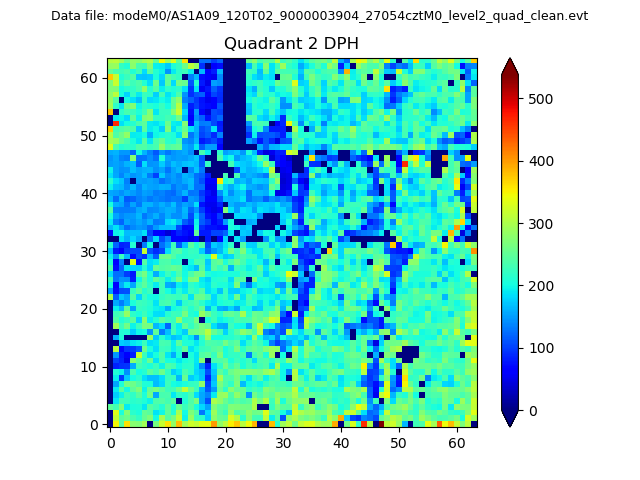
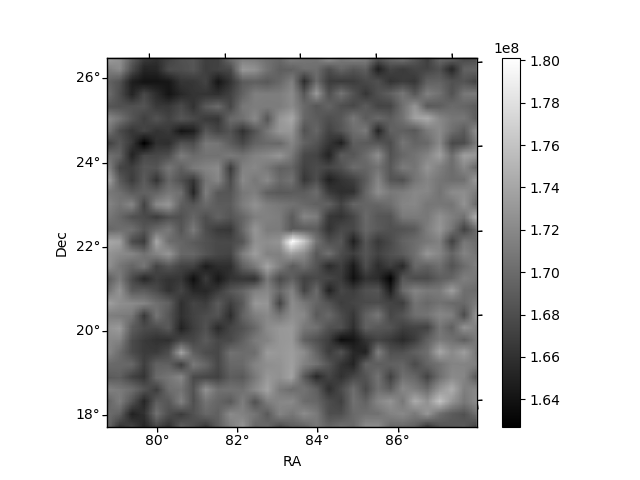
Histogram calculated using DETX and DETY for each event in the final _common_clean file
| Quadrant A | 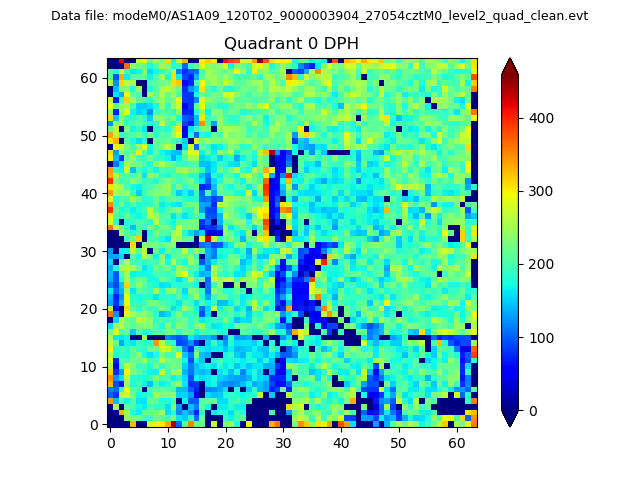 |
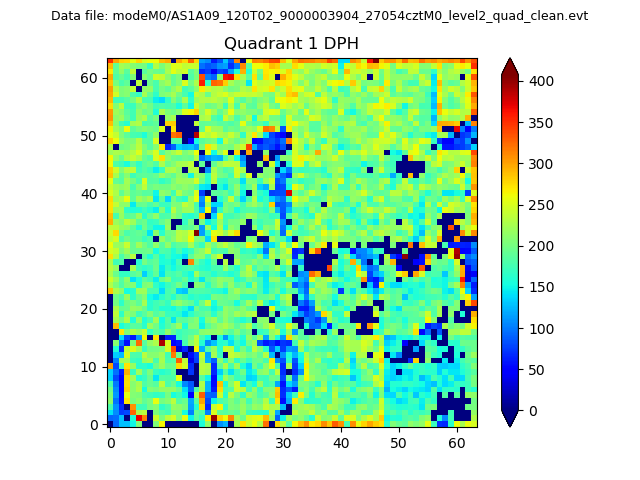 |
Quadrant B |
|---|---|---|---|
| Quadrant D | 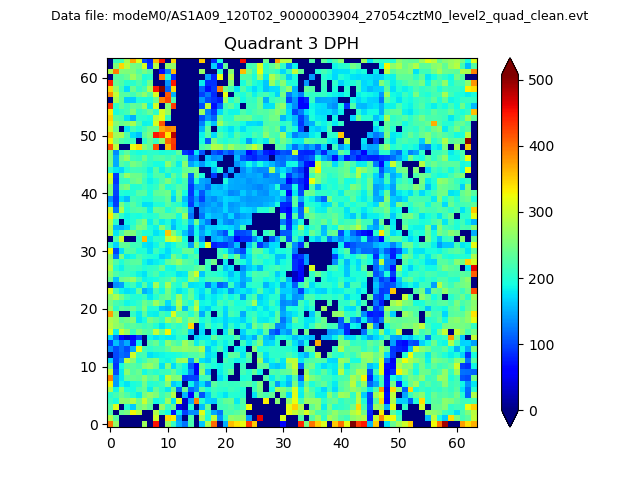 |
 |
Quadrant C |
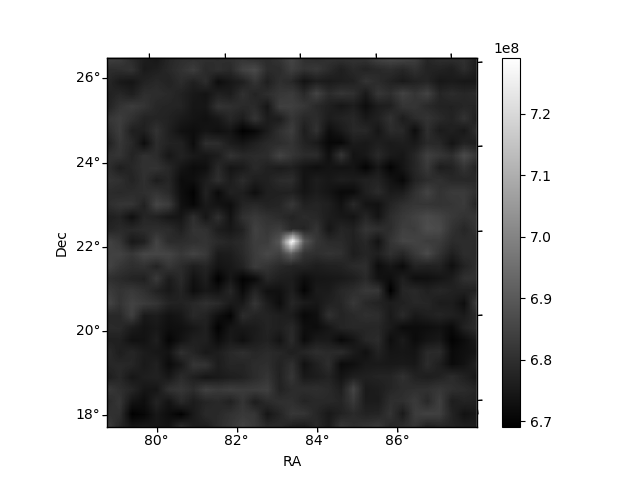
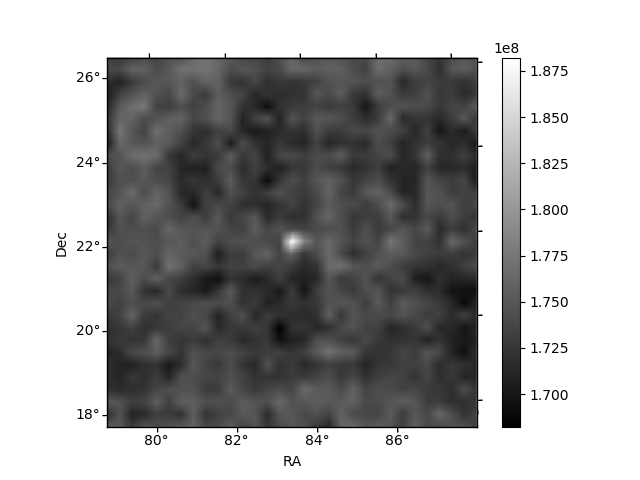
| Plot type | Count rate plots | Images |
|---|---|---|
| Comparison with Poisson distribution Blue bars denote a histogram of data divided into 1 sec bins. Red curve is a Poisson curve with rate = median count rate of data. |
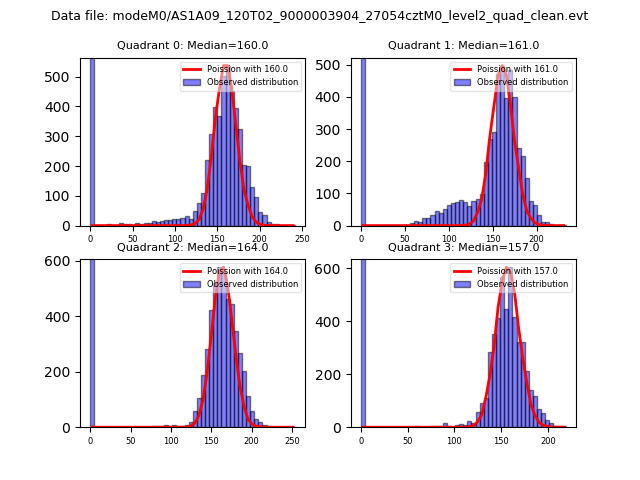 |
 |
| Quadrant-wise count rates Data is divided into 100 sec bins |
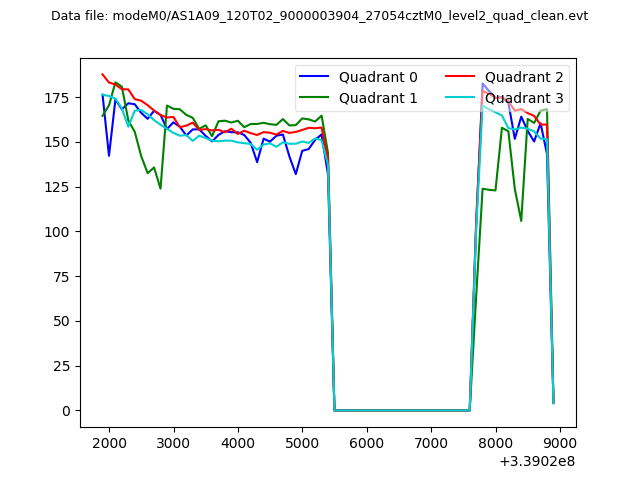 |
|
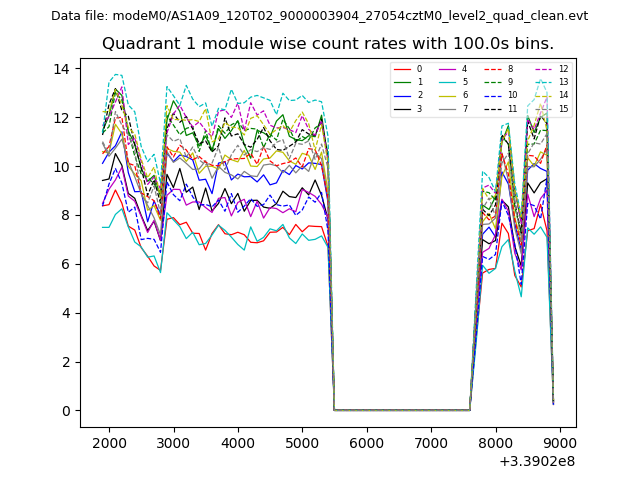
| Module-wise count rates for Quadrant A Data is divided into 100 sec bins |
 |
 |
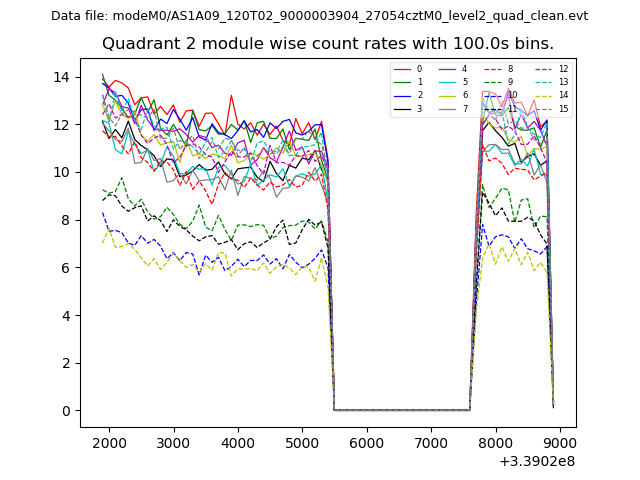
| Module-wise count rates for Quadrant B Data is divided into 100 sec bins |
 |
 |
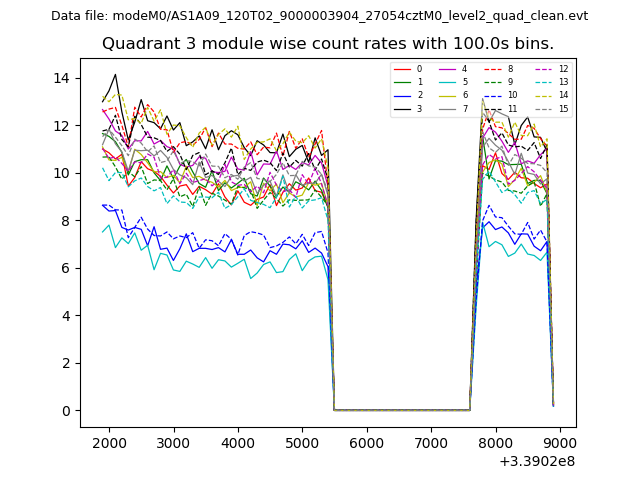
| Module-wise count rates for Quadrant C Data is divided into 100 sec bins |
 |
 |
| Module-wise count rates for Quadrant D Data is divided into 100 sec bins |
 |
 |
| Parameter | Plot |
|---|---|
| CZT HV Monitor | 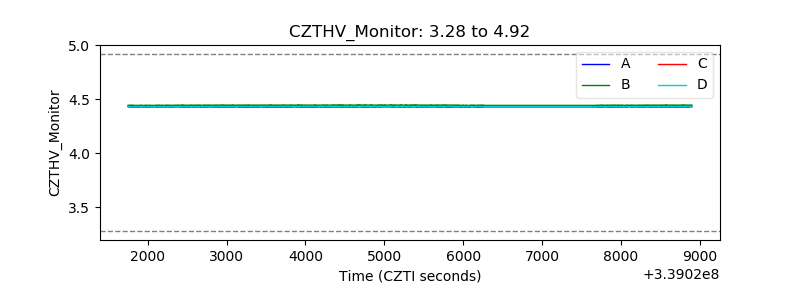 |
| D_VDD | 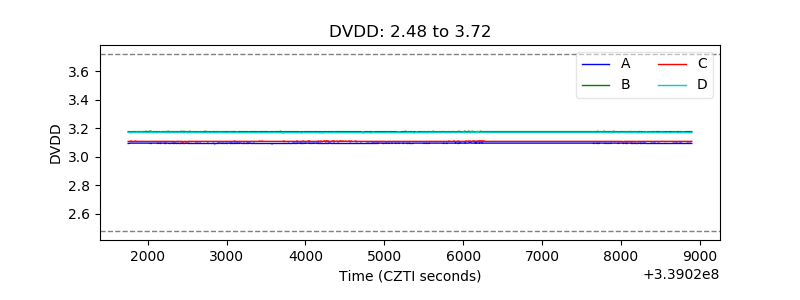 |
| Temperature 1 |  |
| Veto HV Monitor | 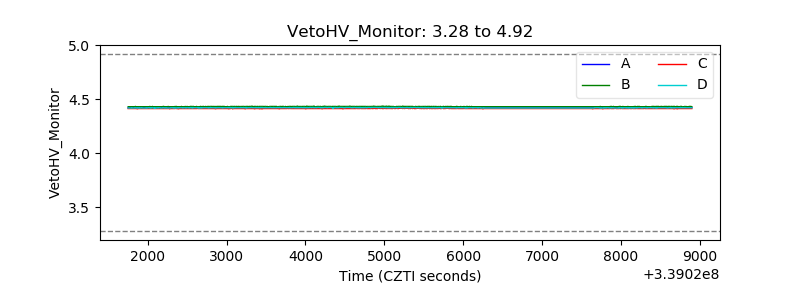 |
| Veto LLD |  |
| Alpha Counter | 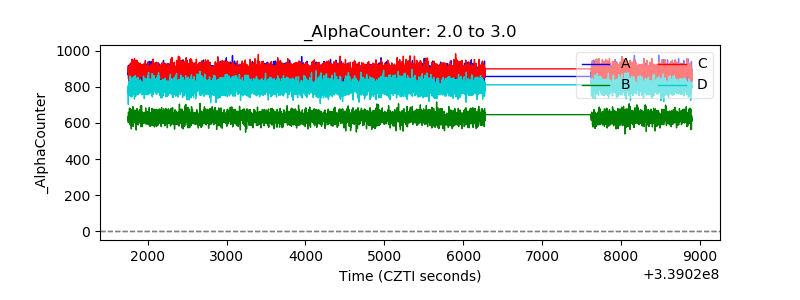 |
| _CPM_Rate | 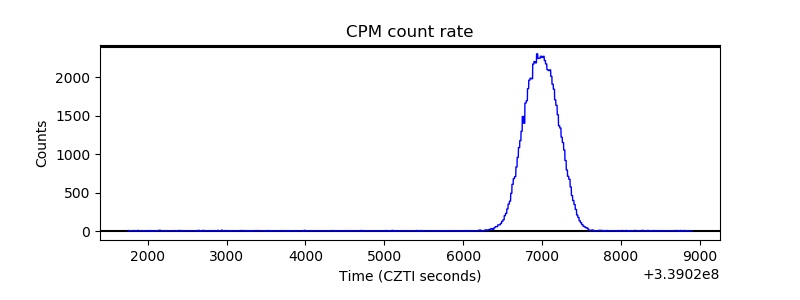 |
| CZT Counter | 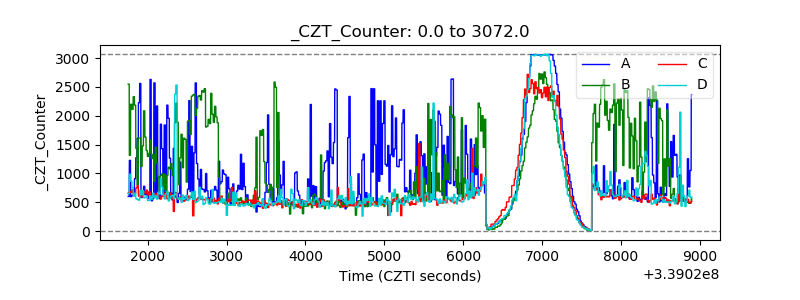 |
| +2.5 Volts monitor |  |
| +5 Volts monitor | 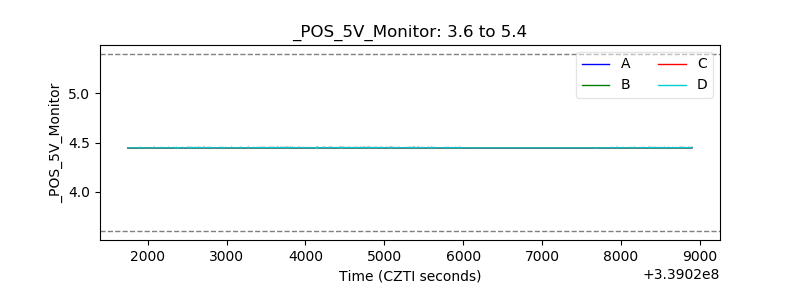 |
| _ROLL_ROT | 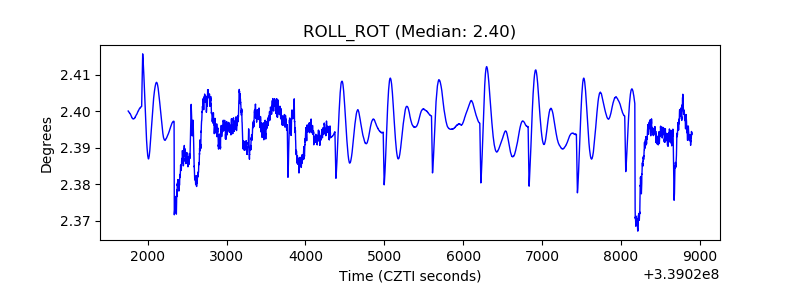 |
| _Roll_DEC | 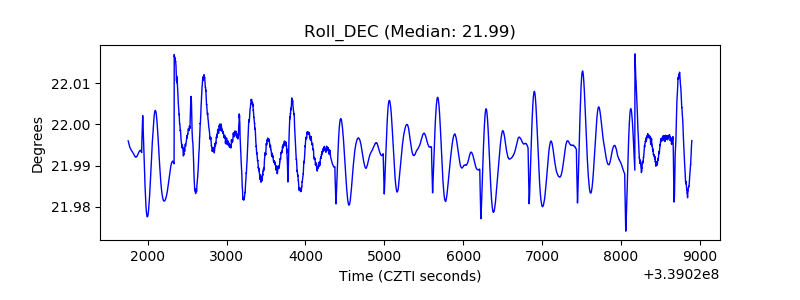 |
| _Roll_RA | 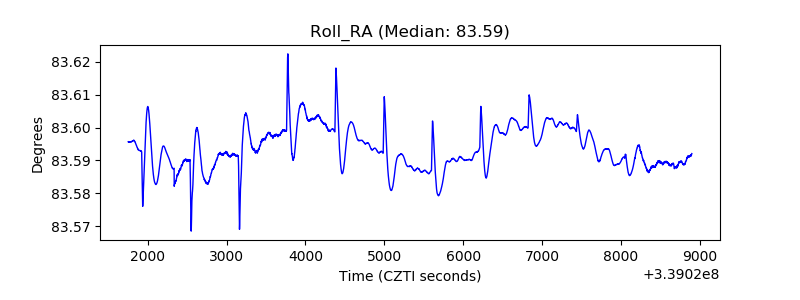 |
| Veto Counter | 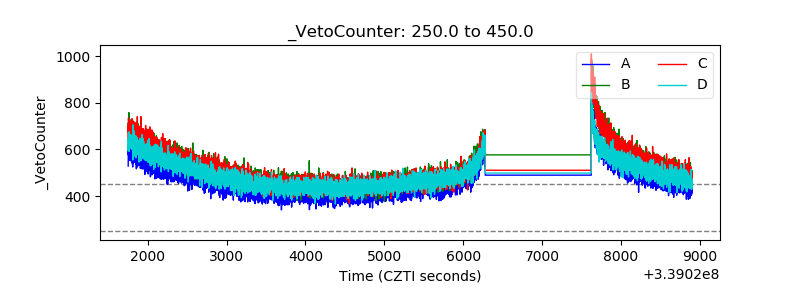 |