| Param | Original file | Final file |
|---|---|---|
| Filename | modeM0/AS1A09_120T02_9000003904_27055cztM0_level2.evt | modeM0/AS1A09_120T02_9000003904_27055cztM0_level2_quad_clean.evt |
| Size (bytes) | 712,569,600 | 114,217,920 |
| Size | 679.6 MB | 108.9 MB |
| Events in quadrant A | 6,017,479 | 731,146 |
| Events in quadrant B | 7,821,878 | 751,904 |
| Events in quadrant C | 3,416,119 | 782,964 |
| Events in quadrant D | 3,889,535 | 743,455 |
| Mode M9 | |||
|---|---|---|---|
| Quadrant | BADHDUFLAG | Total packets | Discarded packets |
| A | 0 | 15 | 0 |
| B | 0 | 16 | 0 |
| C | 0 | 16 | 0 |
| D | 0 | 16 | 0 |
| Mode M0 | |||
|---|---|---|---|
| Quadrant | BADHDUFLAG | Total packets | Discarded packets |
| A | 0 | 22201 | 0 |
| B | 0 | 27460 | 0 |
| C | 0 | 14009 | 0 |
| D | 0 | 15849 | 0 |
| Quadrant | Total seconds | Saturated seconds | Saturation percentage |
|---|---|---|---|
| A | 6435 | 829 | 12.882673% |
| B | 6435 | 1920 | 29.836830% |
| C | 6435 | 85 | 1.320901% |
| D | 6435 | 98 | 1.522922% |
Noise dominated data is calculated using 1-second bins in cleaned event files. If a bin has >2000 counts, and if more than 50% of those come from <1% of pixels, then it is considered to be noise-dominated and hence unusable.
| Quadrant | # 1 sec bins | Bins with >0 counts | Bins with >2000 counts | High rate bins dominated by noise | Noise dominated (total time) | Noise dominated (detector-on time) | Marked lightcurve |
|---|---|---|---|---|---|---|---|
| A | 7614 | 6434 | 768 | 768 | 10.09% | 11.94% | 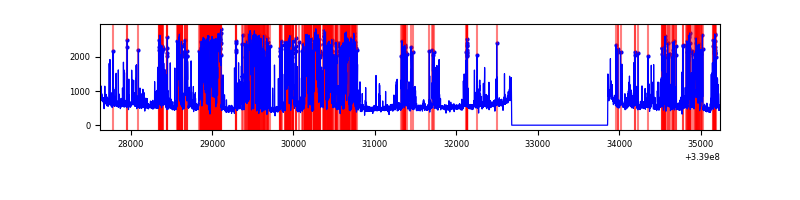 |
| B | 7614 | 6434 | 1462 | 1462 | 19.20% | 22.72% | 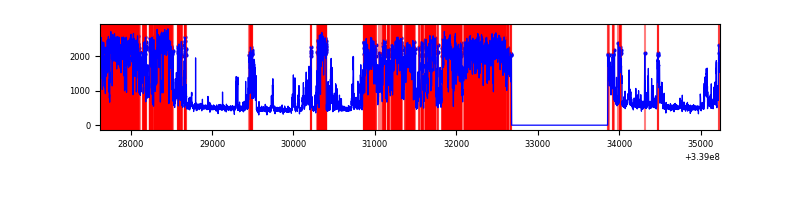 |
| C | 7614 | 6434 | 1 | 1 | 0.01% | 0.02% | 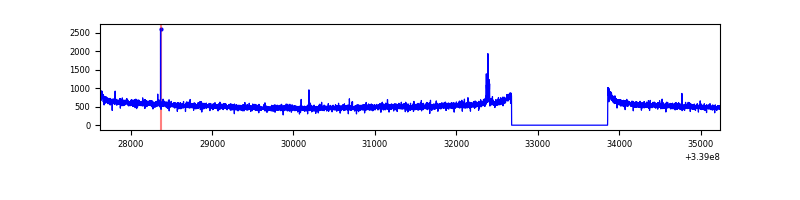 |
| D | 7614 | 6434 | 54 | 54 | 0.71% | 0.84% | 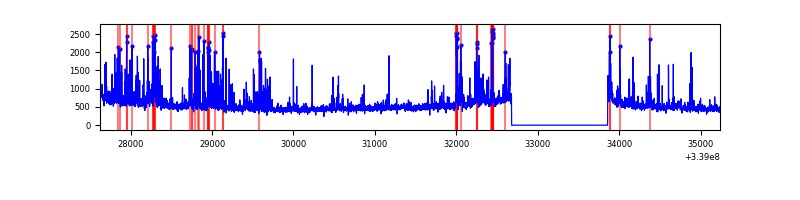 |
Top three noisy pixels from each quadrant. If the there are fewer than three noisy pixels in the level2.evt file, extra rows are filled as -1
| Pixel properties | Quadrant properties | ||||||
|---|---|---|---|---|---|---|---|
| Quadrant | DetID | PixID | Counts | Sigma | Mean | Median | Sigma |
| A | 14 | 235 | 2869509 | 17647.8 | 814 | 804 | 162.6 |
| A | 13 | 254 | 10646 | 60.55 | 814 | 804 | 162.6 |
| A | 3 | 137 | 7162 | 39.11 | 814 | 804 | 162.6 |
| B | 0 | 189 | 4667030 | 31673.6 | 776 | 760 | 147.3 |
| B | 10 | 246 | 85241 | 573.44 | 776 | 760 | 147.3 |
| B | 0 | 219 | 21094 | 138.02 | 776 | 760 | 147.3 |
| C | 14 | 238 | 134944 | 683.92 | 835 | 844 | 196.1 |
| C | 2 | 16 | 22813 | 112.04 | 835 | 844 | 196.1 |
| C | 15 | 208 | 8587 | 39.49 | 835 | 844 | 196.1 |
| D | 1 | 52 | 551328 | 2819.69 | 824 | 807 | 195.2 |
| D | 2 | 250 | 163134 | 831.42 | 824 | 807 | 195.2 |
| D | 12 | 233 | 35982 | 180.16 | 824 | 807 | 195.2 |
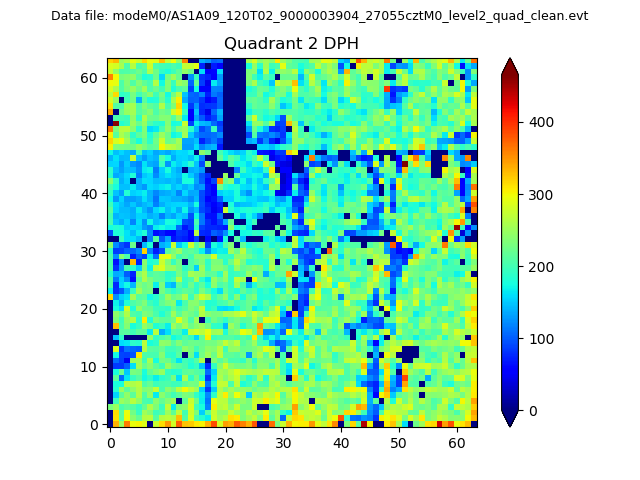
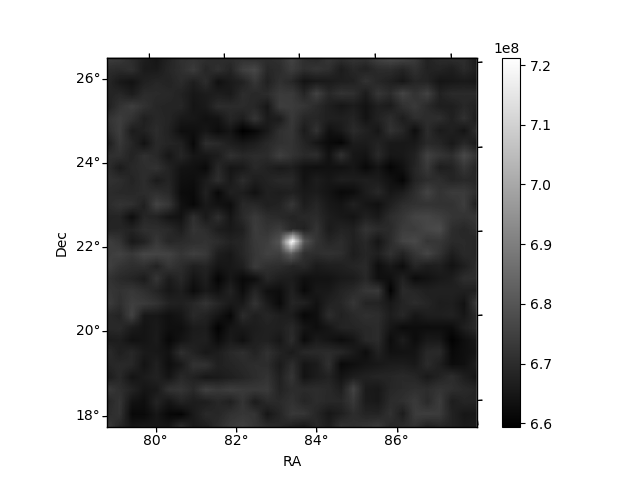
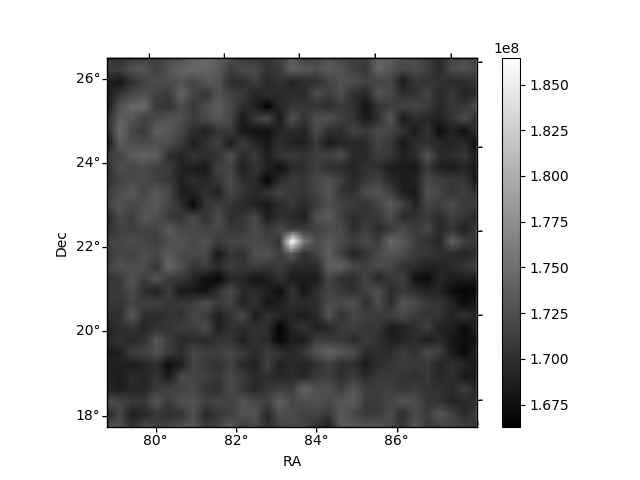
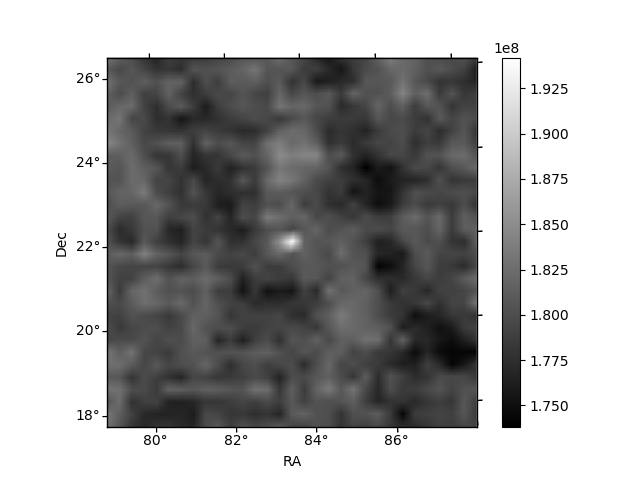
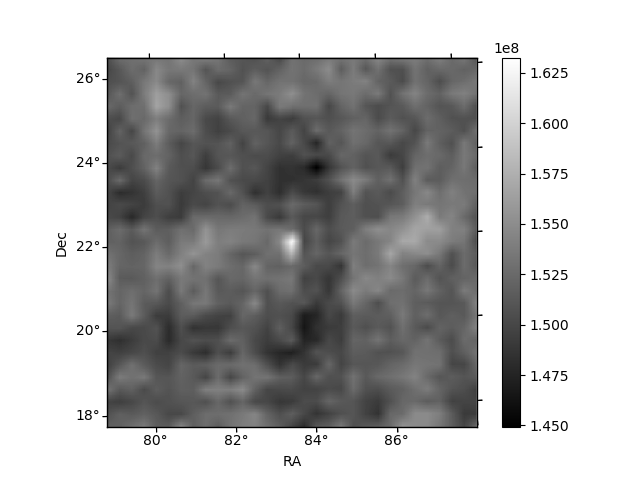
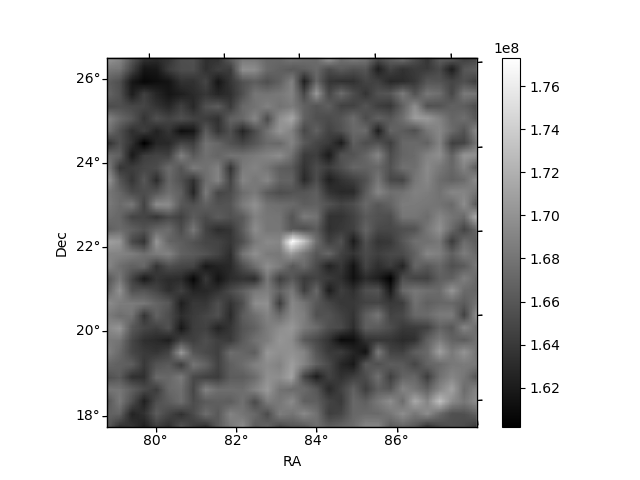
Histogram calculated using DETX and DETY for each event in the final _common_clean file
| Quadrant A | 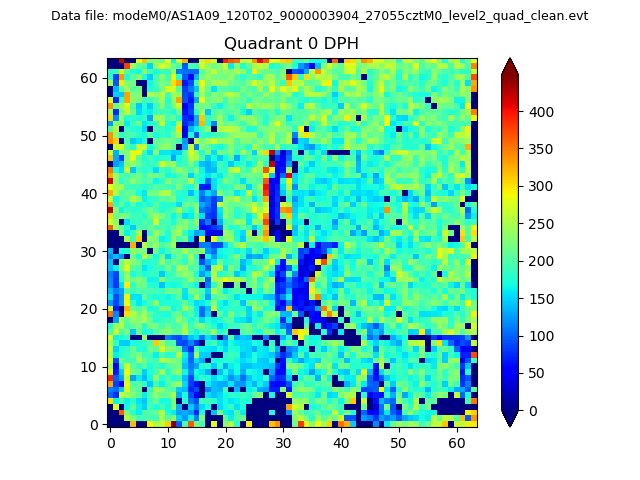 |
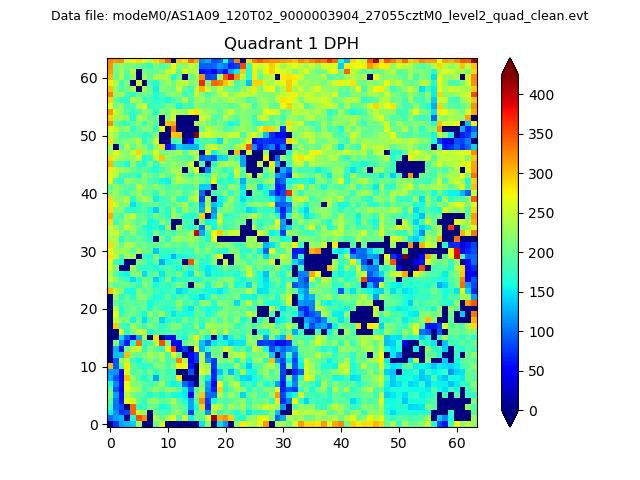 |
Quadrant B |
|---|---|---|---|
| Quadrant D | 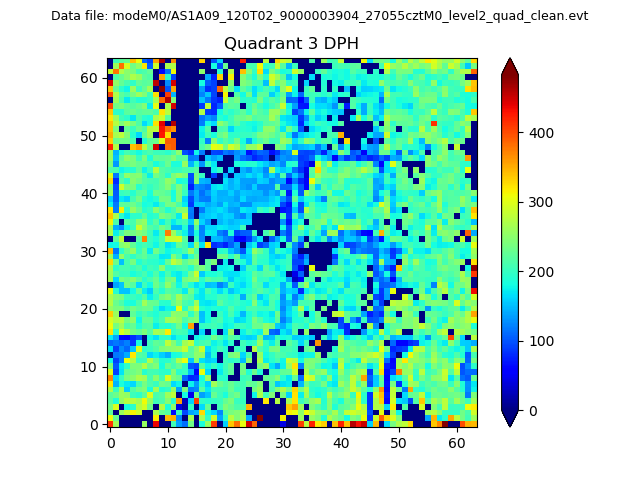 |
 |
Quadrant C |
| Plot type | Count rate plots | Images |
|---|---|---|
| Comparison with Poisson distribution Blue bars denote a histogram of data divided into 1 sec bins. Red curve is a Poisson curve with rate = median count rate of data. |
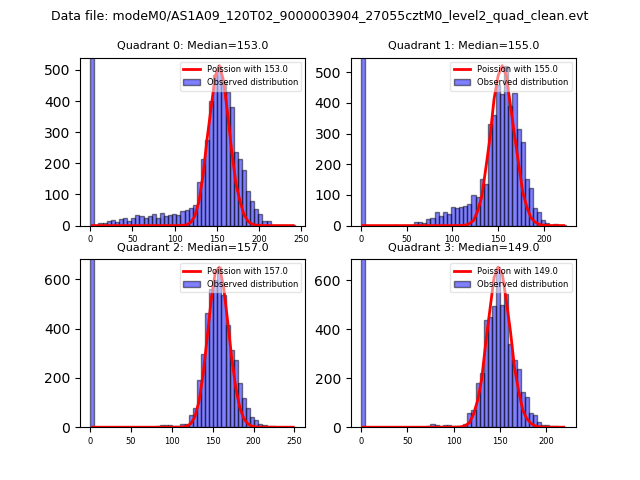 |
 |
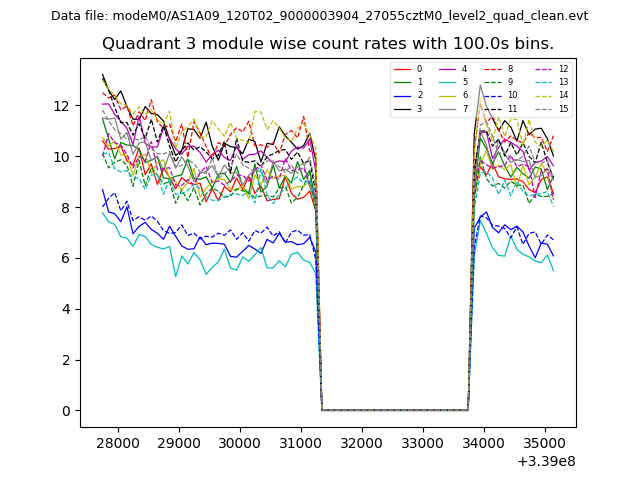
| Quadrant-wise count rates Data is divided into 100 sec bins |
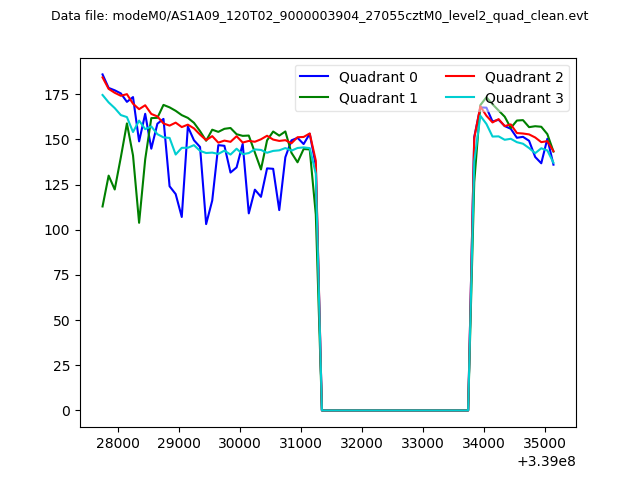 |
|
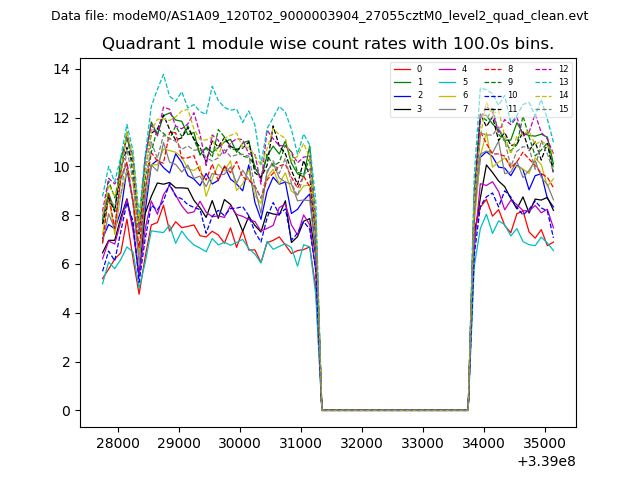
| Module-wise count rates for Quadrant A Data is divided into 100 sec bins |
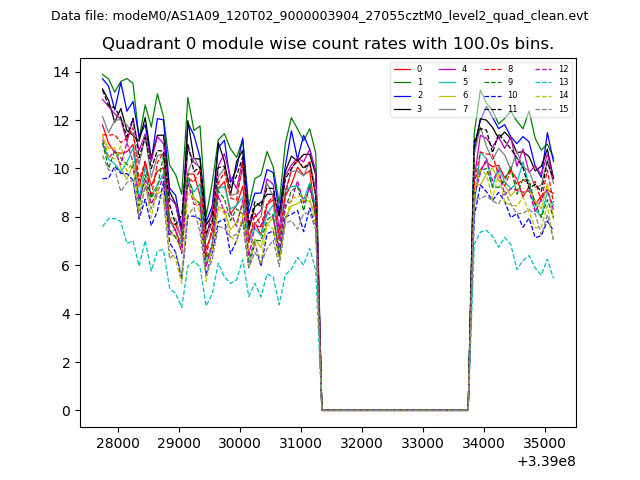 |
 |
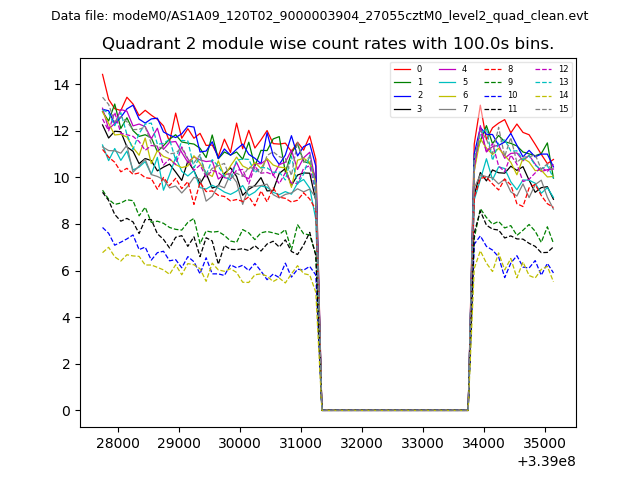
| Module-wise count rates for Quadrant B Data is divided into 100 sec bins |
 |
 |
| Module-wise count rates for Quadrant C Data is divided into 100 sec bins |
 |
 |
| Module-wise count rates for Quadrant D Data is divided into 100 sec bins |
 |
 |
| Parameter | Plot |
|---|---|
| CZT HV Monitor | 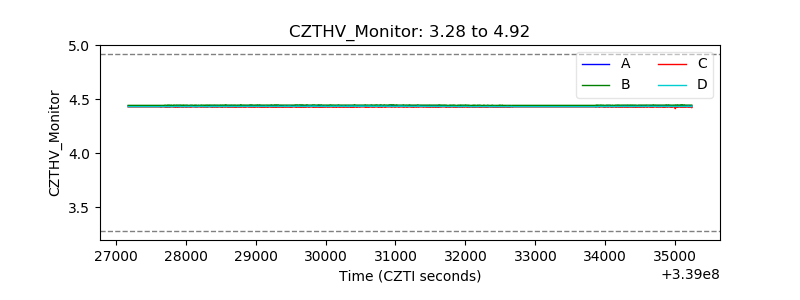 |
| D_VDD | 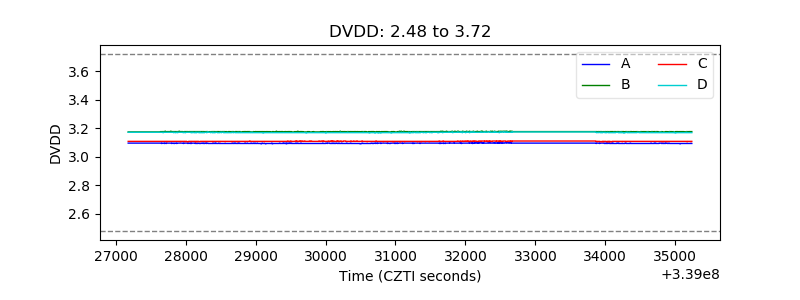 |
| Temperature 1 | 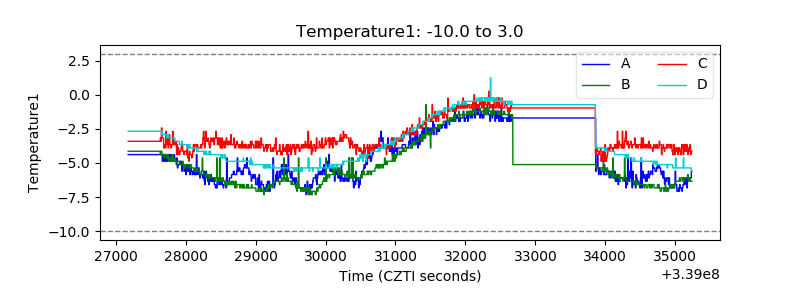 |
| Veto HV Monitor | 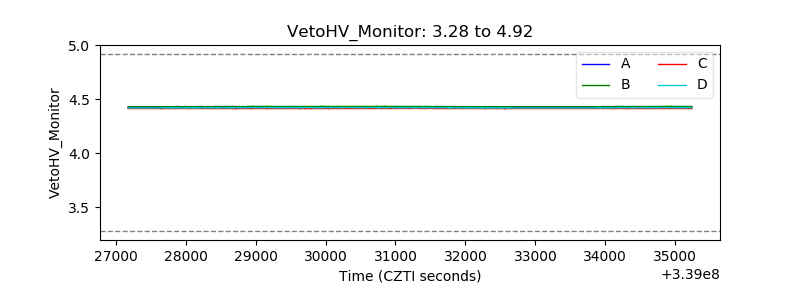 |
| Veto LLD | 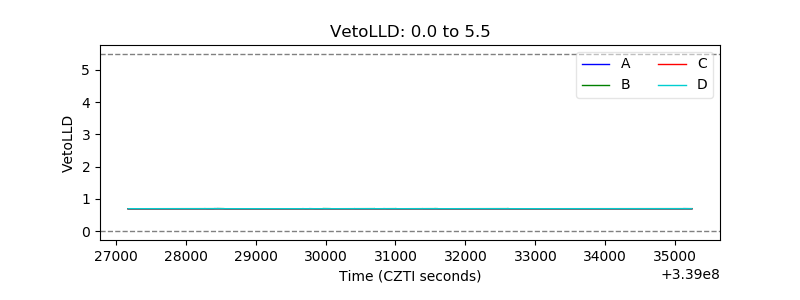 |
| Alpha Counter | 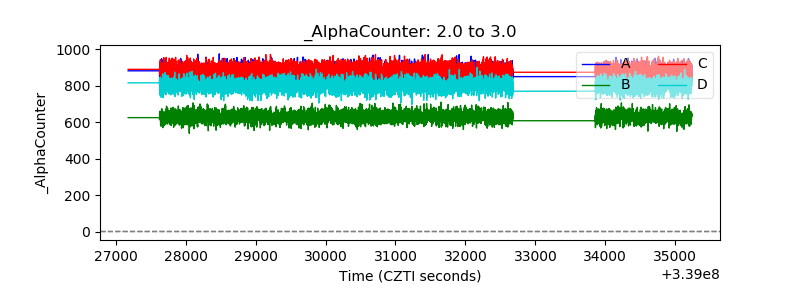 |
| _CPM_Rate | 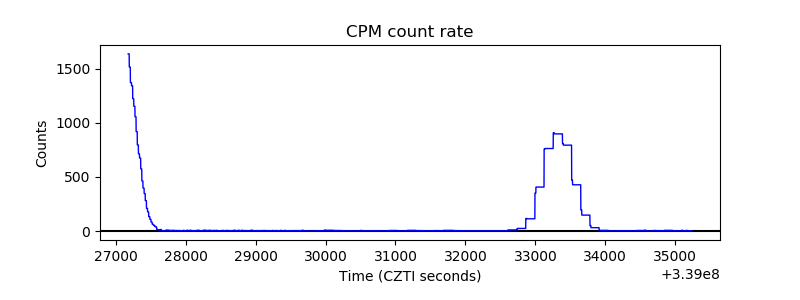 |
| CZT Counter | 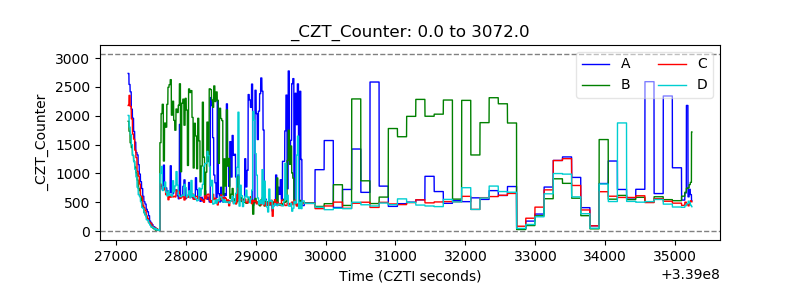 |
| +2.5 Volts monitor | 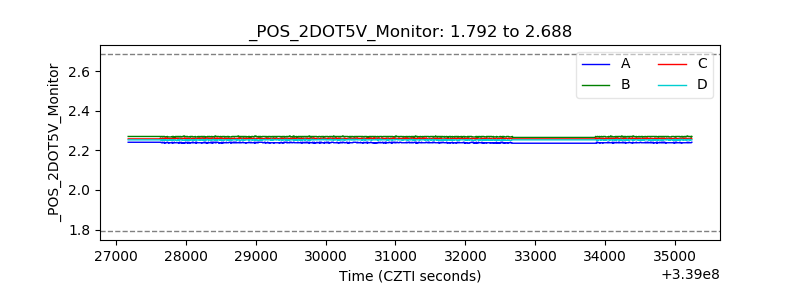 |
| +5 Volts monitor | 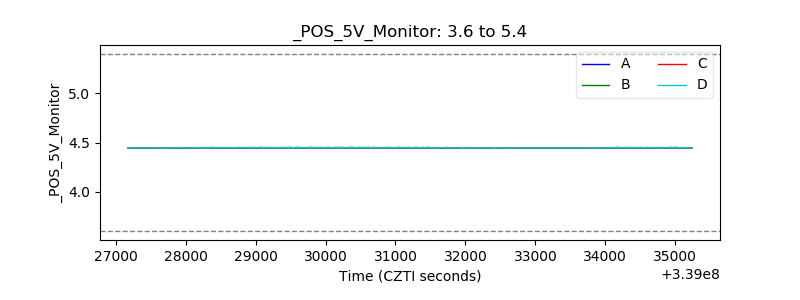 |
| _ROLL_ROT | 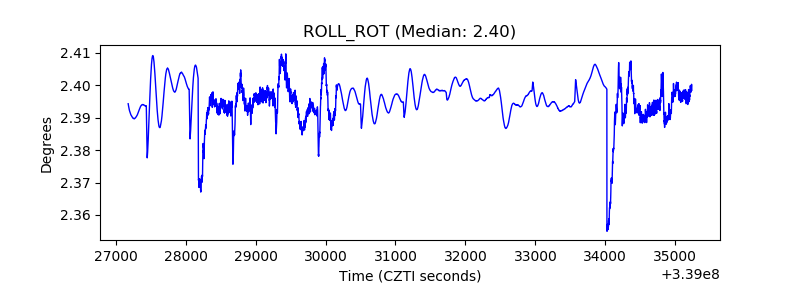 |
| _Roll_DEC | 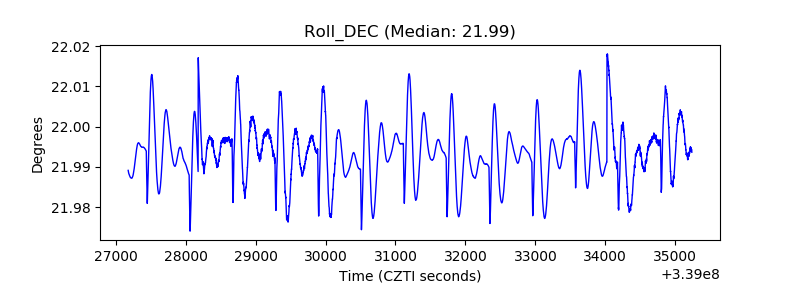 |
| _Roll_RA | 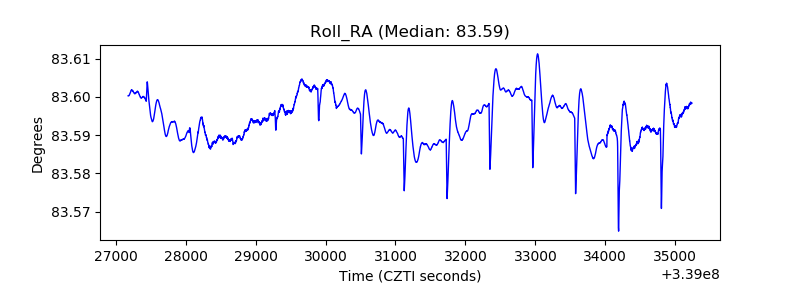 |
| Veto Counter | 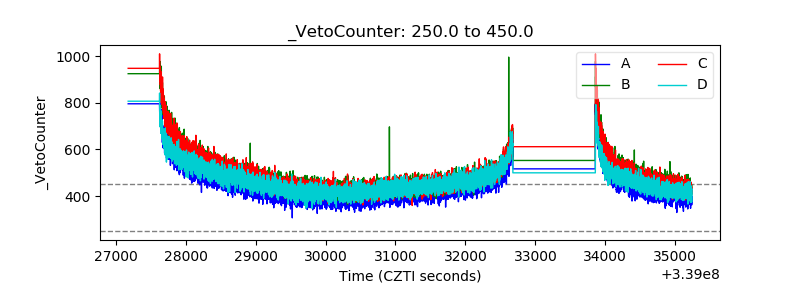 |