| Param | Original file | Final file |
|---|---|---|
| Filename | modeM0/AS1A09_120T02_9000003904_27056cztM0_level2.evt | modeM0/AS1A09_120T02_9000003904_27056cztM0_level2_quad_clean.evt |
| Size (bytes) | 716,088,960 | 107,043,840 |
| Size | 682.9 MB | 102.1 MB |
| Events in quadrant A | 6,288,084 | 669,330 |
| Events in quadrant B | 7,779,051 | 716,638 |
| Events in quadrant C | 3,471,369 | 704,070 |
| Events in quadrant D | 3,687,377 | 676,900 |
| Mode M9 | |||
|---|---|---|---|
| Quadrant | BADHDUFLAG | Total packets | Discarded packets |
| A | 0 | 15 | 0 |
| B | 0 | 16 | 0 |
| C | 0 | 16 | 0 |
| D | 0 | 16 | 0 |
| Mode M0 | |||
|---|---|---|---|
| Quadrant | BADHDUFLAG | Total packets | Discarded packets |
| A | 0 | 23191 | 0 |
| B | 0 | 27637 | 0 |
| C | 0 | 14408 | 0 |
| D | 0 | 15536 | 0 |
| Quadrant | Total seconds | Saturated seconds | Saturation percentage |
|---|---|---|---|
| A | 6812 | 803 | 11.788021% |
| B | 6812 | 2050 | 30.093952% |
| C | 6812 | 116 | 1.702877% |
| D | 6811 | 114 | 1.673763% |
Noise dominated data is calculated using 1-second bins in cleaned event files. If a bin has >2000 counts, and if more than 50% of those come from <1% of pixels, then it is considered to be noise-dominated and hence unusable.
| Quadrant | # 1 sec bins | Bins with >0 counts | Bins with >2000 counts | High rate bins dominated by noise | Noise dominated (total time) | Noise dominated (detector-on time) | Marked lightcurve |
|---|---|---|---|---|---|---|---|
| A | 7651 | 6811 | 649 | 649 | 8.48% | 9.53% | 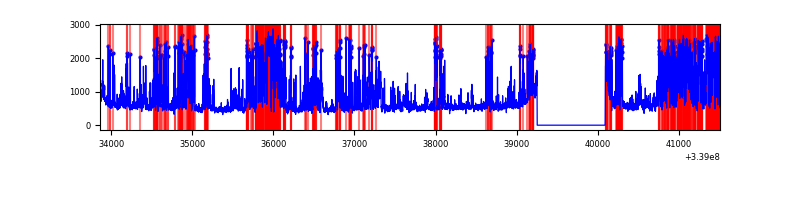 |
| B | 7651 | 6811 | 1508 | 1508 | 19.71% | 22.14% | 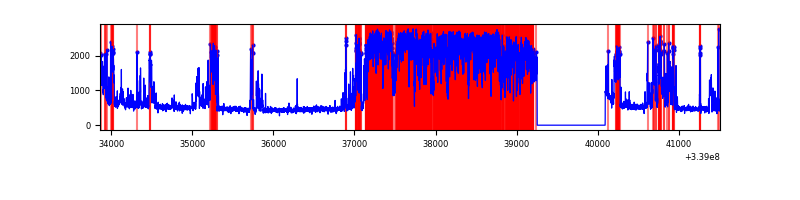 |
| C | 7651 | 6811 | 0 | 0 | 0.00% | 0.00% | 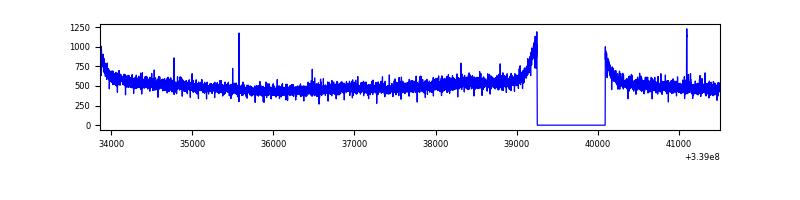 |
| D | 7650 | 6810 | 46 | 46 | 0.60% | 0.68% | 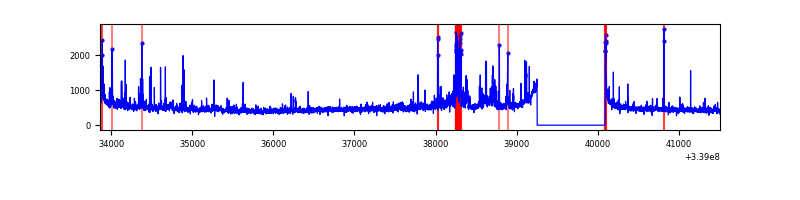 |
Top three noisy pixels from each quadrant. If the there are fewer than three noisy pixels in the level2.evt file, extra rows are filled as -1
| Pixel properties | Quadrant properties | ||||||
|---|---|---|---|---|---|---|---|
| Quadrant | DetID | PixID | Counts | Sigma | Mean | Median | Sigma |
| A | 14 | 235 | 3026883 | 17919.25 | 845 | 830 | 168.9 |
| A | 13 | 254 | 11202 | 61.42 | 845 | 830 | 168.9 |
| A | 3 | 137 | 7584 | 39.99 | 845 | 830 | 168.9 |
| B | 0 | 189 | 4564376 | 30343.94 | 786 | 770 | 150.4 |
| B | 10 | 246 | 84079 | 553.93 | 786 | 770 | 150.4 |
| B | 0 | 182 | 25418 | 163.89 | 786 | 770 | 150.4 |
| C | 14 | 238 | 137488 | 673.92 | 854 | 861 | 202.7 |
| C | 3 | 9 | 6114 | 25.91 | 854 | 861 | 202.7 |
| C | 13 | 61 | 5790 | 24.31 | 854 | 861 | 202.7 |
| D | 1 | 52 | 191747 | 938.81 | 846 | 826 | 203.4 |
| D | 2 | 250 | 185997 | 910.54 | 846 | 826 | 203.4 |
| D | 7 | 38 | 53296 | 258.01 | 846 | 826 | 203.4 |
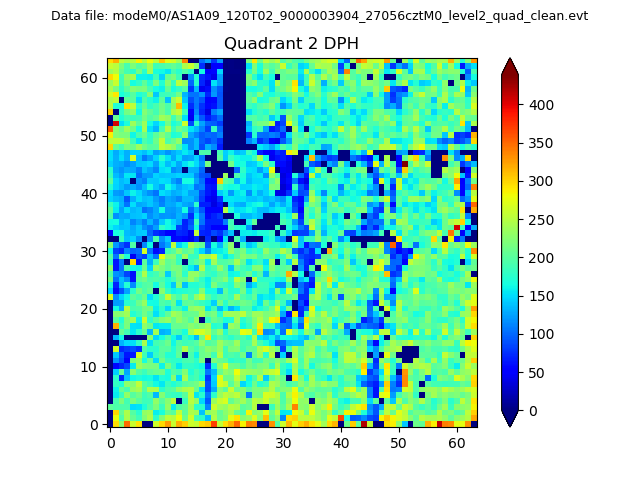
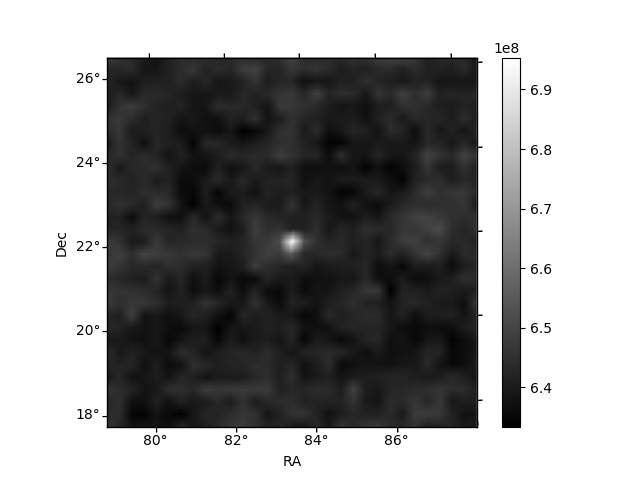
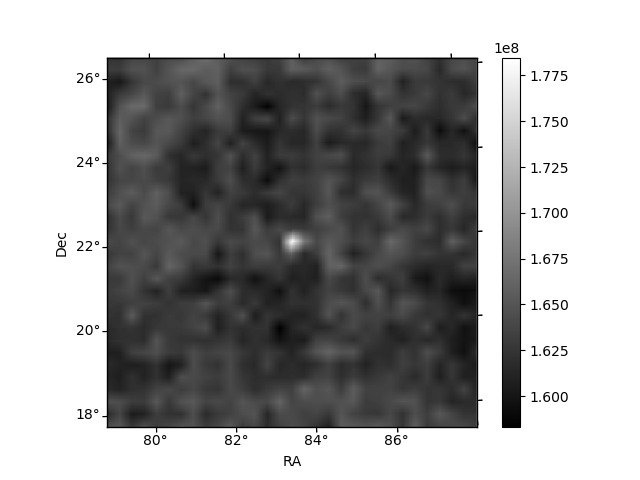
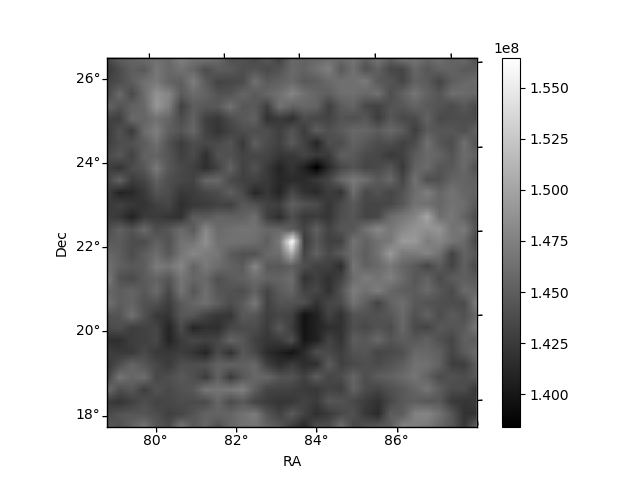
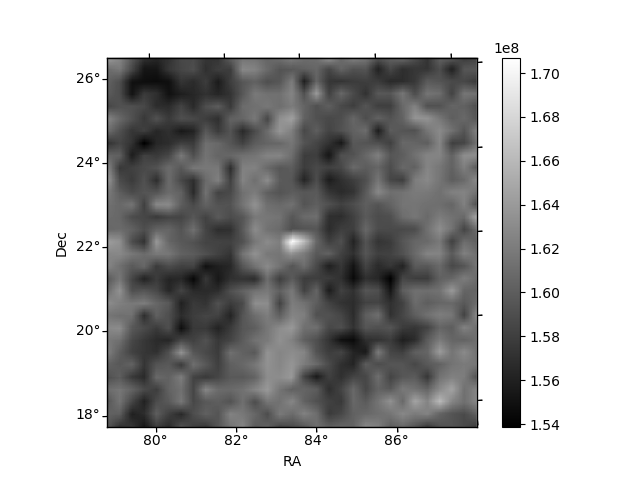
Histogram calculated using DETX and DETY for each event in the final _common_clean file
| Quadrant A | 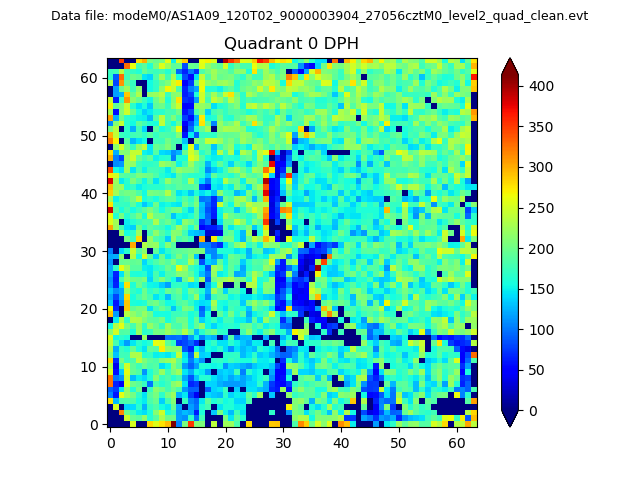 |
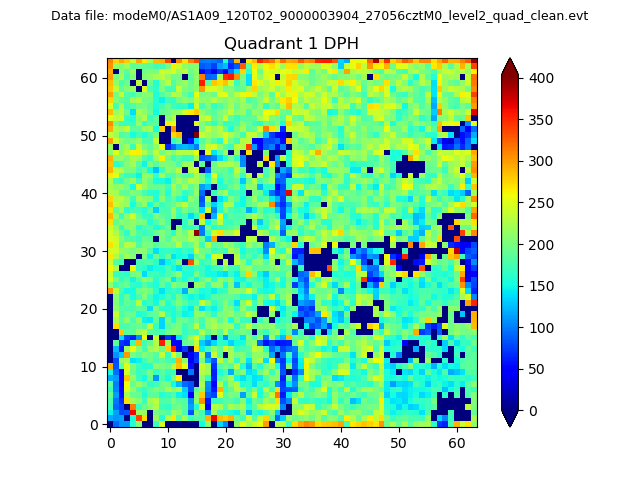 |
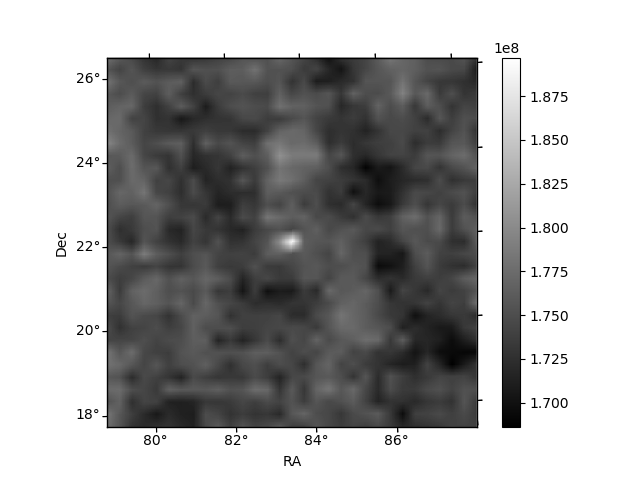
Quadrant B |
|---|---|---|---|
| Quadrant D | 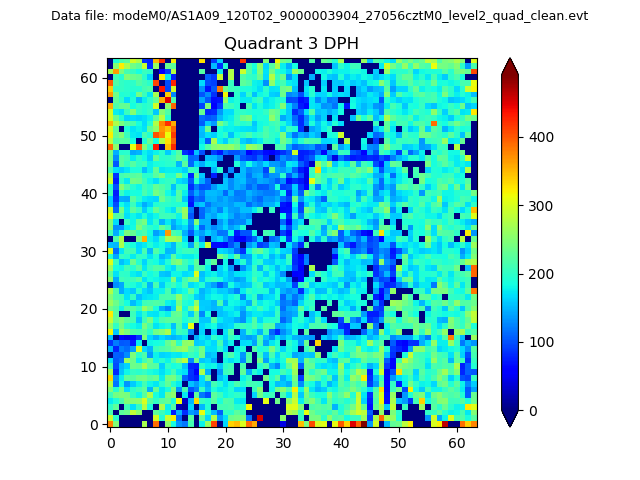 |
 |
Quadrant C |
| Plot type | Count rate plots | Images |
|---|---|---|
| Comparison with Poisson distribution Blue bars denote a histogram of data divided into 1 sec bins. Red curve is a Poisson curve with rate = median count rate of data. |
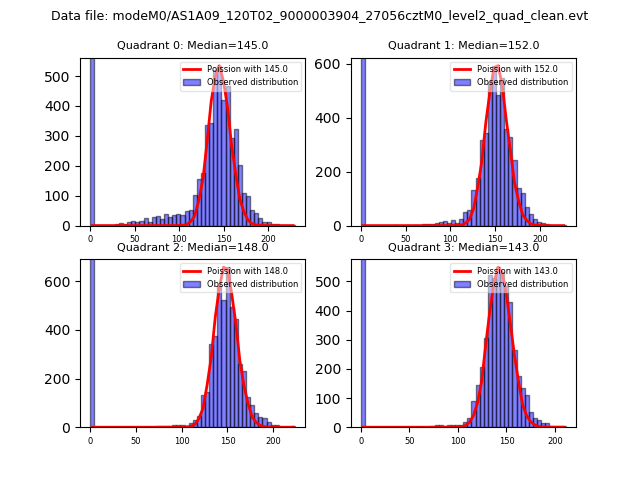 |
 |
| Quadrant-wise count rates Data is divided into 100 sec bins |
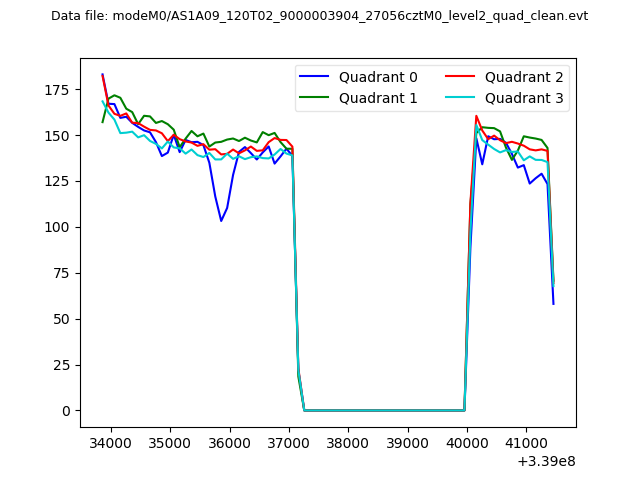 |
|
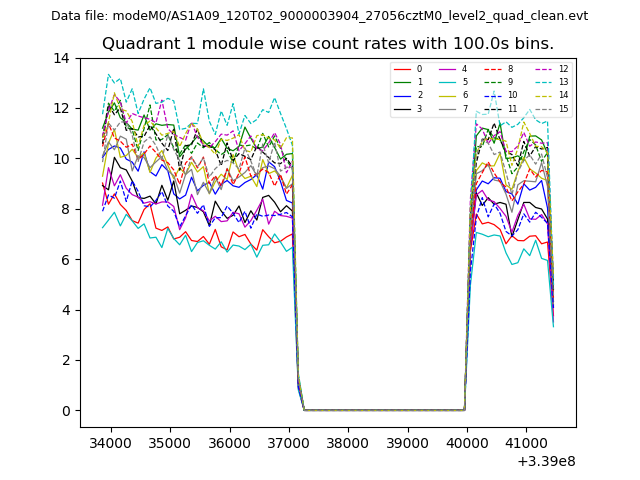
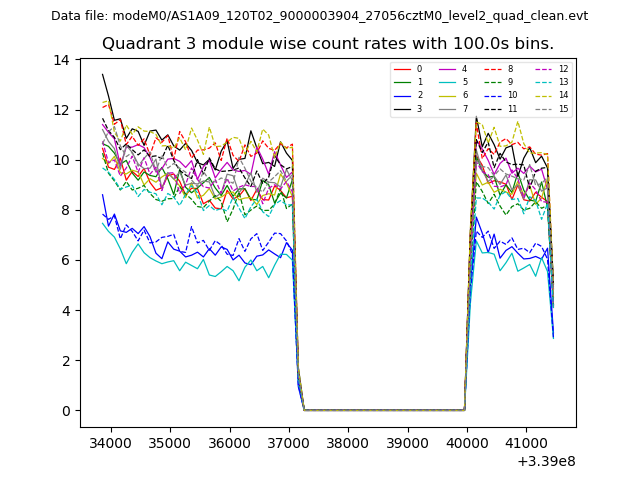
| Module-wise count rates for Quadrant A Data is divided into 100 sec bins |
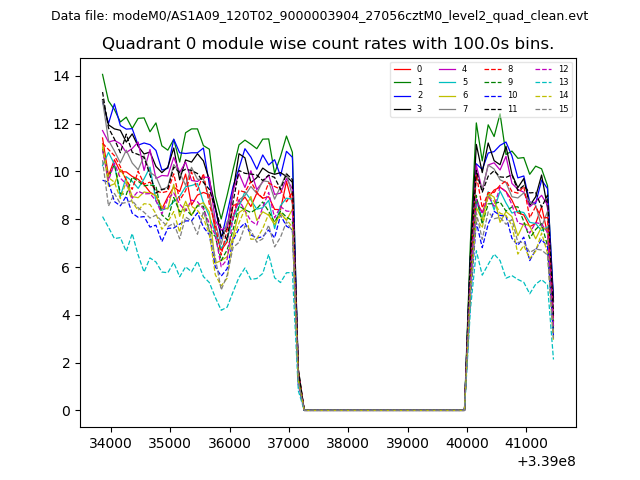 |
 |
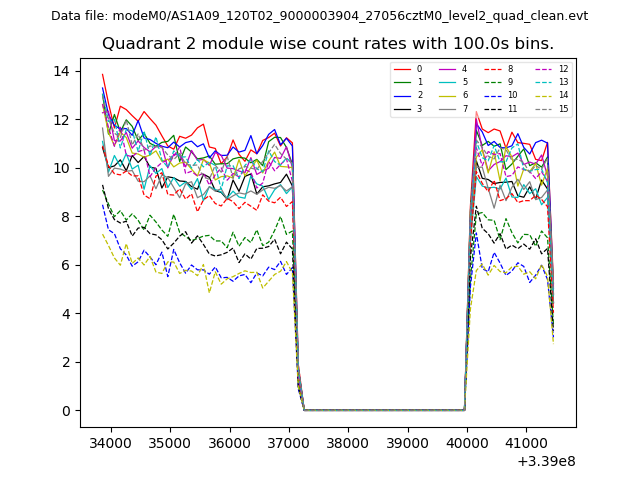
| Module-wise count rates for Quadrant B Data is divided into 100 sec bins |
 |
 |
| Module-wise count rates for Quadrant C Data is divided into 100 sec bins |
 |
 |
| Module-wise count rates for Quadrant D Data is divided into 100 sec bins |
 |
 |
| Parameter | Plot |
|---|---|
| CZT HV Monitor | 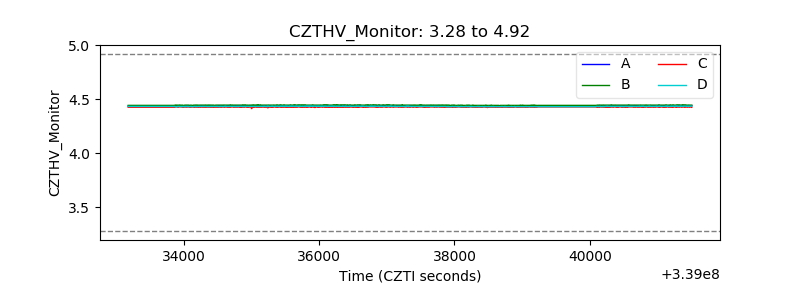 |
| D_VDD | 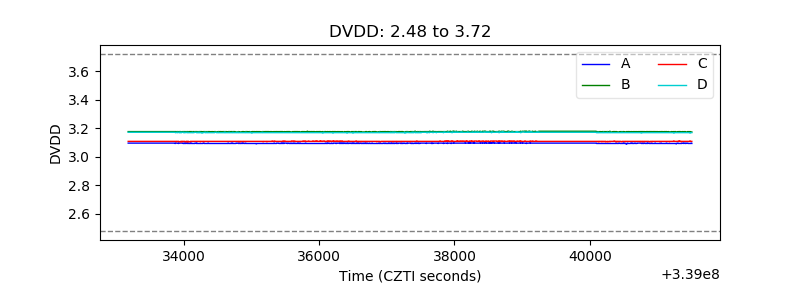 |
| Temperature 1 | 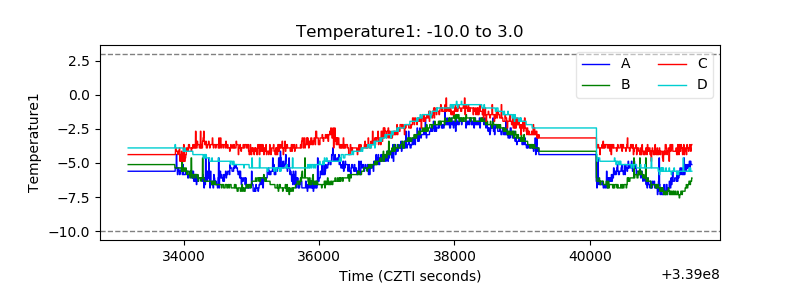 |
| Veto HV Monitor | 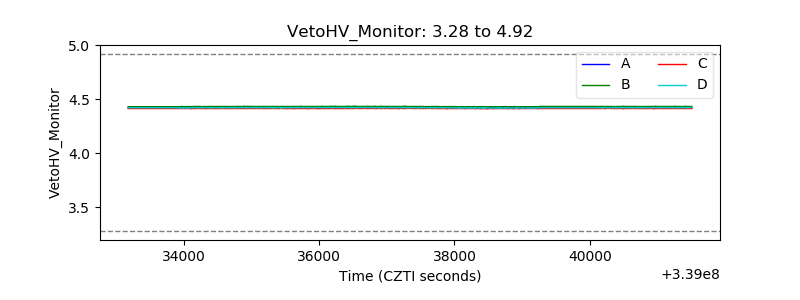 |
| Veto LLD | 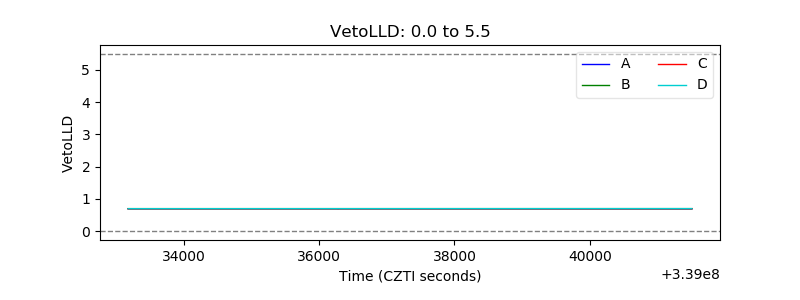 |
| Alpha Counter | 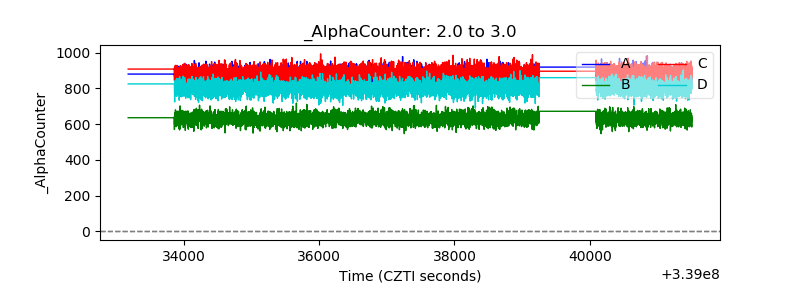 |
| _CPM_Rate |  |
| CZT Counter | 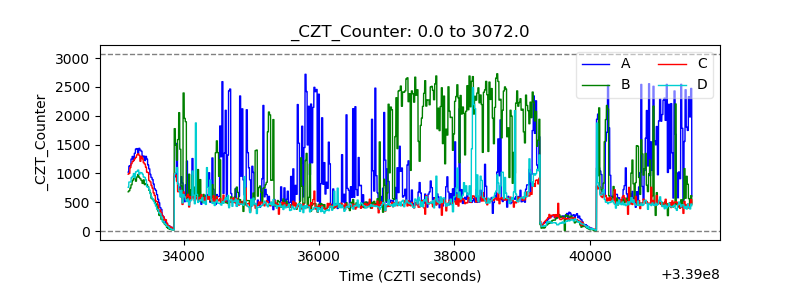 |
| +2.5 Volts monitor |  |
| +5 Volts monitor |  |
| _ROLL_ROT | 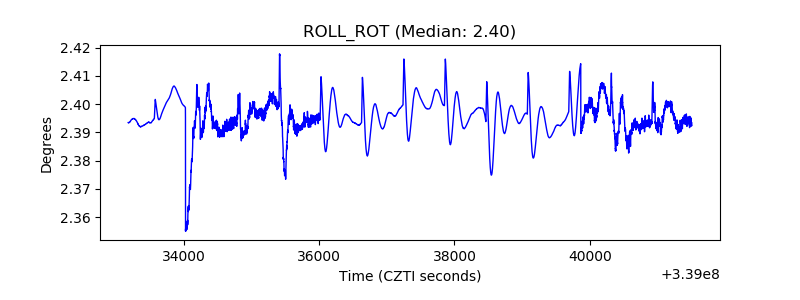 |
| _Roll_DEC | 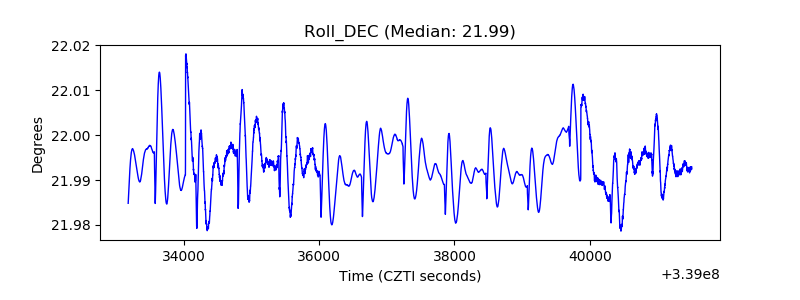 |
| _Roll_RA | 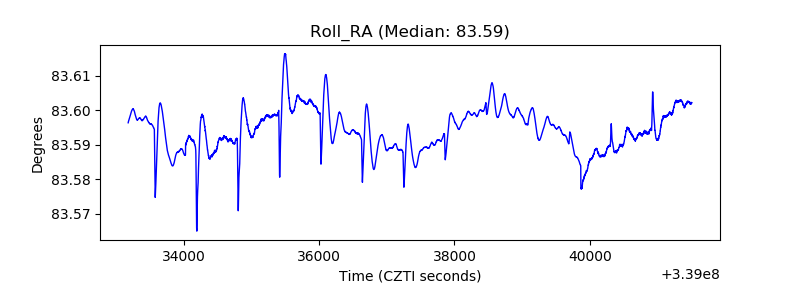 |
| Veto Counter | 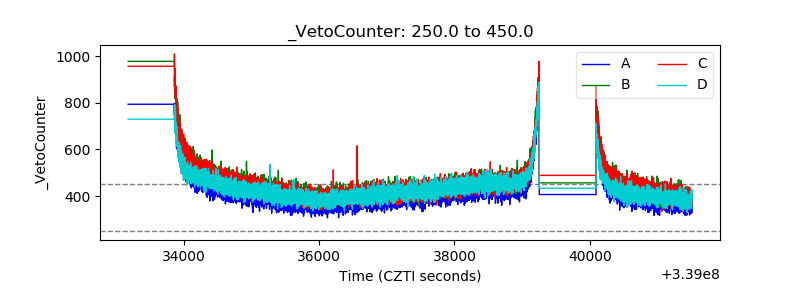 |