| Param | Original file | Final file |
|---|---|---|
| Filename | modeM0/AS1A09_120T02_9000003904_27057cztM0_level2.evt | modeM0/AS1A09_120T02_9000003904_27057cztM0_level2_quad_clean.evt |
| Size (bytes) | 905,339,520 | 113,653,440 |
| Size | 863.4 MB | 108.4 MB |
| Events in quadrant A | 8,338,622 | 692,728 |
| Events in quadrant B | 9,694,475 | 727,173 |
| Events in quadrant C | 3,777,189 | 759,894 |
| Events in quadrant D | 5,095,952 | 733,502 |
| Mode M9 | |||
|---|---|---|---|
| Quadrant | BADHDUFLAG | Total packets | Discarded packets |
| A | 0 | 14 | 0 |
| B | 0 | 14 | 0 |
| C | 0 | 14 | 0 |
| D | 0 | 14 | 0 |
| Mode M0 | |||
|---|---|---|---|
| Quadrant | BADHDUFLAG | Total packets | Discarded packets |
| A | 0 | 29817 | 0 |
| B | 0 | 33890 | 0 |
| C | 0 | 15926 | 0 |
| D | 0 | 20521 | 0 |
| Quadrant | Total seconds | Saturated seconds | Saturation percentage |
|---|---|---|---|
| A | 7593 | 1454 | 19.149216% |
| B | 7594 | 2623 | 34.540427% |
| C | 7594 | 119 | 1.567027% |
| D | 7594 | 341 | 4.490387% |
Noise dominated data is calculated using 1-second bins in cleaned event files. If a bin has >2000 counts, and if more than 50% of those come from <1% of pixels, then it is considered to be noise-dominated and hence unusable.
| Quadrant | # 1 sec bins | Bins with >0 counts | Bins with >2000 counts | High rate bins dominated by noise | Noise dominated (total time) | Noise dominated (detector-on time) | Marked lightcurve |
|---|---|---|---|---|---|---|---|
| A | 8938 | 7593 | 1272 | 1272 | 14.23% | 16.75% | 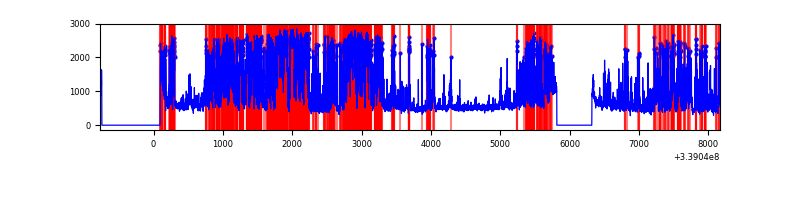 |
| B | 8939 | 7594 | 2177 | 2177 | 24.35% | 28.67% | 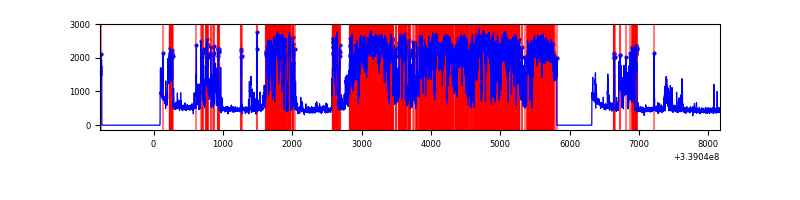 |
| C | 8939 | 7594 | 1 | 1 | 0.01% | 0.01% | 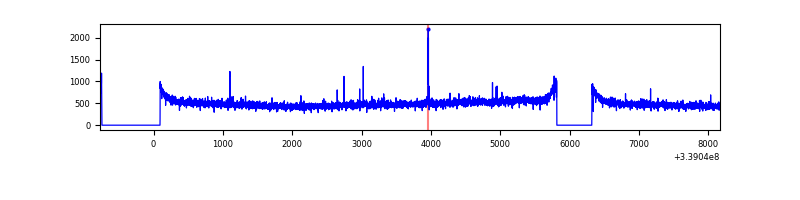 |
| D | 8939 | 7595 | 223 | 223 | 2.49% | 2.94% | 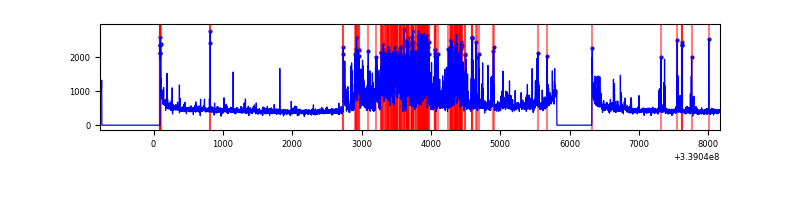 |
Top three noisy pixels from each quadrant. If the there are fewer than three noisy pixels in the level2.evt file, extra rows are filled as -1
| Pixel properties | Quadrant properties | ||||||
|---|---|---|---|---|---|---|---|
| Quadrant | DetID | PixID | Counts | Sigma | Mean | Median | Sigma |
| A | 14 | 235 | 4898794 | 27464.04 | 890 | 874 | 178.3 |
| A | 13 | 254 | 11851 | 61.55 | 890 | 874 | 178.3 |
| A | 6 | 16 | 8256 | 41.39 | 890 | 874 | 178.3 |
| B | 0 | 189 | 6146407 | 38215.23 | 837 | 817 | 160.8 |
| B | 10 | 246 | 180114 | 1114.93 | 837 | 817 | 160.8 |
| B | 10 | 245 | 61516 | 377.45 | 837 | 817 | 160.8 |
| C | 14 | 238 | 148901 | 671.31 | 924 | 932 | 220.4 |
| C | 15 | 208 | 21125 | 91.61 | 924 | 932 | 220.4 |
| C | 3 | 9 | 13603 | 57.49 | 924 | 932 | 220.4 |
| D | 1 | 52 | 1443191 | 6543.93 | 912 | 890 | 220.4 |
| D | 2 | 250 | 149417 | 673.89 | 912 | 890 | 220.4 |
| D | 2 | 234 | 30968 | 136.47 | 912 | 890 | 220.4 |
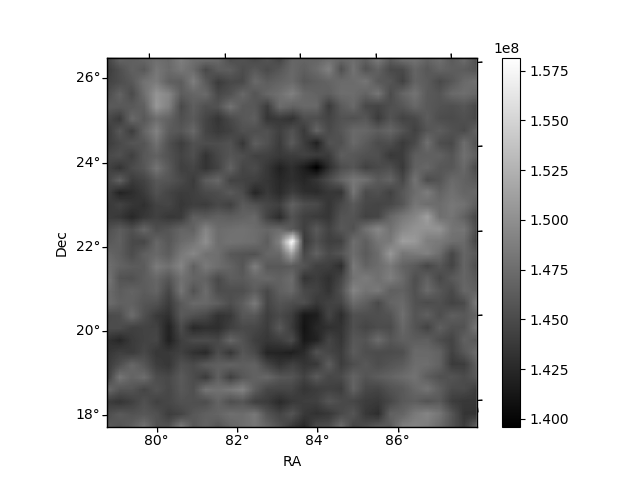
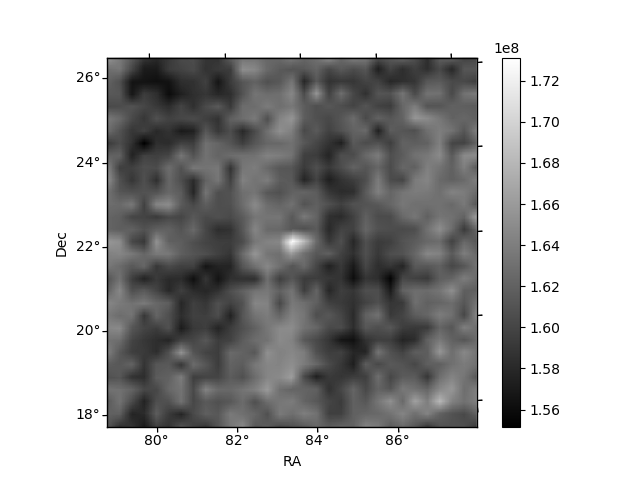
Histogram calculated using DETX and DETY for each event in the final _common_clean file
| Quadrant A | 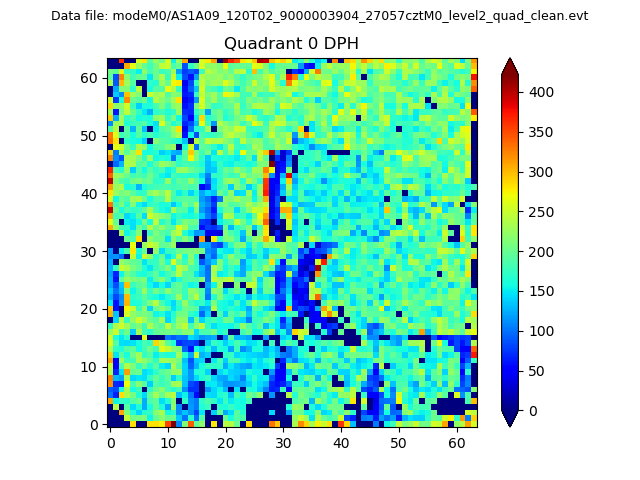 |
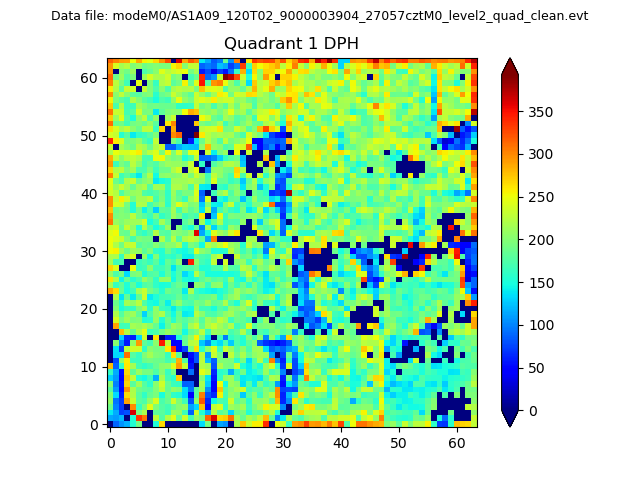 |
Quadrant B |
|---|---|---|---|
| Quadrant D | 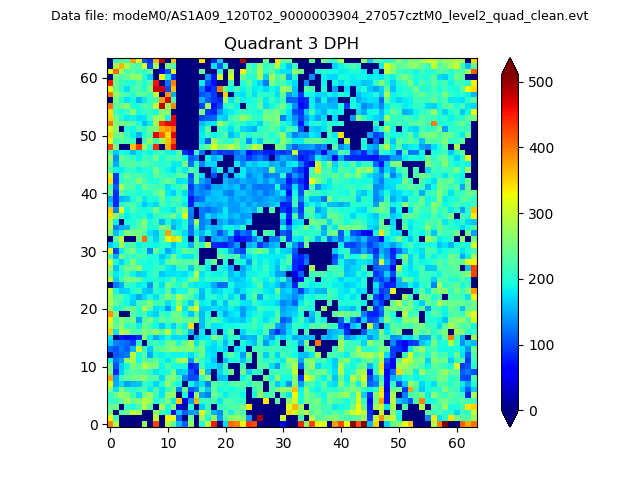 |
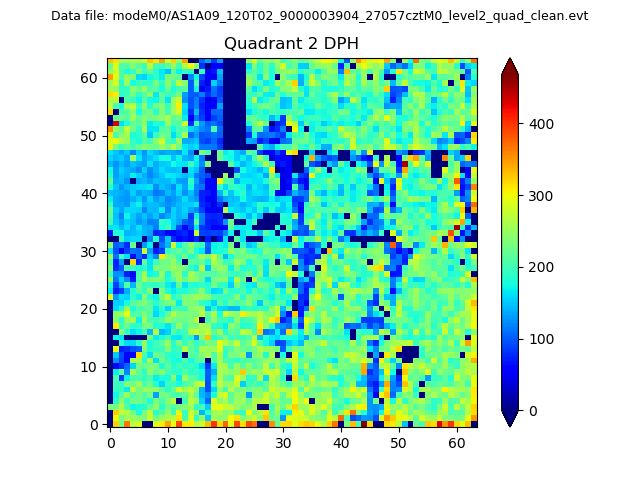 |
Quadrant C |
| Plot type | Count rate plots | Images |
|---|---|---|
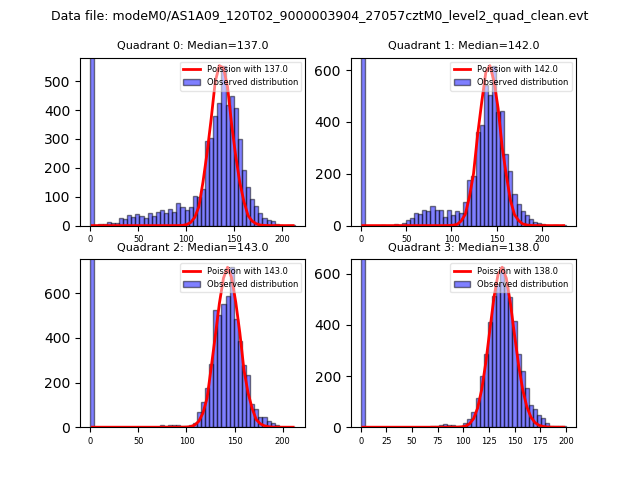
| Comparison with Poisson distribution Blue bars denote a histogram of data divided into 1 sec bins. Red curve is a Poisson curve with rate = median count rate of data. |
 |
 |
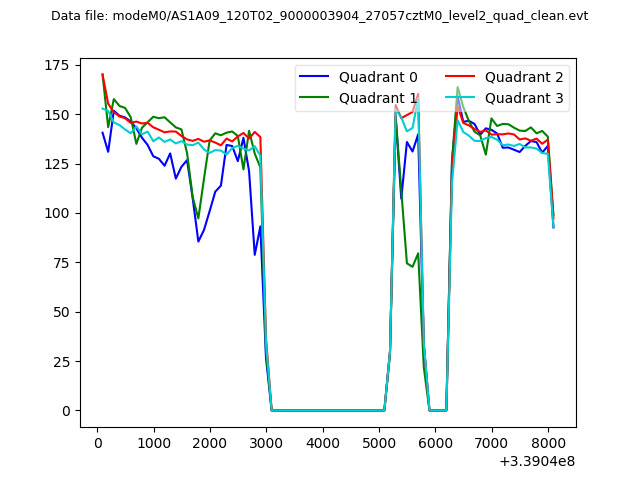
| Quadrant-wise count rates Data is divided into 100 sec bins |
 |
|
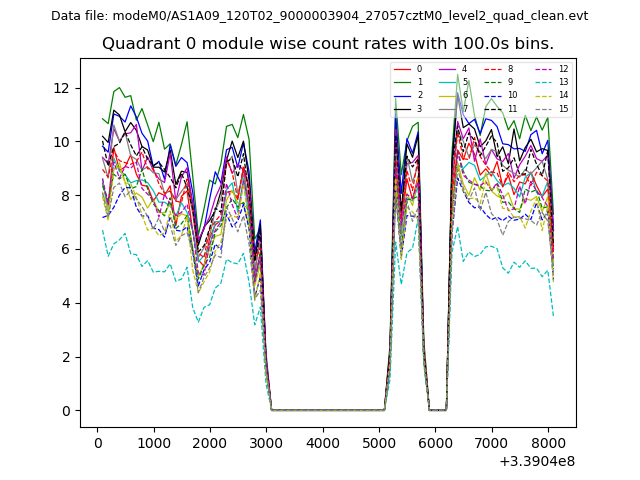
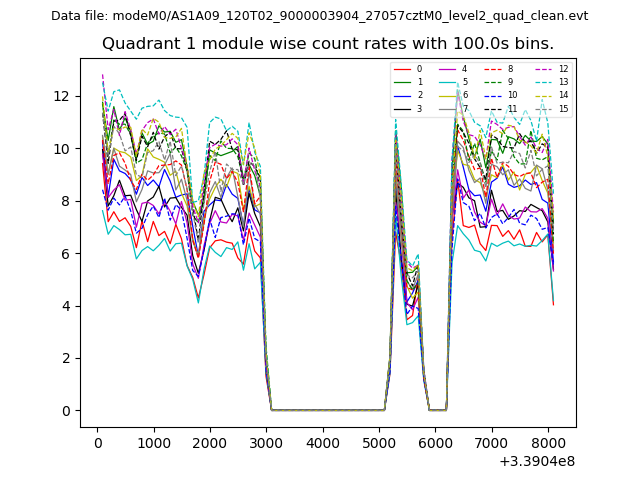
| Module-wise count rates for Quadrant A Data is divided into 100 sec bins |
 |
 |
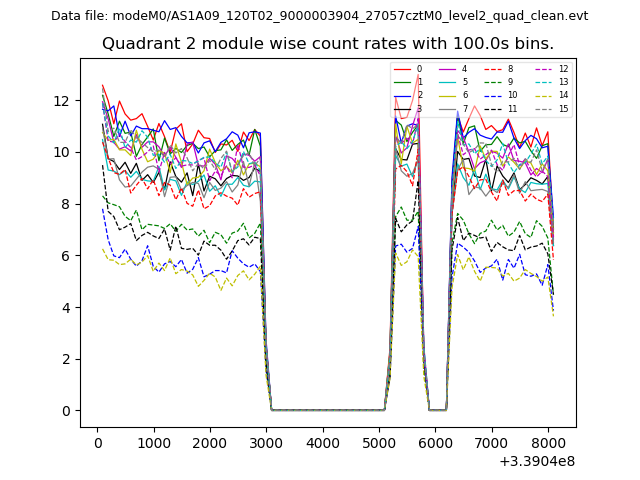
| Module-wise count rates for Quadrant B Data is divided into 100 sec bins |
 |
 |
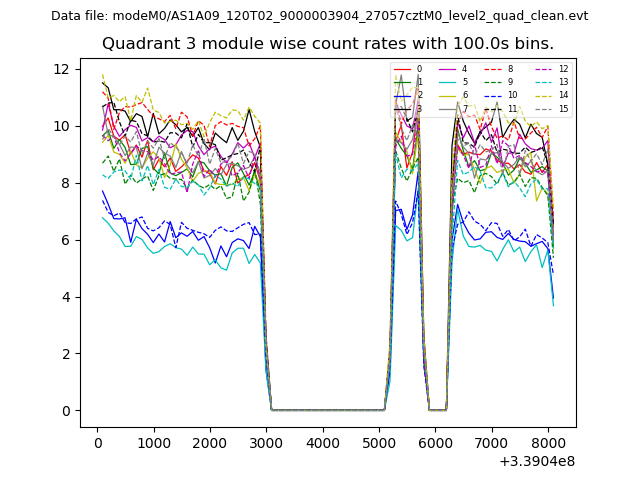
| Module-wise count rates for Quadrant C Data is divided into 100 sec bins |
 |
 |
| Module-wise count rates for Quadrant D Data is divided into 100 sec bins |
 |
 |
| Parameter | Plot |
|---|---|
| CZT HV Monitor | 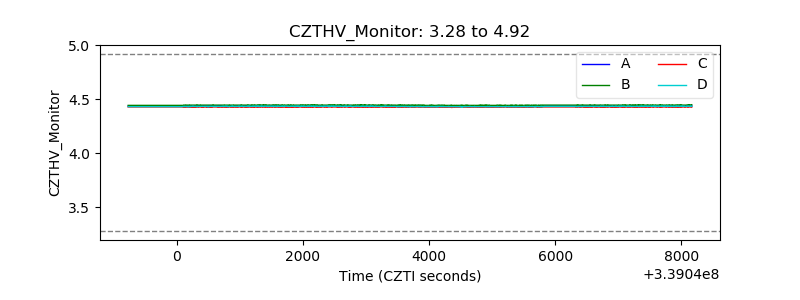 |
| D_VDD | 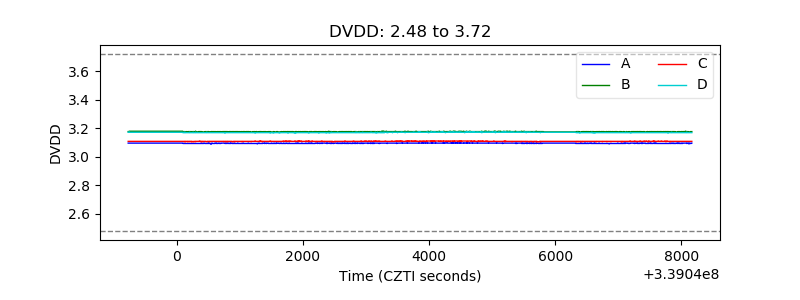 |
| Temperature 1 | 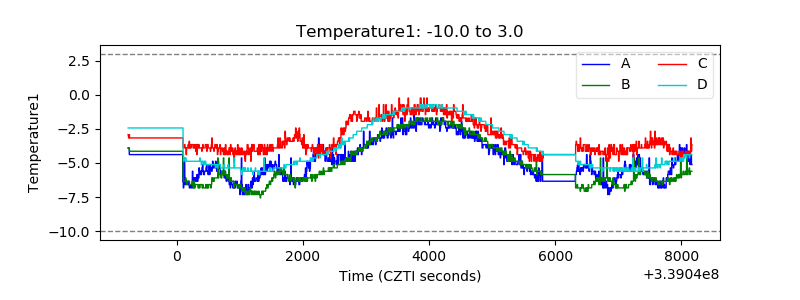 |
| Veto HV Monitor | 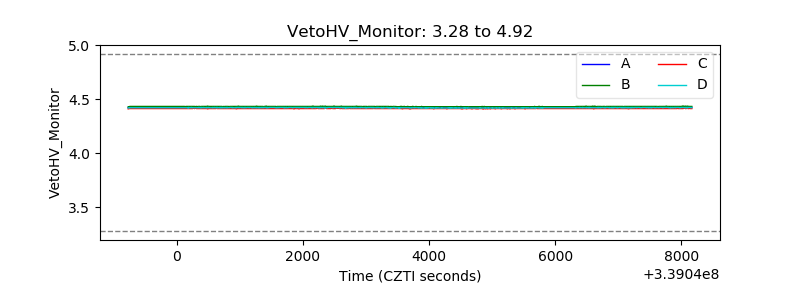 |
| Veto LLD | 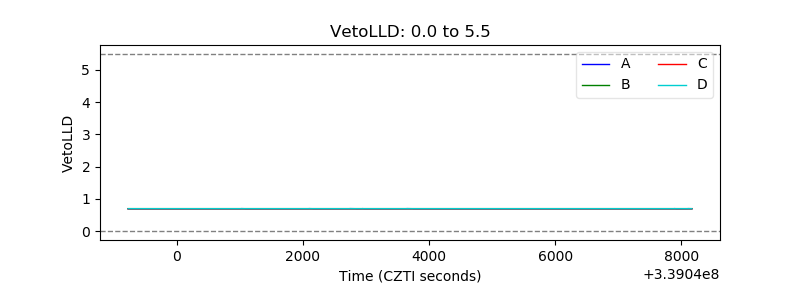 |
| Alpha Counter | 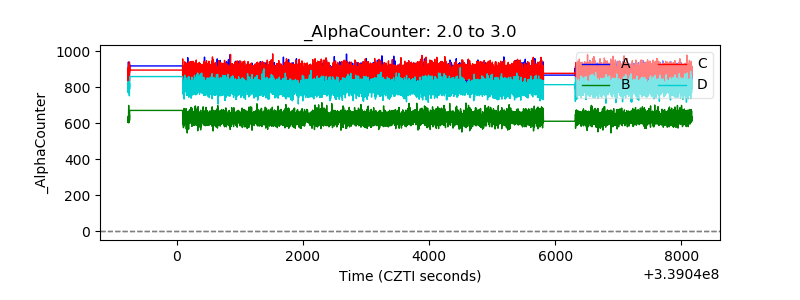 |
| _CPM_Rate | 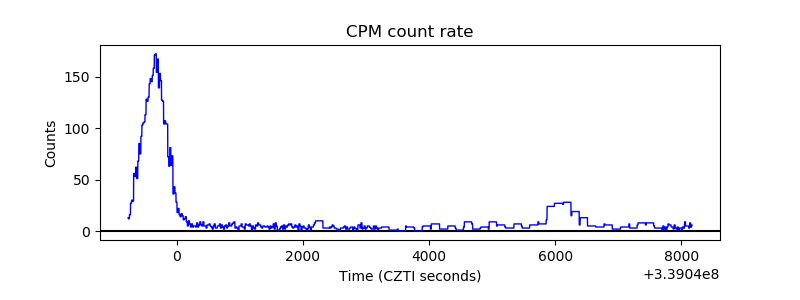 |
| CZT Counter | 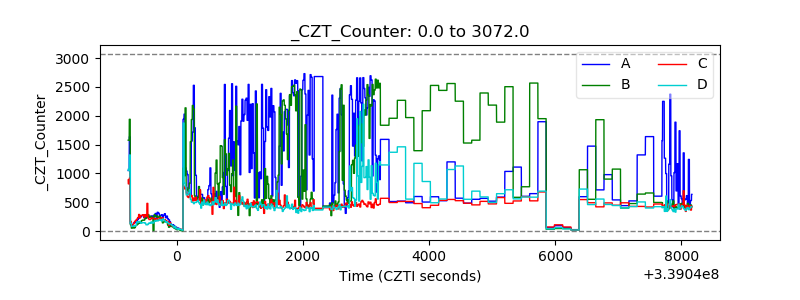 |
| +2.5 Volts monitor |  |
| +5 Volts monitor |  |
| _ROLL_ROT | 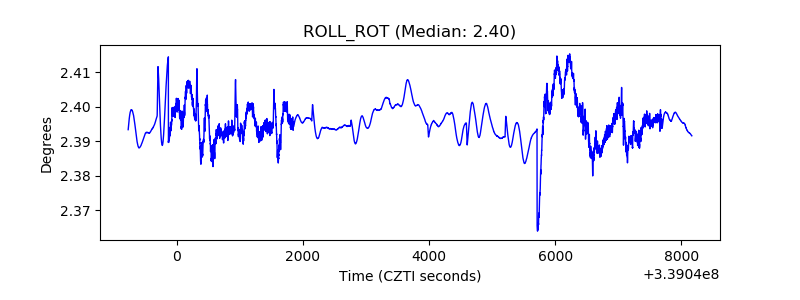 |
| _Roll_DEC | 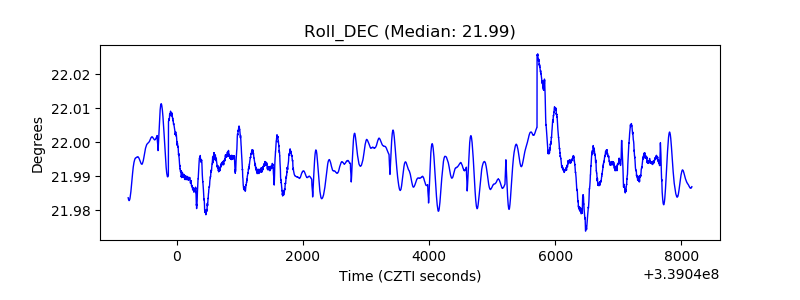 |
| _Roll_RA | 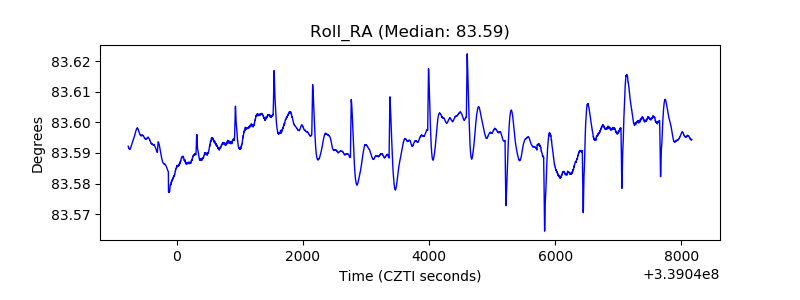 |
| Veto Counter | 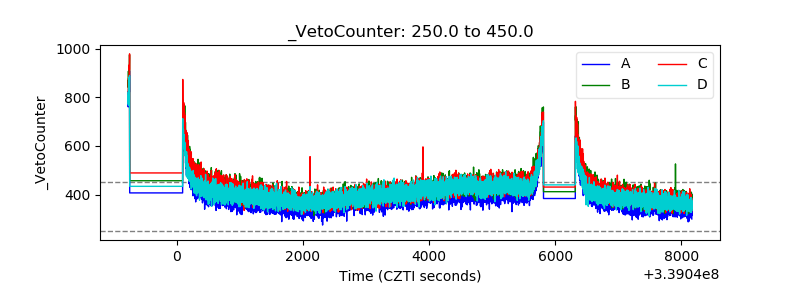 |