| Param | Original file | Final file |
|---|---|---|
| Filename | modeM0/AS1A09_120T02_9000003904_27058cztM0_level2.evt | modeM0/AS1A09_120T02_9000003904_27058cztM0_level2_quad_clean.evt |
| Size (bytes) | 667,624,320 | 93,447,360 |
| Size | 636.7 MB | 89.1 MB |
| Events in quadrant A | 5,212,476 | 567,575 |
| Events in quadrant B | 7,378,269 | 623,480 |
| Events in quadrant C | 3,229,193 | 603,657 |
| Events in quadrant D | 3,957,798 | 580,531 |
| Mode M9 | |||
|---|---|---|---|
| Quadrant | BADHDUFLAG | Total packets | Discarded packets |
| A | 0 | 2 | 0 |
| B | 0 | 2 | 0 |
| C | 0 | 2 | 0 |
| D | 0 | 2 | 0 |
| Mode M0 | |||
|---|---|---|---|
| Quadrant | BADHDUFLAG | Total packets | Discarded packets |
| A | 0 | 19643 | 0 |
| B | 0 | 26170 | 0 |
| C | 0 | 13639 | 0 |
| D | 0 | 16195 | 0 |
| Quadrant | Total seconds | Saturated seconds | Saturation percentage |
|---|---|---|---|
| A | 6509 | 709 | 10.892610% |
| B | 6522 | 2060 | 31.585403% |
| C | 6516 | 188 | 2.885206% |
| D | 6527 | 257 | 3.937490% |
Noise dominated data is calculated using 1-second bins in cleaned event files. If a bin has >2000 counts, and if more than 50% of those come from <1% of pixels, then it is considered to be noise-dominated and hence unusable.
| Quadrant | # 1 sec bins | Bins with >0 counts | Bins with >2000 counts | High rate bins dominated by noise | Noise dominated (total time) | Noise dominated (detector-on time) | Marked lightcurve |
|---|---|---|---|---|---|---|---|
| A | 6663 | 6529 | 471 | 471 | 7.07% | 7.21% | 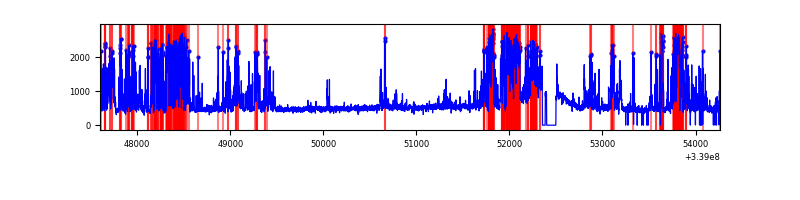 |
| B | 6664 | 6532 | 1777 | 1777 | 26.67% | 27.20% | 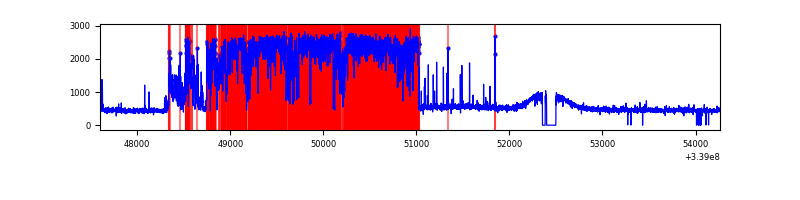 |
| C | 6664 | 6532 | 0 | 0 | 0.00% | 0.00% |  |
| D | 6664 | 6535 | 131 | 131 | 1.97% | 2.00% | 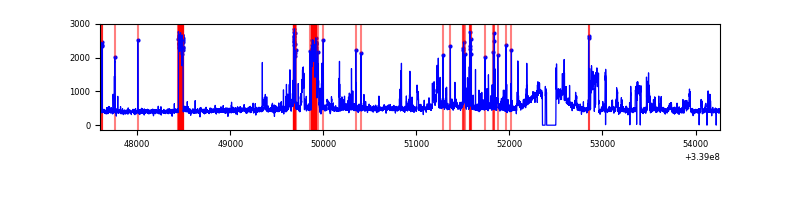 |
Top three noisy pixels from each quadrant. If the there are fewer than three noisy pixels in the level2.evt file, extra rows are filled as -1
| Pixel properties | Quadrant properties | ||||||
|---|---|---|---|---|---|---|---|
| Quadrant | DetID | PixID | Counts | Sigma | Mean | Median | Sigma |
| A | 14 | 235 | 2158989 | 13601.15 | 789 | 773 | 158.7 |
| A | 13 | 254 | 10970 | 64.26 | 789 | 773 | 158.7 |
| A | 6 | 16 | 10306 | 60.07 | 789 | 773 | 158.7 |
| B | 0 | 189 | 4392520 | 30514.92 | 736 | 719 | 143.9 |
| B | 10 | 246 | 95113 | 655.86 | 736 | 719 | 143.9 |
| B | 12 | 111 | 17429 | 116.1 | 736 | 719 | 143.9 |
| C | 14 | 238 | 126100 | 667.71 | 792 | 799 | 187.7 |
| C | 3 | 9 | 10039 | 49.24 | 792 | 799 | 187.7 |
| C | 13 | 61 | 5455 | 24.81 | 792 | 799 | 187.7 |
| D | 1 | 52 | 728423 | 3776.13 | 798 | 777 | 192.7 |
| D | 2 | 250 | 185751 | 959.93 | 798 | 777 | 192.7 |
| D | 2 | 234 | 30623 | 154.89 | 798 | 777 | 192.7 |
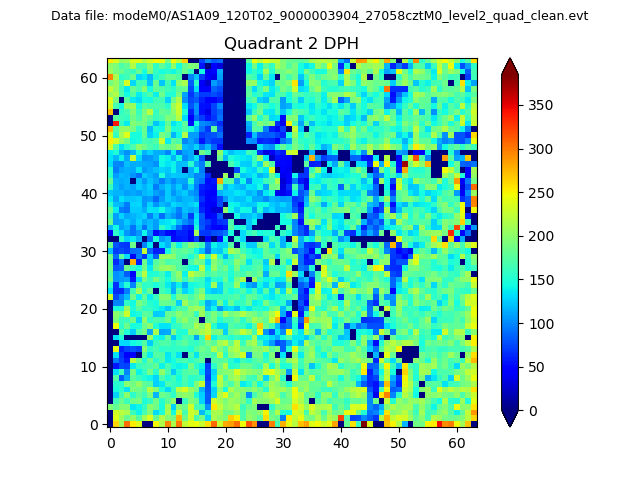
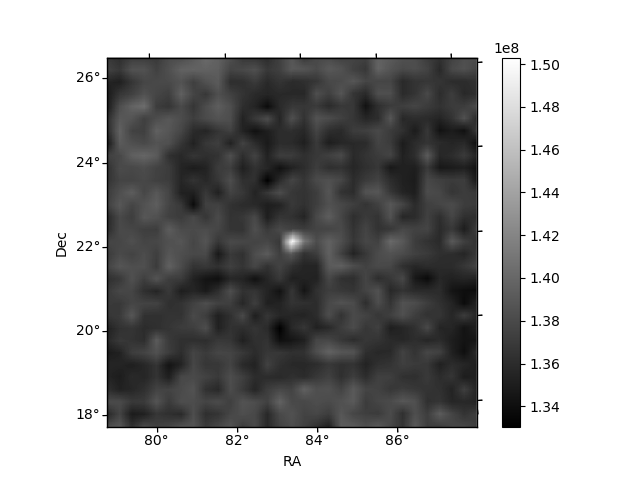
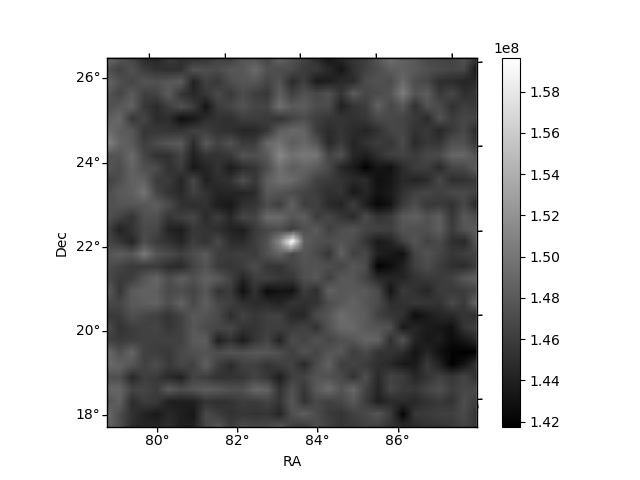
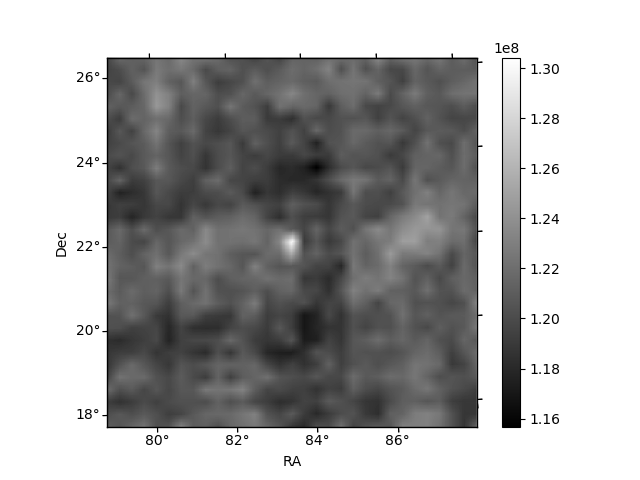
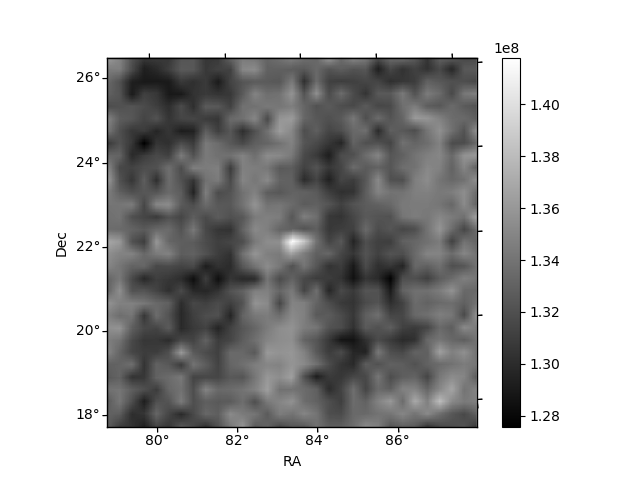
Histogram calculated using DETX and DETY for each event in the final _common_clean file
| Quadrant A | 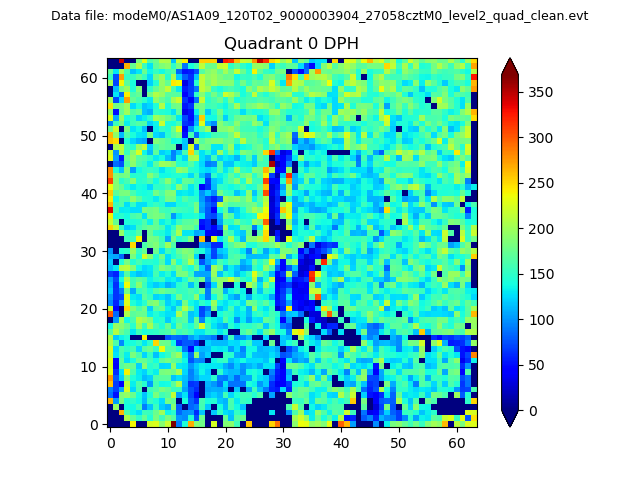 |
 |
Quadrant B |
|---|---|---|---|
| Quadrant D |  |
 |
Quadrant C |
| Plot type | Count rate plots | Images |
|---|---|---|
| Comparison with Poisson distribution Blue bars denote a histogram of data divided into 1 sec bins. Red curve is a Poisson curve with rate = median count rate of data. |
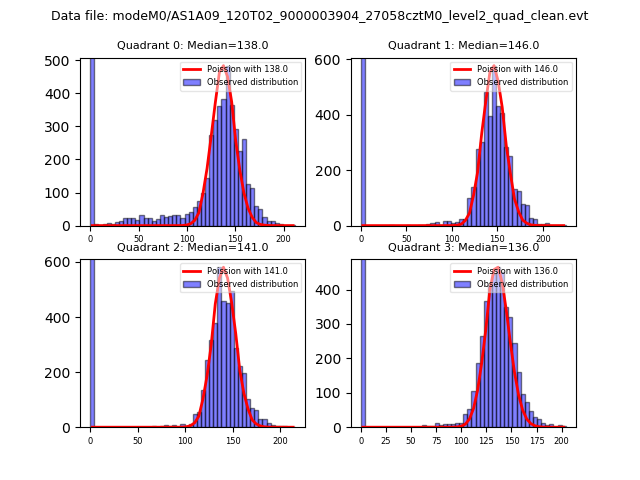 |
 |
| Quadrant-wise count rates Data is divided into 100 sec bins |
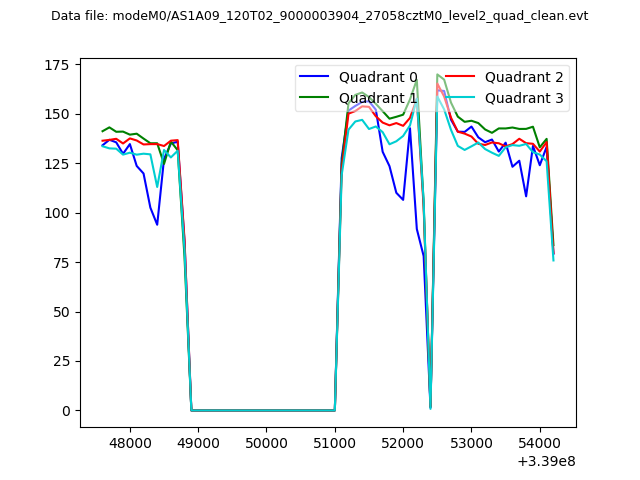 |
|
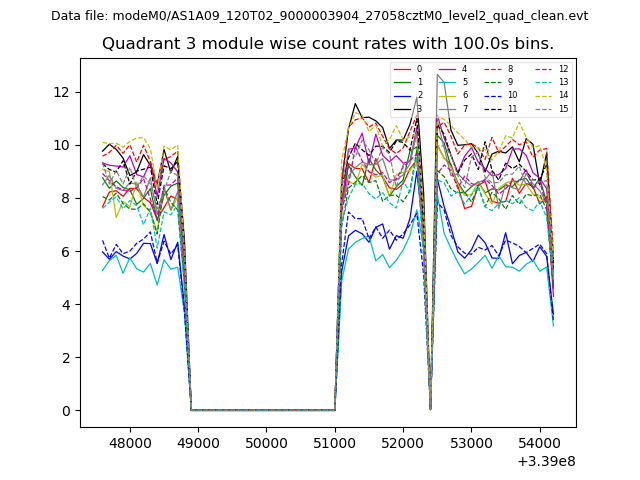
| Module-wise count rates for Quadrant A Data is divided into 100 sec bins |
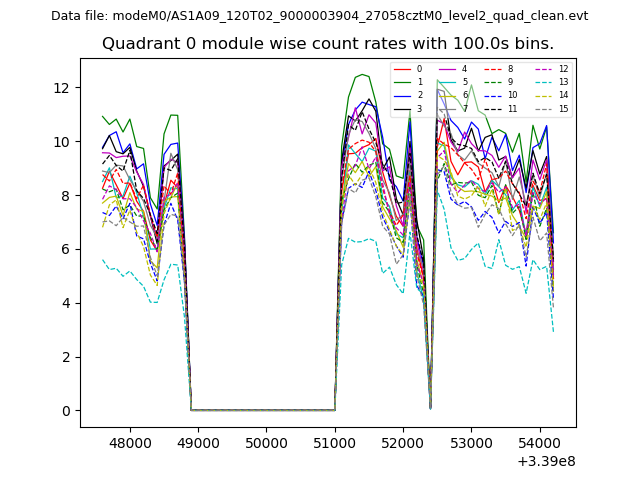 |
 |
| Module-wise count rates for Quadrant B Data is divided into 100 sec bins |
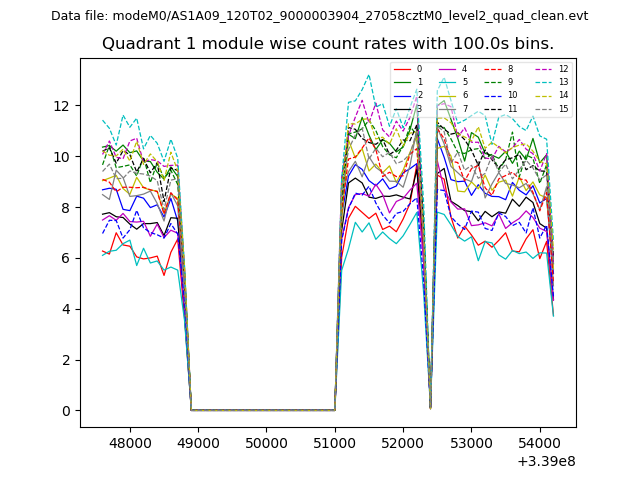 |
 |
| Module-wise count rates for Quadrant C Data is divided into 100 sec bins |
 |
 |
| Module-wise count rates for Quadrant D Data is divided into 100 sec bins |
 |
 |
| Parameter | Plot |
|---|---|
| CZT HV Monitor | 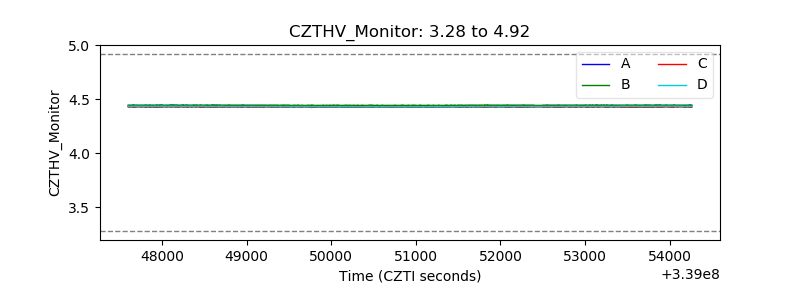 |
| D_VDD | 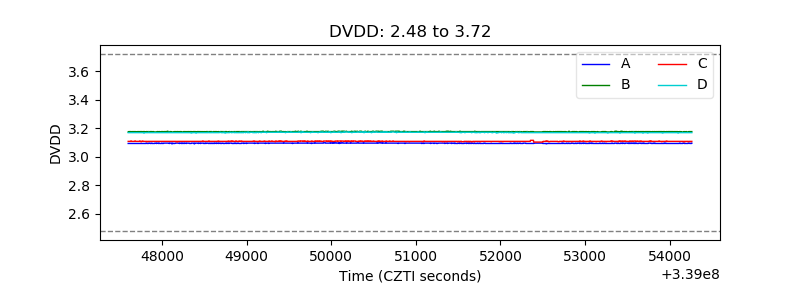 |
| Temperature 1 | 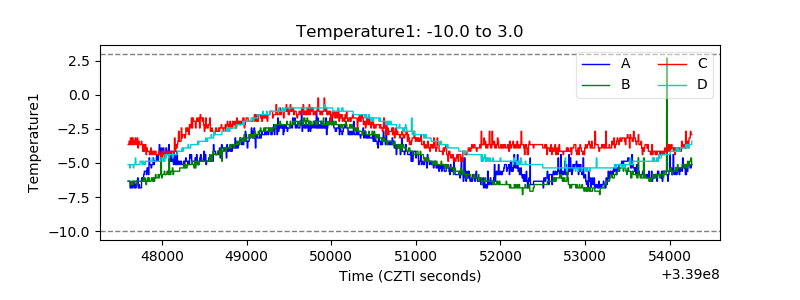 |
| Veto HV Monitor | 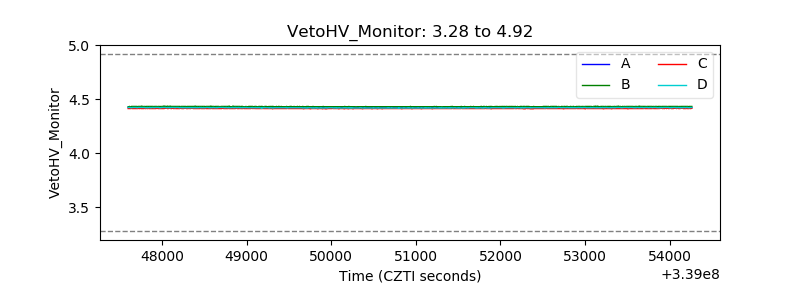 |
| Veto LLD | 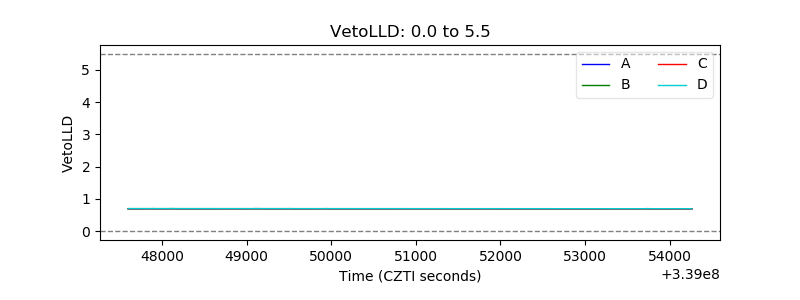 |
| Alpha Counter | 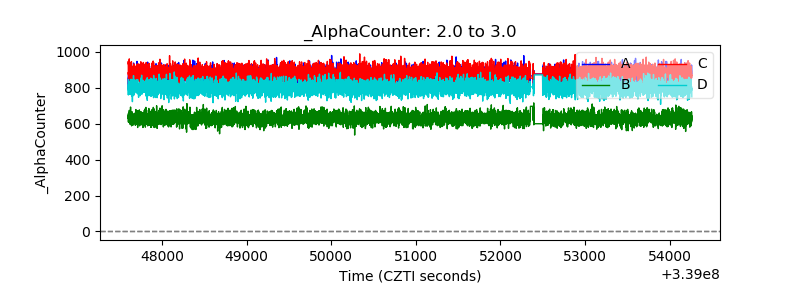 |
| _CPM_Rate | 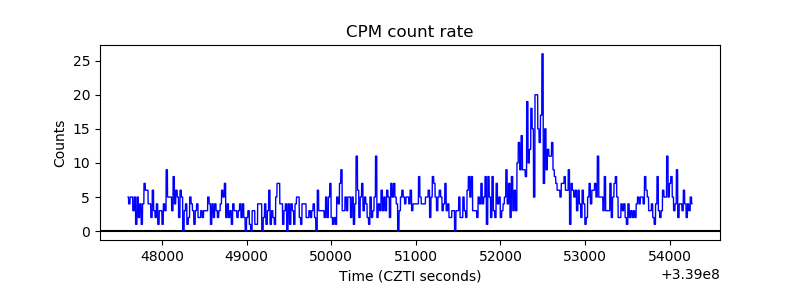 |
| CZT Counter | 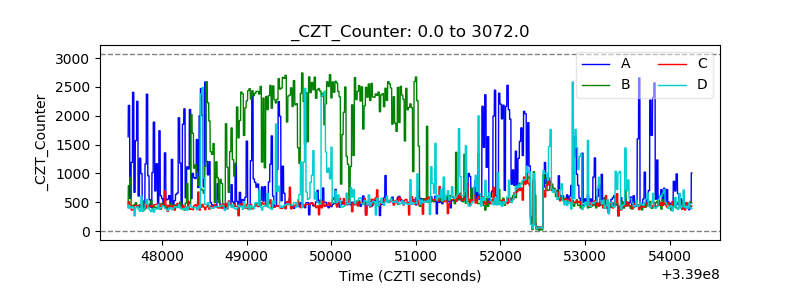 |
| +2.5 Volts monitor |  |
| +5 Volts monitor | 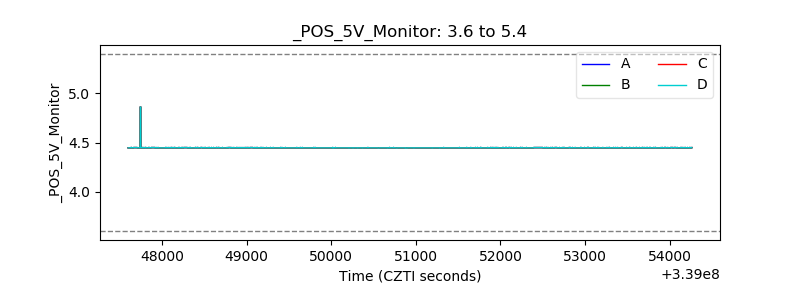 |
| _ROLL_ROT | 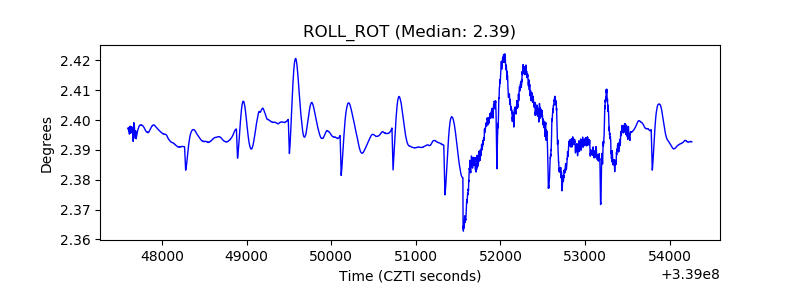 |
| _Roll_DEC | 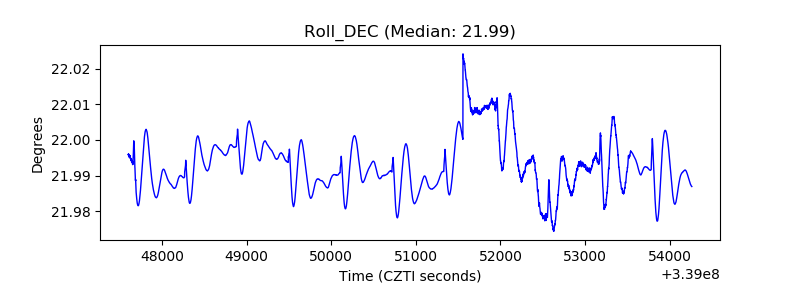 |
| _Roll_RA | 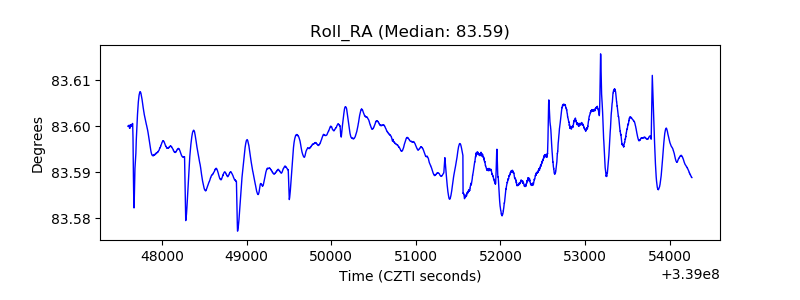 |
| Veto Counter |  |