| Param | Original file | Final file |
|---|---|---|
| Filename | modeM0/AS1A09_120T02_9000003904_27059cztM0_level2.evt | modeM0/AS1A09_120T02_9000003904_27059cztM0_level2_quad_clean.evt |
| Size (bytes) | 700,580,160 | 90,679,680 |
| Size | 668.1 MB | 86.5 MB |
| Events in quadrant A | 8,471,560 | 485,801 |
| Events in quadrant B | 5,321,105 | 599,717 |
| Events in quadrant C | 3,231,358 | 610,102 |
| Events in quadrant D | 3,746,960 | 589,313 |
| Mode M9 | |||
|---|---|---|---|
| Quadrant | BADHDUFLAG | Total packets | Discarded packets |
| A | 0 | 4 | 0 |
| B | 0 | 4 | 0 |
| C | 0 | 4 | 0 |
| D | 0 | 4 | 0 |
| Mode M0 | |||
|---|---|---|---|
| Quadrant | BADHDUFLAG | Total packets | Discarded packets |
| A | 0 | 29667 | 0 |
| B | 0 | 20136 | 0 |
| C | 0 | 13643 | 0 |
| D | 0 | 15491 | 0 |
| Quadrant | Total seconds | Saturated seconds | Saturation percentage |
|---|---|---|---|
| A | 6605 | 2055 | 31.112793% |
| B | 6605 | 772 | 11.688115% |
| C | 6605 | 101 | 1.529145% |
| D | 6605 | 88 | 1.332324% |
Noise dominated data is calculated using 1-second bins in cleaned event files. If a bin has >2000 counts, and if more than 50% of those come from <1% of pixels, then it is considered to be noise-dominated and hence unusable.
| Quadrant | # 1 sec bins | Bins with >0 counts | Bins with >2000 counts | High rate bins dominated by noise | Noise dominated (total time) | Noise dominated (detector-on time) | Marked lightcurve |
|---|---|---|---|---|---|---|---|
| A | 6925 | 6606 | 1811 | 1811 | 26.15% | 27.41% | 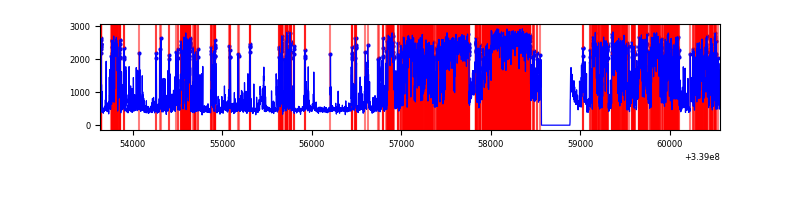 |
| B | 6925 | 6606 | 535 | 535 | 7.73% | 8.10% | 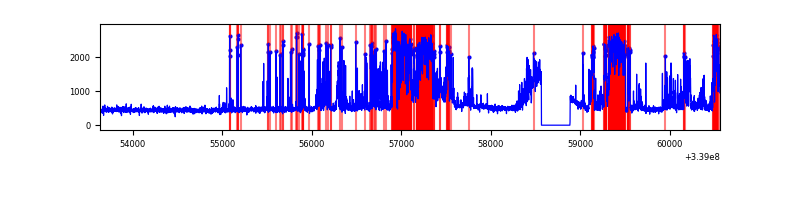 |
| C | 6925 | 6606 | 3 | 3 | 0.04% | 0.05% | 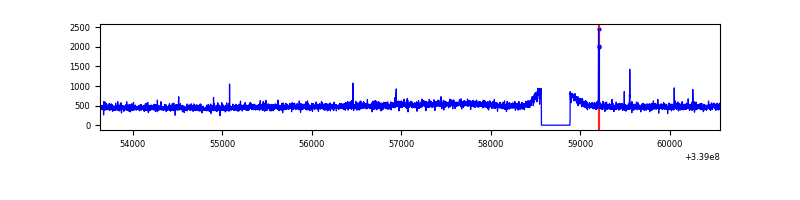 |
| D | 6925 | 6606 | 36 | 36 | 0.52% | 0.54% | 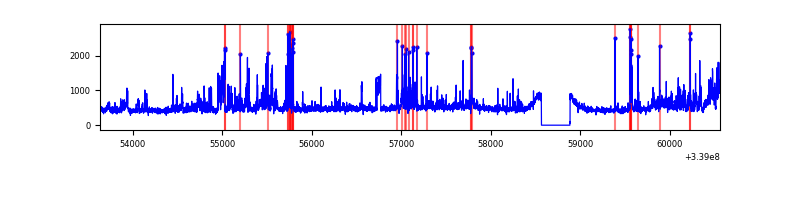 |
Top three noisy pixels from each quadrant. If the there are fewer than three noisy pixels in the level2.evt file, extra rows are filled as -1
| Pixel properties | Quadrant properties | ||||||
|---|---|---|---|---|---|---|---|
| Quadrant | DetID | PixID | Counts | Sigma | Mean | Median | Sigma |
| A | 14 | 235 | 5703890 | 39952.36 | 708 | 695 | 142.7 |
| A | 6 | 16 | 34639 | 237.79 | 708 | 695 | 142.7 |
| A | 13 | 254 | 9304 | 60.31 | 708 | 695 | 142.7 |
| B | 0 | 189 | 1840575 | 12113.14 | 781 | 762 | 151.9 |
| B | 10 | 246 | 389794 | 2561.35 | 781 | 762 | 151.9 |
| B | 12 | 111 | 18328 | 115.65 | 781 | 762 | 151.9 |
| C | 14 | 238 | 125882 | 675.51 | 785 | 791 | 185.2 |
| C | 15 | 208 | 24290 | 126.9 | 785 | 791 | 185.2 |
| C | 3 | 233 | 16410 | 84.34 | 785 | 791 | 185.2 |
| D | 1 | 52 | 565405 | 2938.27 | 790 | 767 | 192.2 |
| D | 2 | 250 | 98680 | 509.52 | 790 | 767 | 192.2 |
| D | 12 | 233 | 82431 | 424.96 | 790 | 767 | 192.2 |
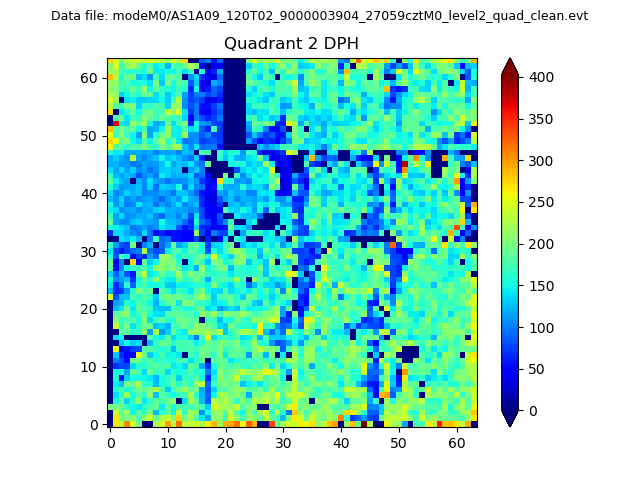
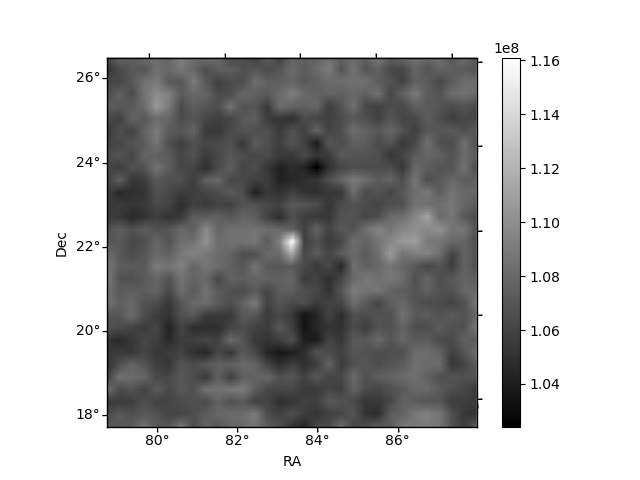
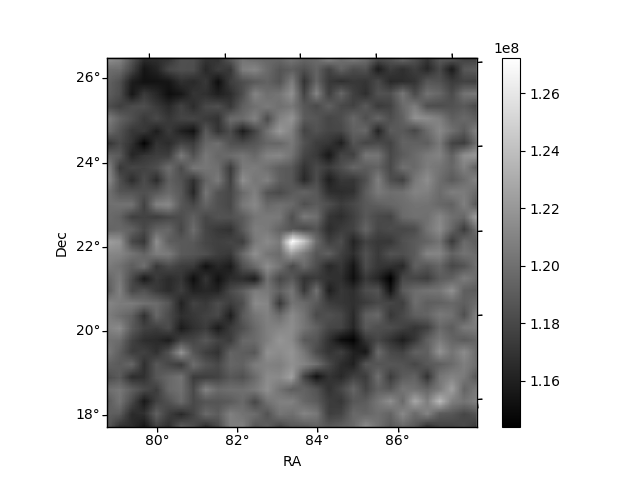
Histogram calculated using DETX and DETY for each event in the final _common_clean file
| Quadrant A | 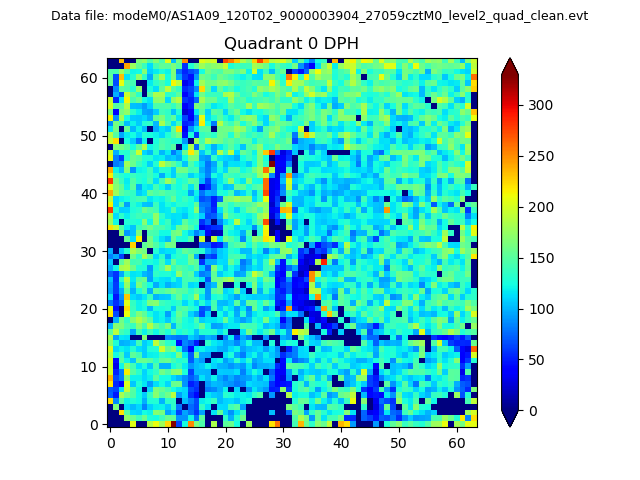 |
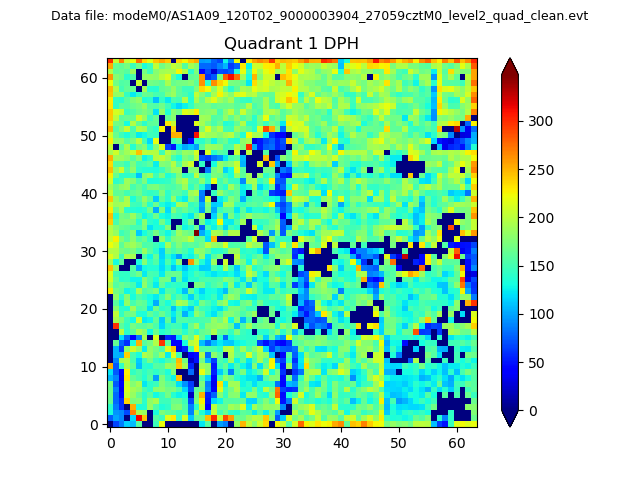 |
Quadrant B |
|---|---|---|---|
| Quadrant D | 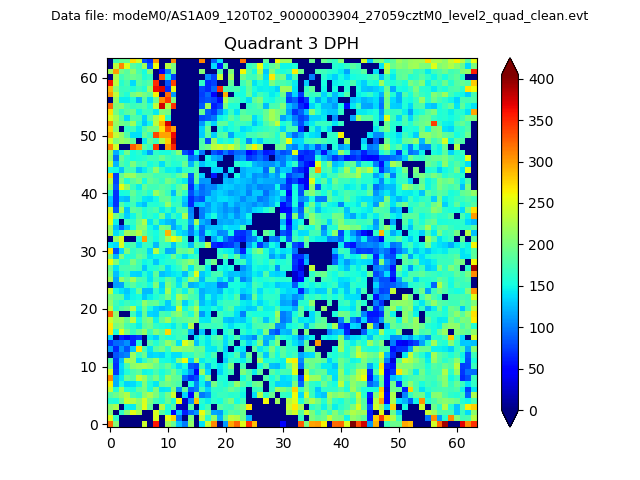 |
 |
Quadrant C |
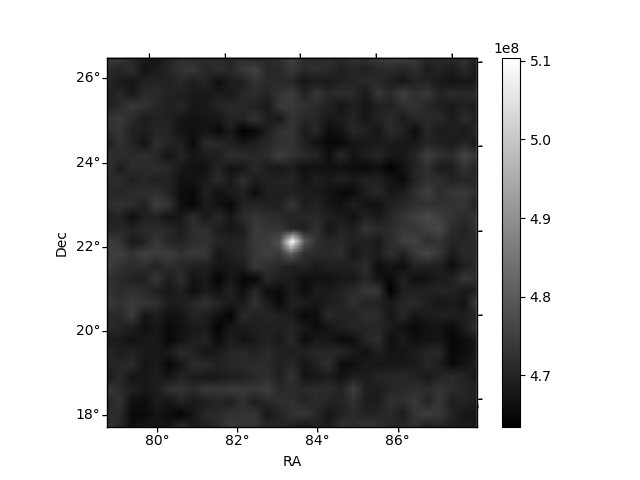
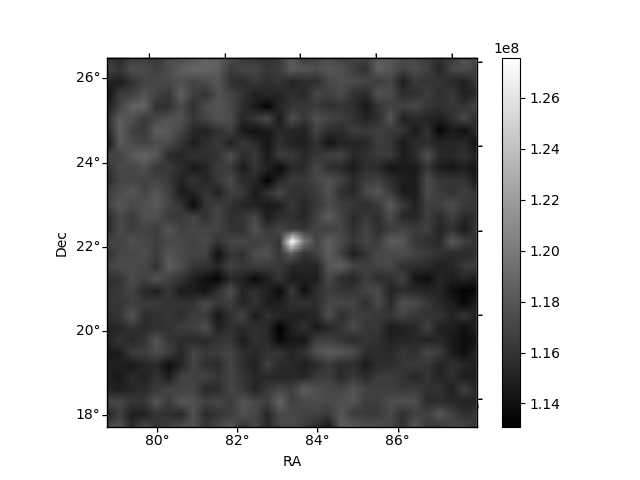
| Plot type | Count rate plots | Images |
|---|---|---|
| Comparison with Poisson distribution Blue bars denote a histogram of data divided into 1 sec bins. Red curve is a Poisson curve with rate = median count rate of data. |
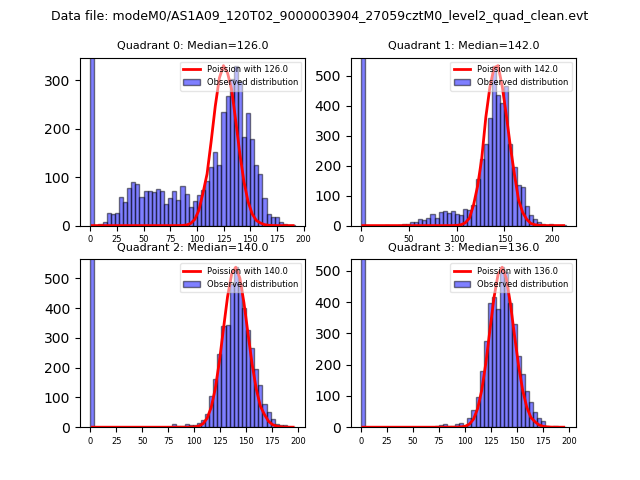 |
 |
| Quadrant-wise count rates Data is divided into 100 sec bins |
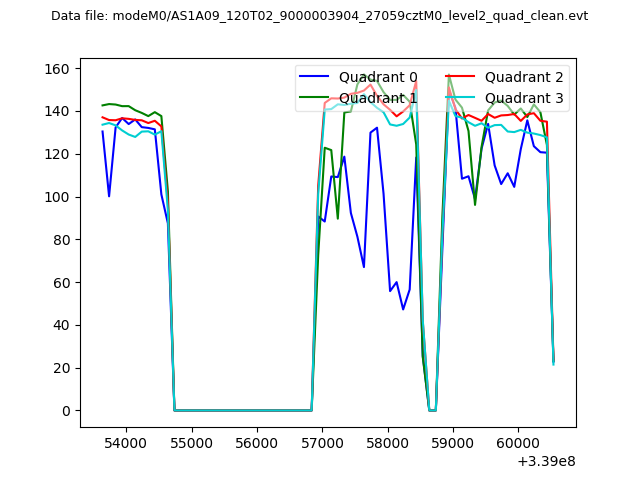 |
|
| Module-wise count rates for Quadrant A Data is divided into 100 sec bins |
 |
 |
| Module-wise count rates for Quadrant B Data is divided into 100 sec bins |
 |
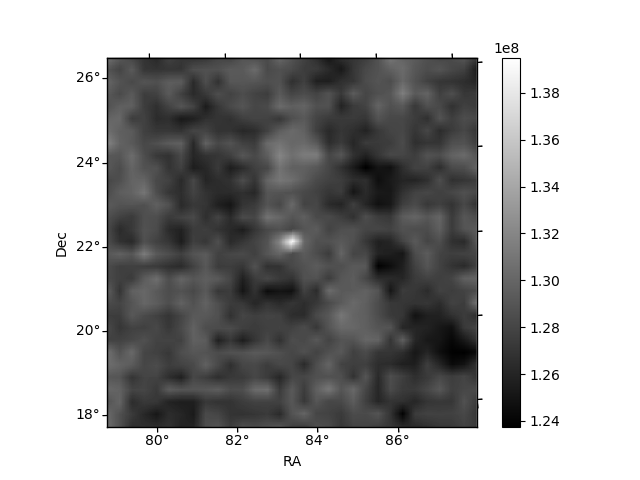 |
| Module-wise count rates for Quadrant C Data is divided into 100 sec bins |
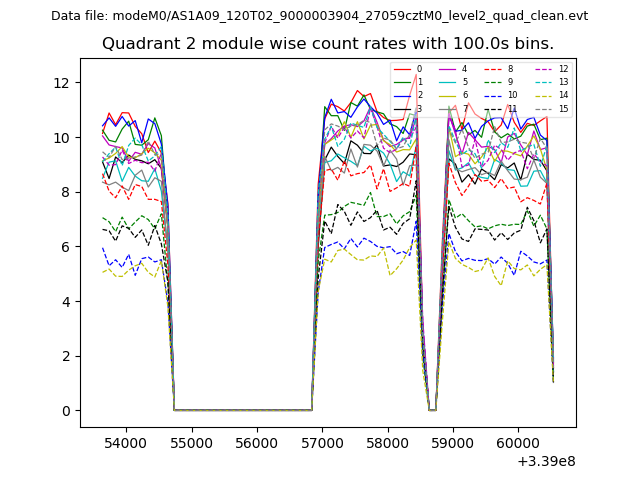 |
 |
| Module-wise count rates for Quadrant D Data is divided into 100 sec bins |
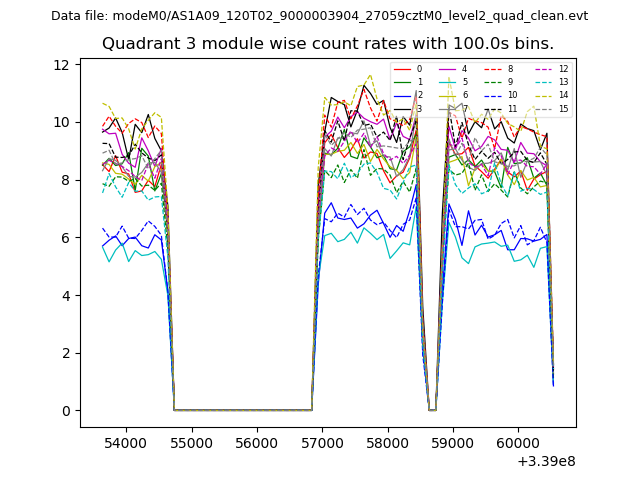 |
 |
| Parameter | Plot |
|---|---|
| CZT HV Monitor | 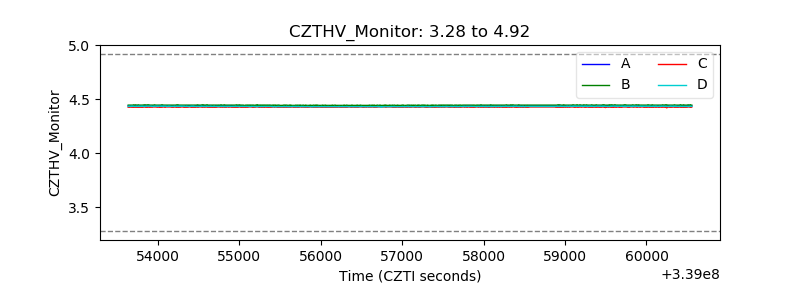 |
| D_VDD | 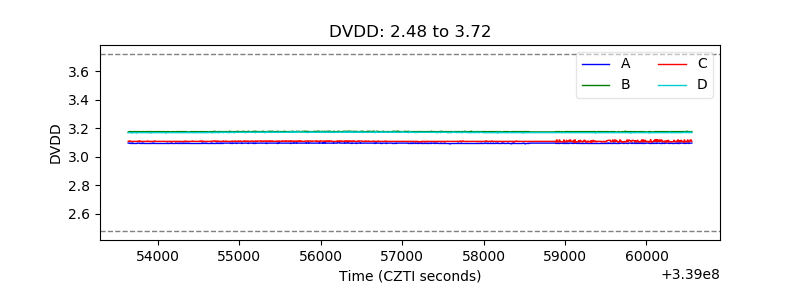 |
| Temperature 1 |  |
| Veto HV Monitor | 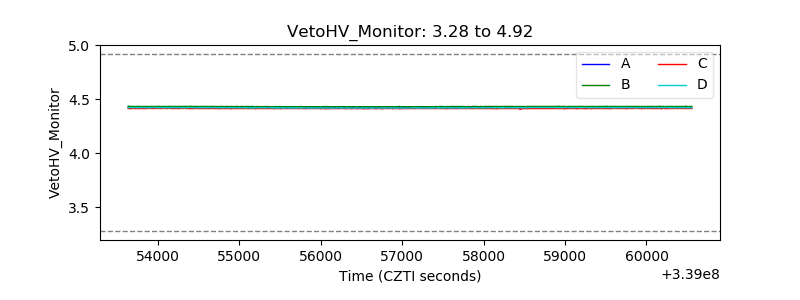 |
| Veto LLD | 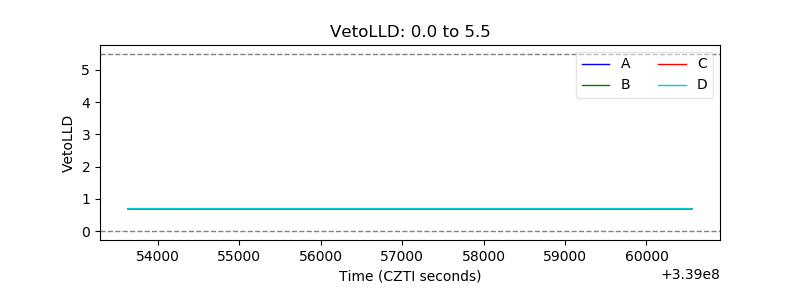 |
| Alpha Counter | 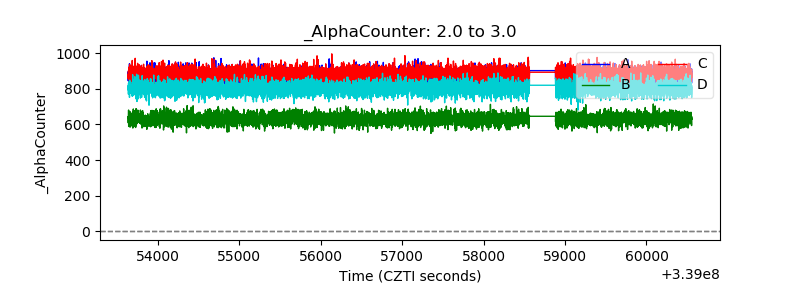 |
| _CPM_Rate | 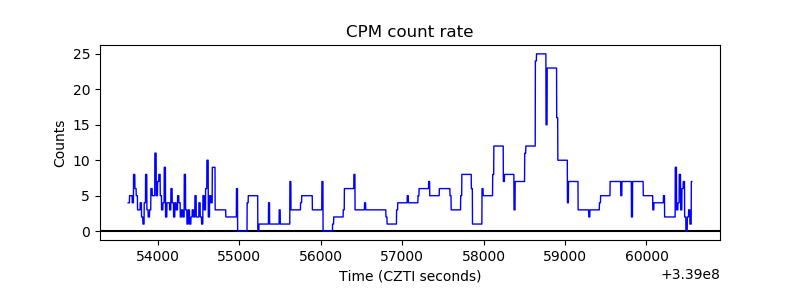 |
| CZT Counter | 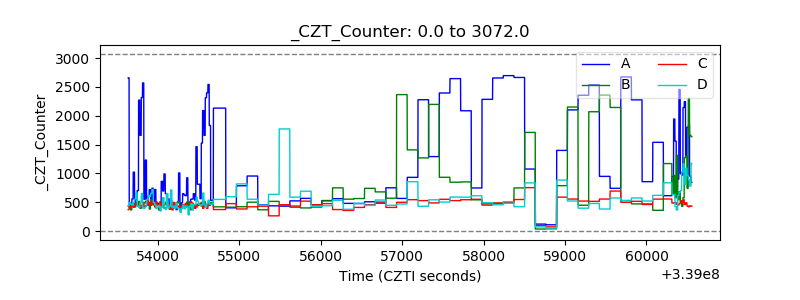 |
| +2.5 Volts monitor |  |
| +5 Volts monitor | 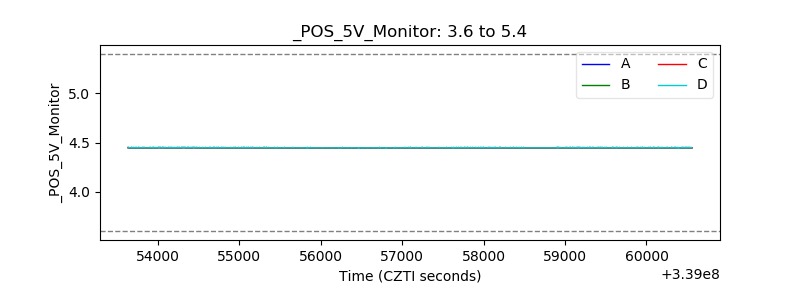 |
| _ROLL_ROT | 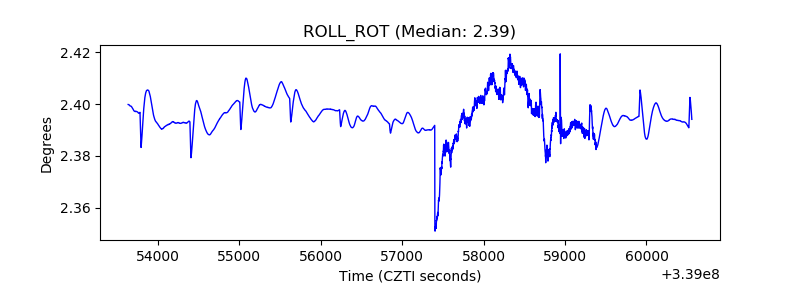 |
| _Roll_DEC | 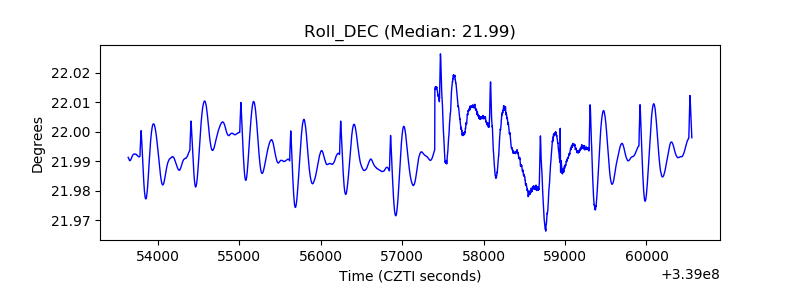 |
| _Roll_RA | 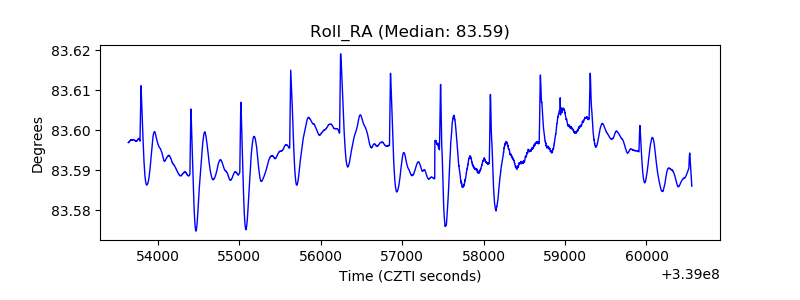 |
| Veto Counter |  |