| Param | Original file | Final file |
|---|---|---|
| Filename | modeM0/AS1A09_120T02_9000003904_27062cztM0_level2.evt | modeM0/AS1A09_120T02_9000003904_27062cztM0_level2_quad_clean.evt |
| Size (bytes) | 2,160,722,880 | 208,252,800 |
| Size | 2.0 GB | 198.6 MB |
| Events in quadrant A | 18,630,728 | 1,167,686 |
| Events in quadrant B | 15,113,801 | 1,390,275 |
| Events in quadrant C | 8,841,618 | 1,347,254 |
| Events in quadrant D | 21,674,719 | 1,192,033 |
| Mode M9 | |||
|---|---|---|---|
| Quadrant | BADHDUFLAG | Total packets | Discarded packets |
| A | 0 | 20 | 0 |
| B | 0 | 20 | 0 |
| C | 0 | 20 | 0 |
| D | 0 | 20 | 0 |
| Mode M0 | |||
|---|---|---|---|
| Quadrant | BADHDUFLAG | Total packets | Discarded packets |
| A | 0 | 66942 | 0 |
| B | 0 | 55737 | 0 |
| C | 0 | 36657 | 0 |
| D | 0 | 76145 | 0 |
| Quadrant | Total seconds | Saturated seconds | Saturation percentage |
|---|---|---|---|
| A | 17521 | 3775 | 21.545574% |
| B | 17521 | 2403 | 13.714971% |
| C | 17521 | 249 | 1.421152% |
| D | 17521 | 4972 | 28.377376% |
Noise dominated data is calculated using 1-second bins in cleaned event files. If a bin has >2000 counts, and if more than 50% of those come from <1% of pixels, then it is considered to be noise-dominated and hence unusable.
| Quadrant | # 1 sec bins | Bins with >0 counts | Bins with >2000 counts | High rate bins dominated by noise | Noise dominated (total time) | Noise dominated (detector-on time) | Marked lightcurve |
|---|---|---|---|---|---|---|---|
| A | 19586 | 17524 | 3260 | 3260 | 16.64% | 18.60% | 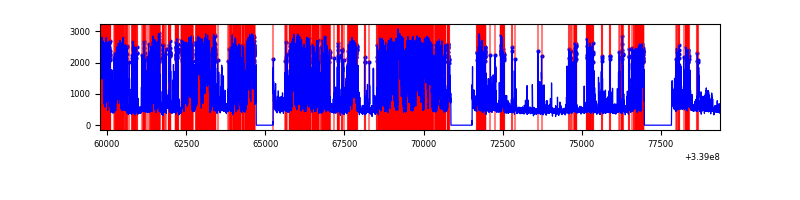 |
| B | 19586 | 17524 | 1911 | 1911 | 9.76% | 10.91% | 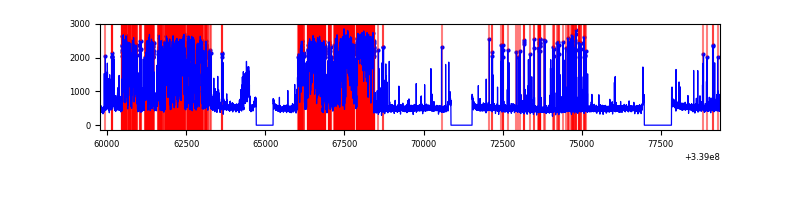 |
| C | 19586 | 17524 | 21 | 21 | 0.11% | 0.12% | 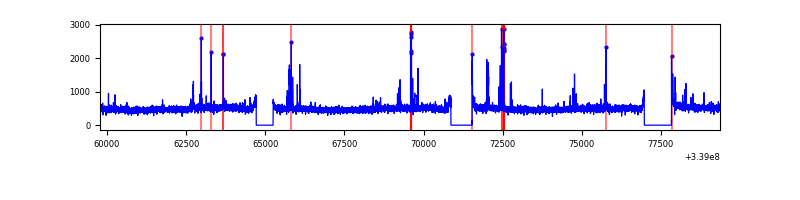 |
| D | 19586 | 17524 | 4639 | 4639 | 23.69% | 26.47% | 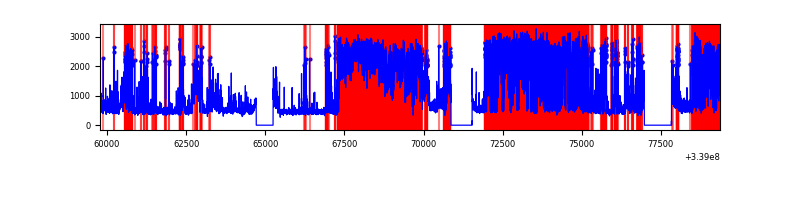 |
Top three noisy pixels from each quadrant. If the there are fewer than three noisy pixels in the level2.evt file, extra rows are filled as -1
| Pixel properties | Quadrant properties | ||||||
|---|---|---|---|---|---|---|---|
| Quadrant | DetID | PixID | Counts | Sigma | Mean | Median | Sigma |
| A | 14 | 235 | 10860633 | 27250.4 | 1986 | 1951 | 398.5 |
| A | 9 | 130 | 70558 | 172.17 | 1986 | 1951 | 398.5 |
| A | 6 | 16 | 40114 | 95.77 | 1986 | 1951 | 398.5 |
| B | 0 | 189 | 6719120 | 16755.34 | 2093 | 2042 | 400.9 |
| B | 10 | 246 | 93459 | 228.03 | 2093 | 2042 | 400.9 |
| B | 12 | 111 | 48654 | 116.27 | 2093 | 2042 | 400.9 |
| C | 14 | 238 | 335612 | 673.56 | 2097 | 2113 | 495.1 |
| C | 15 | 208 | 294823 | 591.18 | 2097 | 2113 | 495.1 |
| C | 4 | 224 | 28616 | 53.53 | 2097 | 2113 | 495.1 |
| D | 1 | 52 | 13027425 | 29566.26 | 1829 | 1785 | 440.6 |
| D | 12 | 233 | 1183298 | 2681.86 | 1829 | 1785 | 440.6 |
| D | 2 | 250 | 480855 | 1087.42 | 1829 | 1785 | 440.6 |
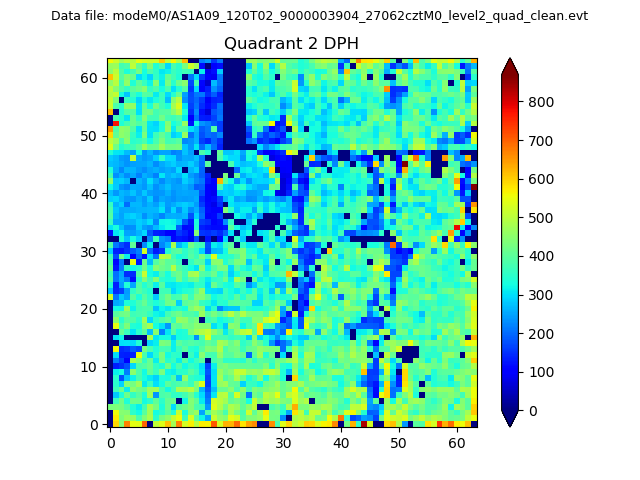
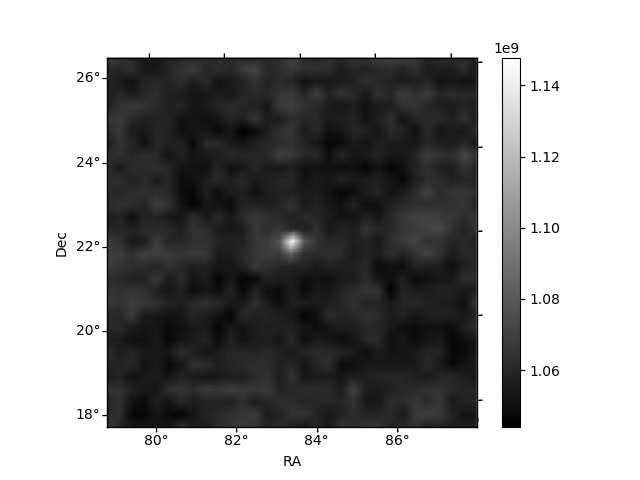
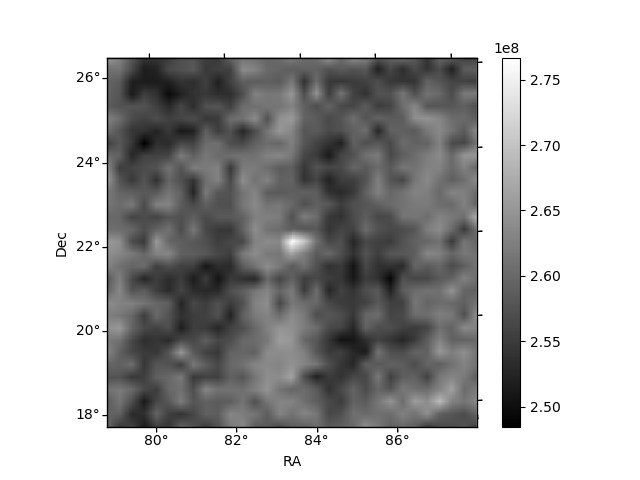
Histogram calculated using DETX and DETY for each event in the final _common_clean file
| Quadrant A | 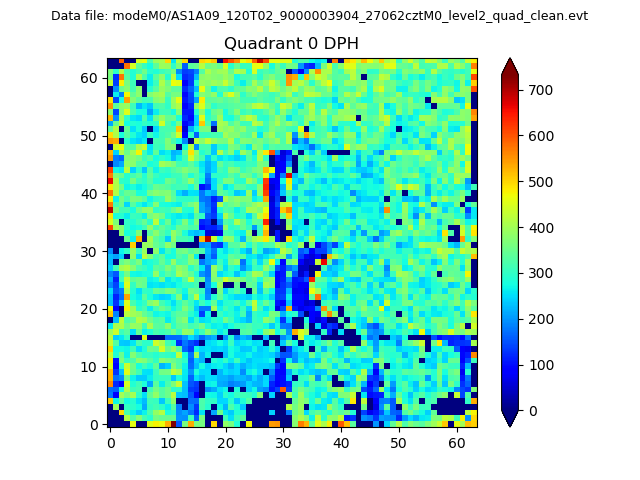 |
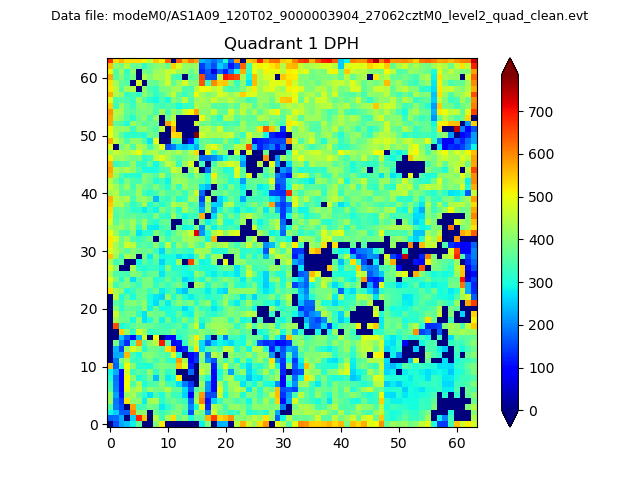 |
Quadrant B |
|---|---|---|---|
| Quadrant D | 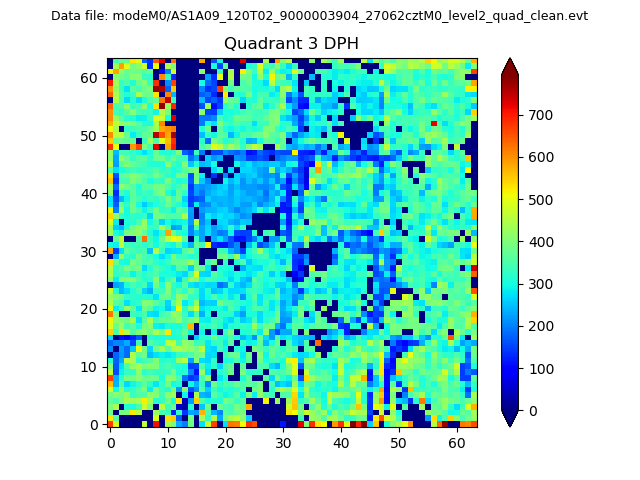 |
 |
Quadrant C |
| Plot type | Count rate plots | Images |
|---|---|---|
| Comparison with Poisson distribution Blue bars denote a histogram of data divided into 1 sec bins. Red curve is a Poisson curve with rate = median count rate of data. |
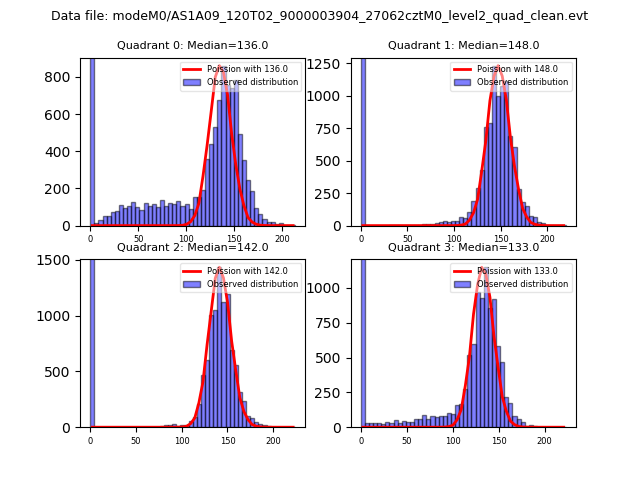 |
 |
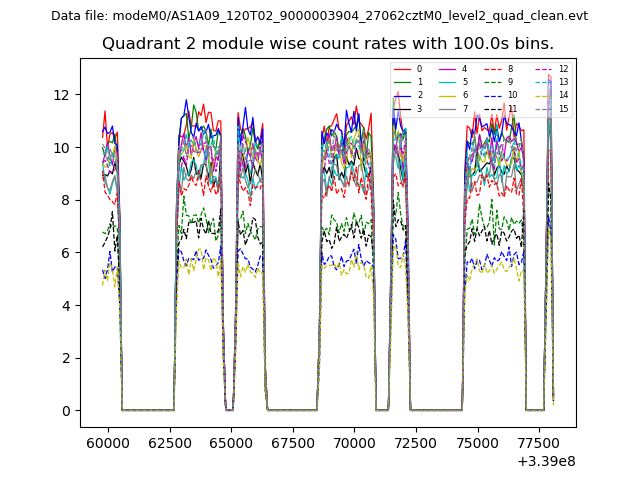
| Quadrant-wise count rates Data is divided into 100 sec bins |
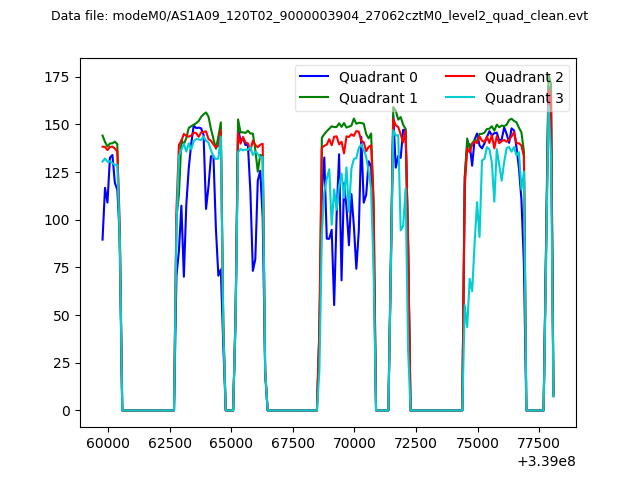 |
|
| Module-wise count rates for Quadrant A Data is divided into 100 sec bins |
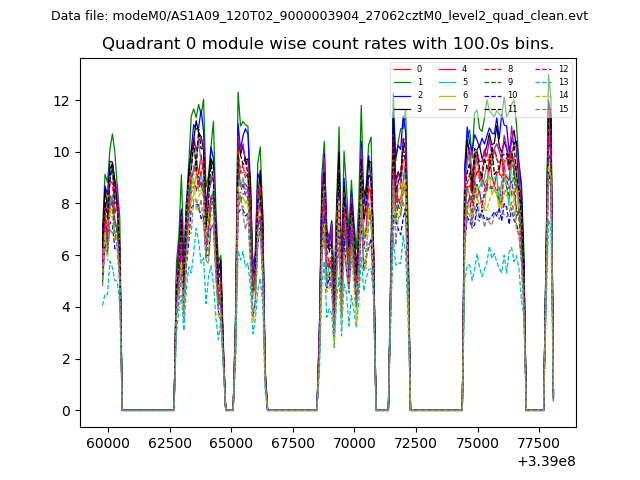 |
 |
| Module-wise count rates for Quadrant B Data is divided into 100 sec bins |
 |
 |
| Module-wise count rates for Quadrant C Data is divided into 100 sec bins |
 |
 |
| Module-wise count rates for Quadrant D Data is divided into 100 sec bins |
 |
 |
| Parameter | Plot |
|---|---|
| CZT HV Monitor | 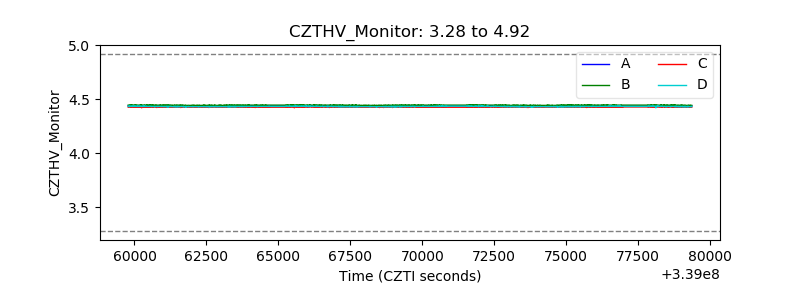 |
| D_VDD | 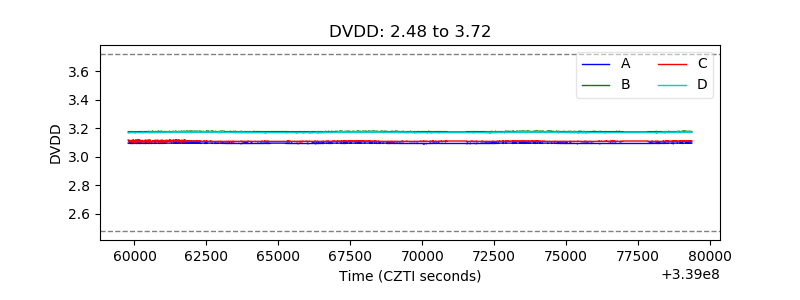 |
| Temperature 1 | 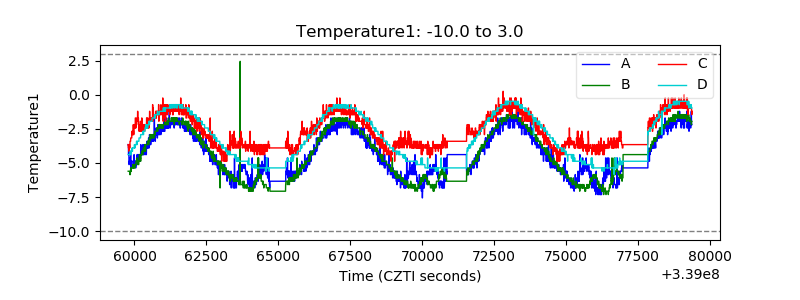 |
| Veto HV Monitor | 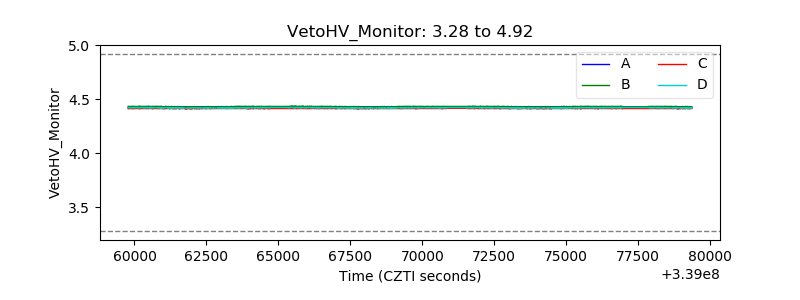 |
| Veto LLD |  |
| Alpha Counter | 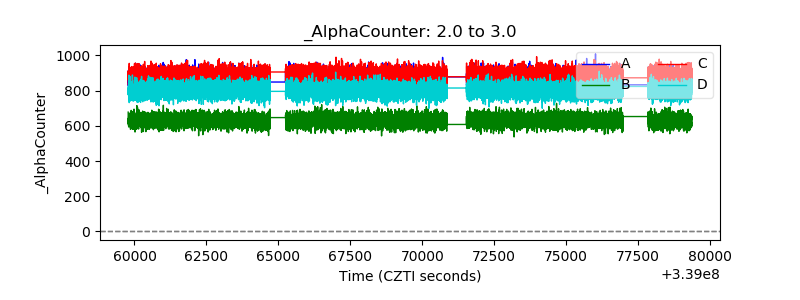 |
| _CPM_Rate | 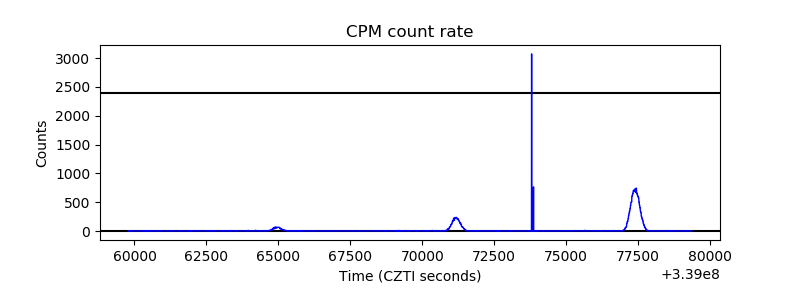 |
| CZT Counter | 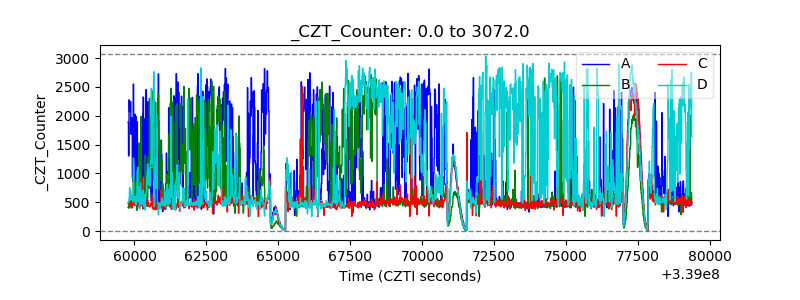 |
| +2.5 Volts monitor |  |
| +5 Volts monitor |  |
| _ROLL_ROT | 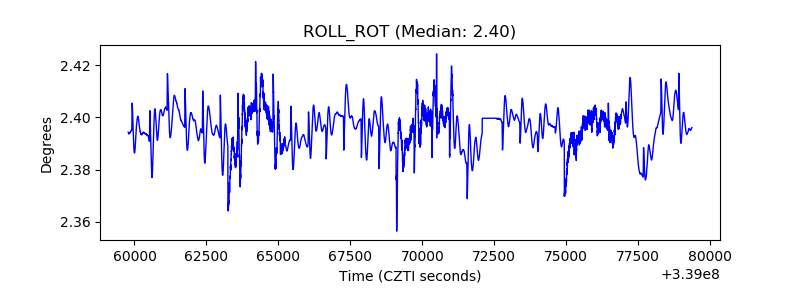 |
| _Roll_DEC | 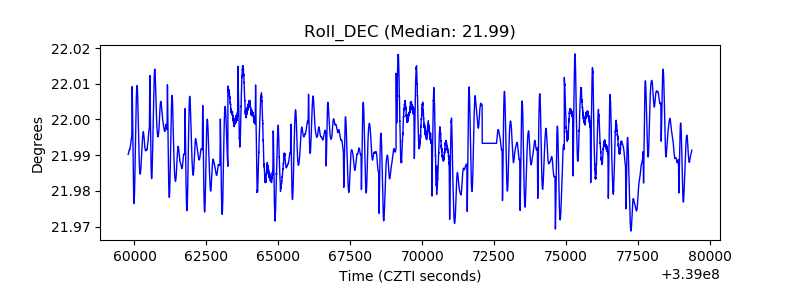 |
| _Roll_RA | 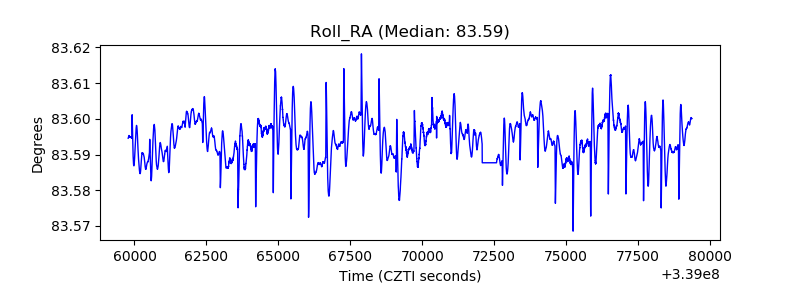 |
| Veto Counter | 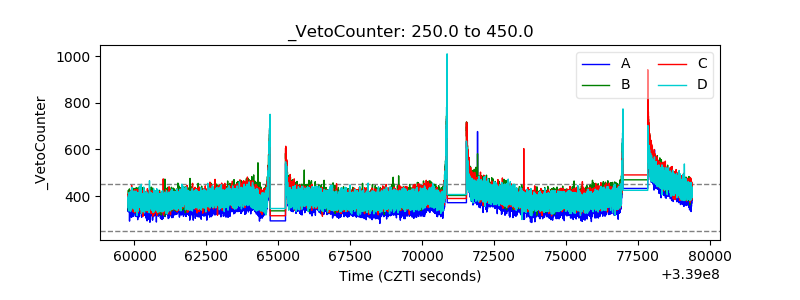 |