| Param | Original file | Final file |
|---|---|---|
| Filename | modeM0/AS1A09_120T02_9000003904_27063cztM0_level2.evt | modeM0/AS1A09_120T02_9000003904_27063cztM0_level2_quad_clean.evt |
| Size (bytes) | 665,429,760 | 70,133,760 |
| Size | 634.6 MB | 66.9 MB |
| Events in quadrant A | 5,337,638 | 394,473 |
| Events in quadrant B | 3,812,741 | 444,566 |
| Events in quadrant C | 3,509,955 | 424,878 |
| Events in quadrant D | 7,042,140 | 395,633 |
| Mode M9 | |||
|---|---|---|---|
| Quadrant | BADHDUFLAG | Total packets | Discarded packets |
| A | 0 | 10 | 0 |
| B | 0 | 10 | 0 |
| C | 0 | 10 | 0 |
| D | 0 | 10 | 0 |
| Mode M0 | |||
|---|---|---|---|
| Quadrant | BADHDUFLAG | Total packets | Discarded packets |
| A | 0 | 20209 | 0 |
| B | 0 | 15412 | 0 |
| C | 0 | 14355 | 0 |
| D | 0 | 25382 | 0 |
| Quadrant | Total seconds | Saturated seconds | Saturation percentage |
|---|---|---|---|
| A | 6651 | 650 | 9.772966% |
| B | 6651 | 195 | 2.931890% |
| C | 6652 | 96 | 1.443175% |
| D | 6652 | 1449 | 21.782922% |
Noise dominated data is calculated using 1-second bins in cleaned event files. If a bin has >2000 counts, and if more than 50% of those come from <1% of pixels, then it is considered to be noise-dominated and hence unusable.
| Quadrant | # 1 sec bins | Bins with >0 counts | Bins with >2000 counts | High rate bins dominated by noise | Noise dominated (total time) | Noise dominated (detector-on time) | Marked lightcurve |
|---|---|---|---|---|---|---|---|
| A | 7651 | 6652 | 548 | 548 | 7.16% | 8.24% | 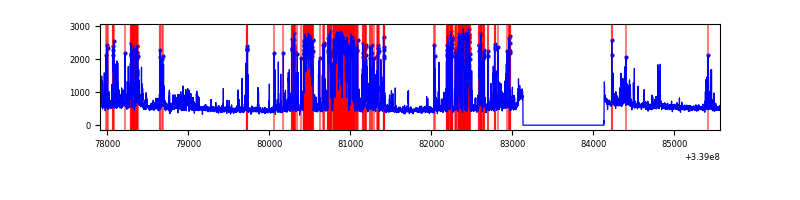 |
| B | 7651 | 6652 | 100 | 100 | 1.31% | 1.50% | 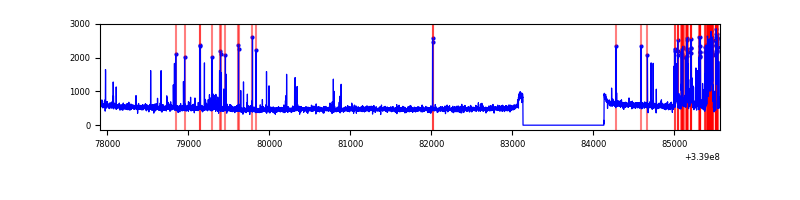 |
| C | 7652 | 6653 | 4 | 4 | 0.05% | 0.06% | 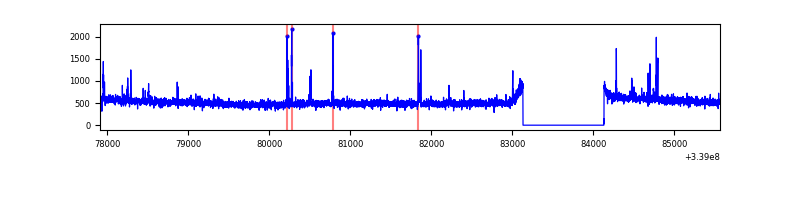 |
| D | 7652 | 6653 | 1153 | 1153 | 15.07% | 17.33% | 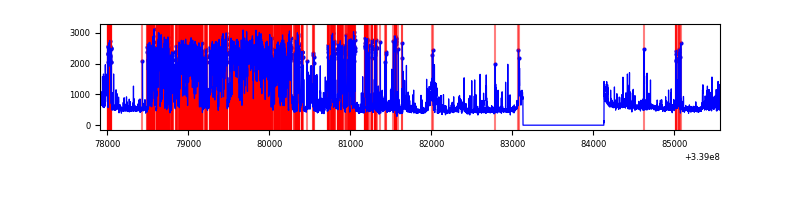 |
Top three noisy pixels from each quadrant. If the there are fewer than three noisy pixels in the level2.evt file, extra rows are filled as -1
| Pixel properties | Quadrant properties | ||||||
|---|---|---|---|---|---|---|---|
| Quadrant | DetID | PixID | Counts | Sigma | Mean | Median | Sigma |
| A | 14 | 235 | 2039708 | 12211.35 | 836 | 821 | 167.0 |
| A | 9 | 130 | 69297 | 410.12 | 836 | 821 | 167.0 |
| A | 13 | 254 | 9975 | 54.83 | 836 | 821 | 167.0 |
| B | 0 | 189 | 357022 | 2193.22 | 856 | 835 | 162.4 |
| B | 10 | 246 | 69080 | 420.22 | 856 | 835 | 162.4 |
| B | 0 | 245 | 21790 | 129.03 | 856 | 835 | 162.4 |
| C | 14 | 238 | 134607 | 680.34 | 837 | 844 | 196.6 |
| C | 15 | 208 | 92770 | 467.55 | 837 | 844 | 196.6 |
| C | 4 | 224 | 21014 | 102.59 | 837 | 844 | 196.6 |
| D | 1 | 52 | 2450323 | 13379.78 | 763 | 746 | 183.1 |
| D | 12 | 233 | 1457600 | 7957.45 | 763 | 746 | 183.1 |
| D | 2 | 250 | 207610 | 1129.91 | 763 | 746 | 183.1 |
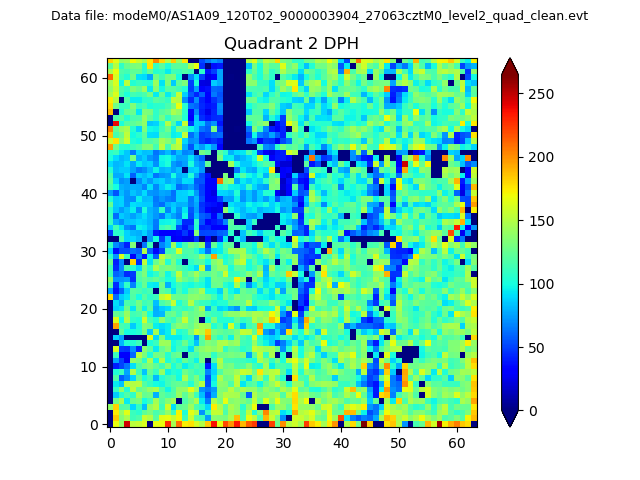
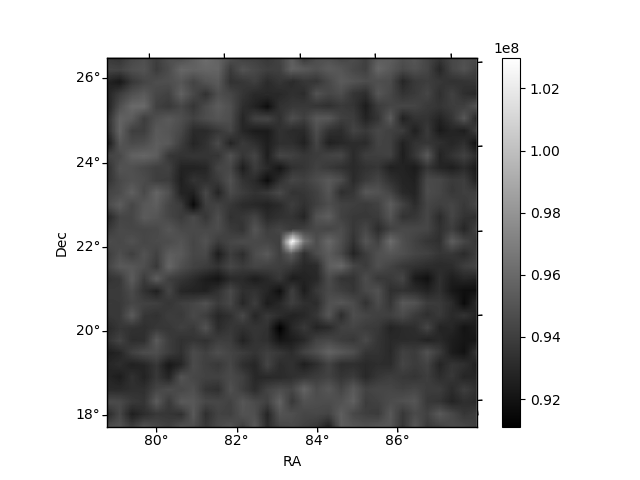
Histogram calculated using DETX and DETY for each event in the final _common_clean file
| Quadrant A | 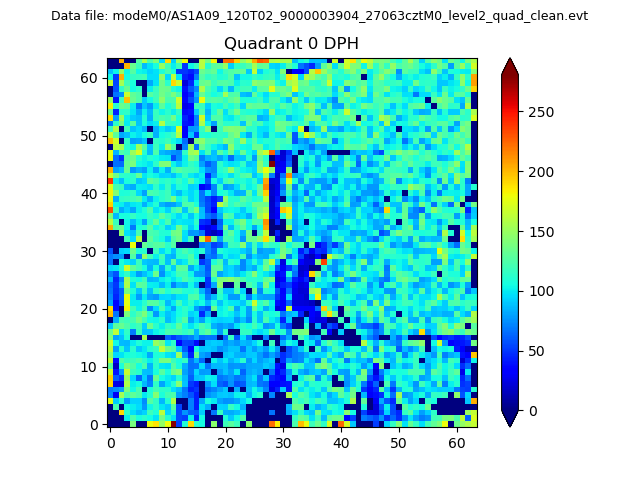 |
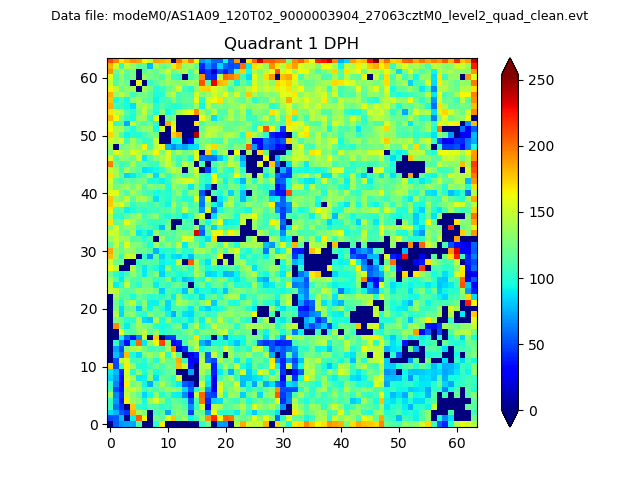 |
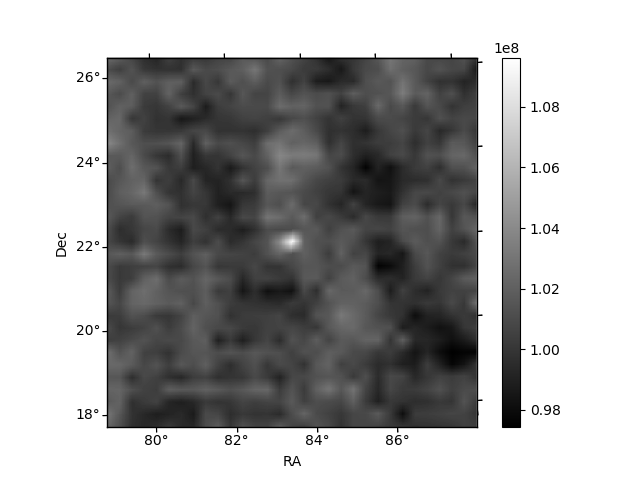
Quadrant B |
|---|---|---|---|
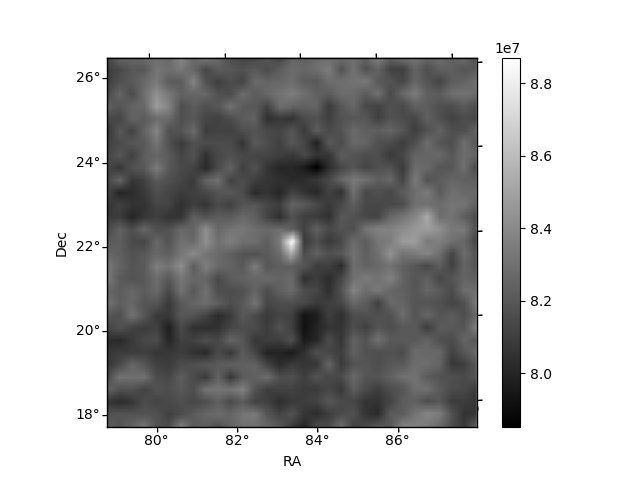
| Quadrant D | 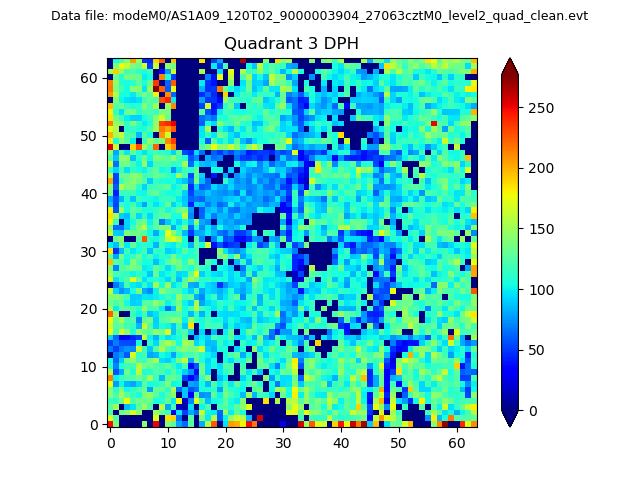 |
 |
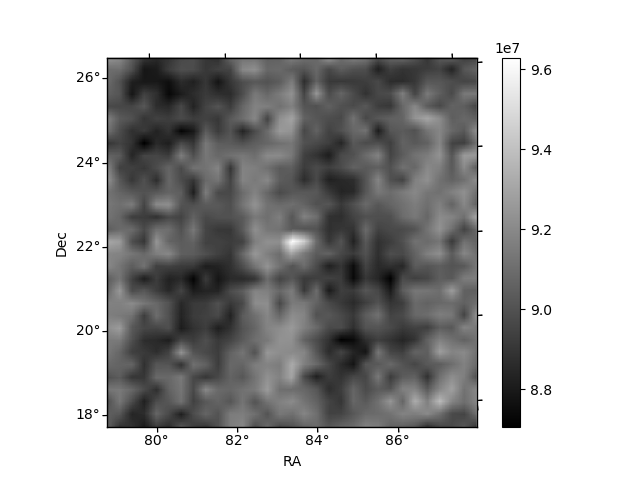
Quadrant C |
| Plot type | Count rate plots | Images |
|---|---|---|
| Comparison with Poisson distribution Blue bars denote a histogram of data divided into 1 sec bins. Red curve is a Poisson curve with rate = median count rate of data. |
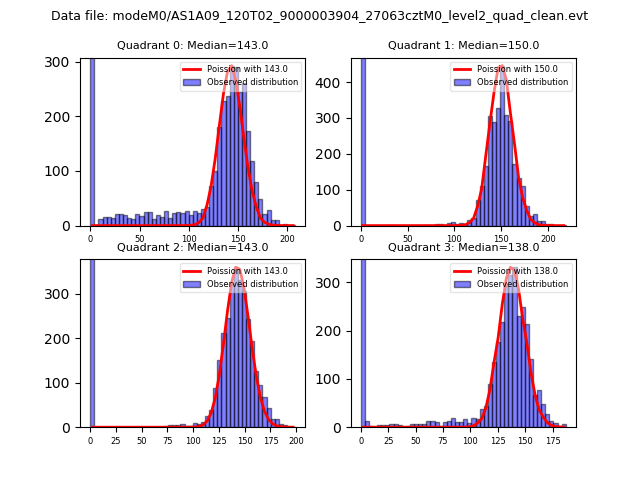 |
 |
| Quadrant-wise count rates Data is divided into 100 sec bins |
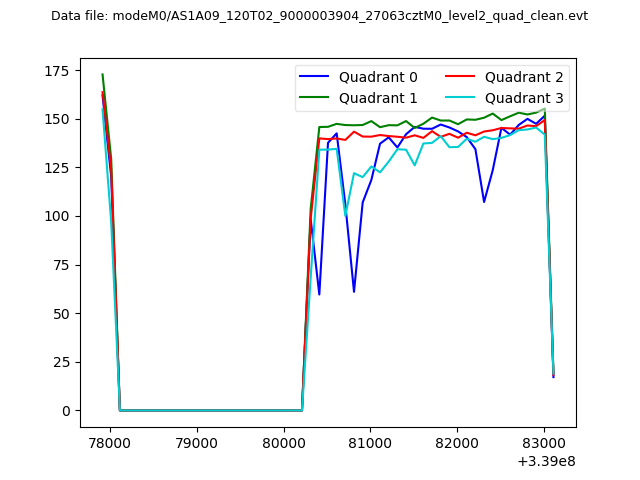 |
|
| Module-wise count rates for Quadrant A Data is divided into 100 sec bins |
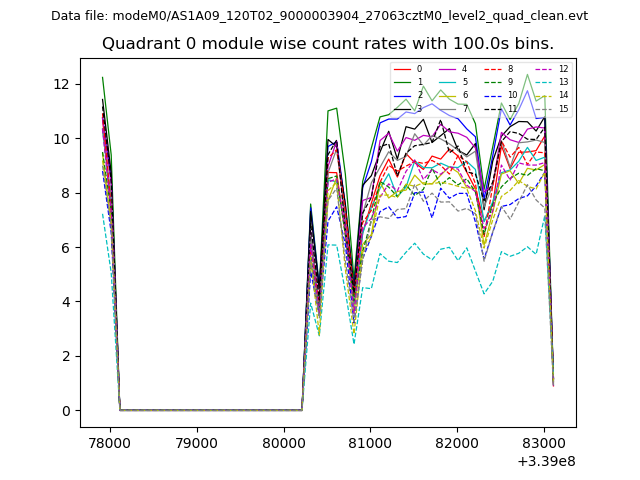 |
 |
| Module-wise count rates for Quadrant B Data is divided into 100 sec bins |
 |
 |
| Module-wise count rates for Quadrant C Data is divided into 100 sec bins |
 |
 |
| Module-wise count rates for Quadrant D Data is divided into 100 sec bins |
 |
 |
| Parameter | Plot |
|---|---|
| CZT HV Monitor | 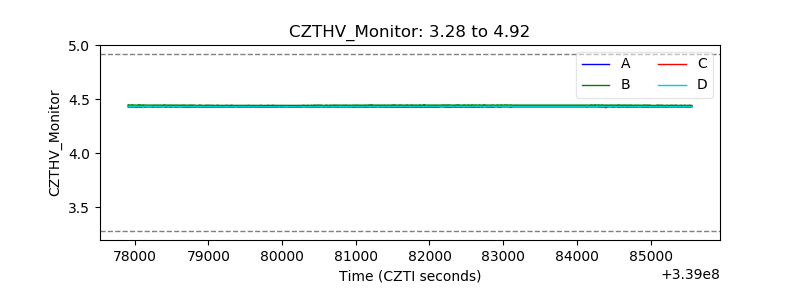 |
| D_VDD | 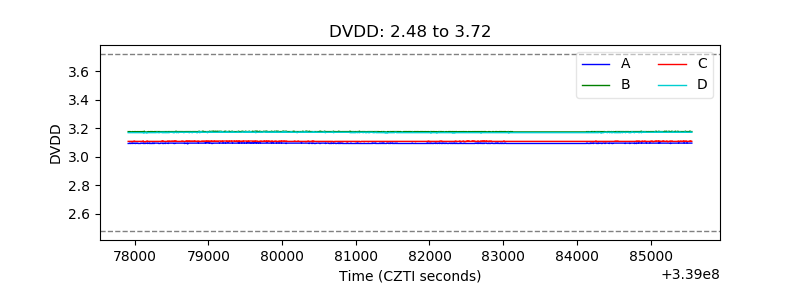 |
| Temperature 1 |  |
| Veto HV Monitor | 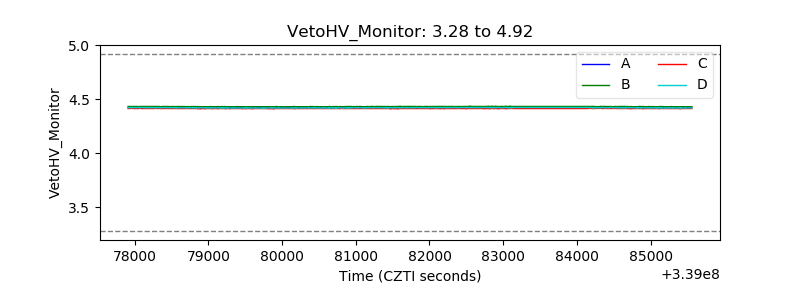 |
| Veto LLD | 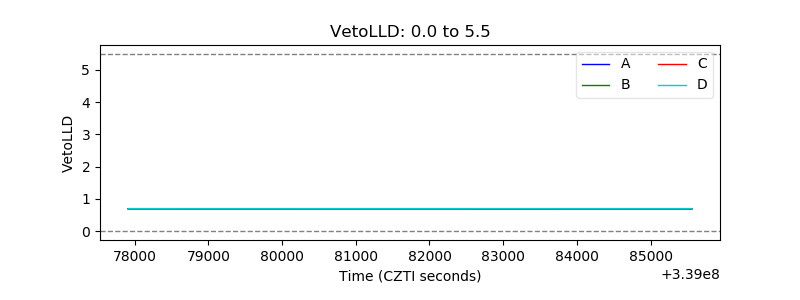 |
| Alpha Counter | 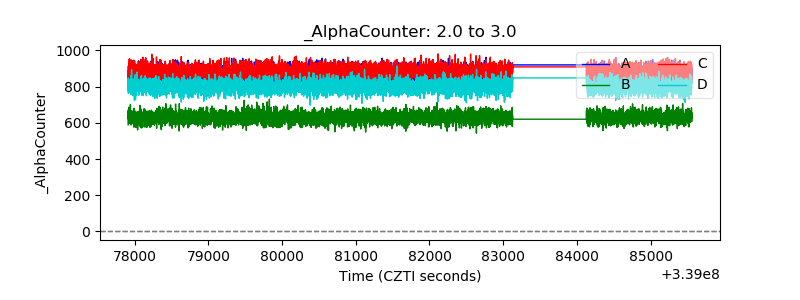 |
| _CPM_Rate | 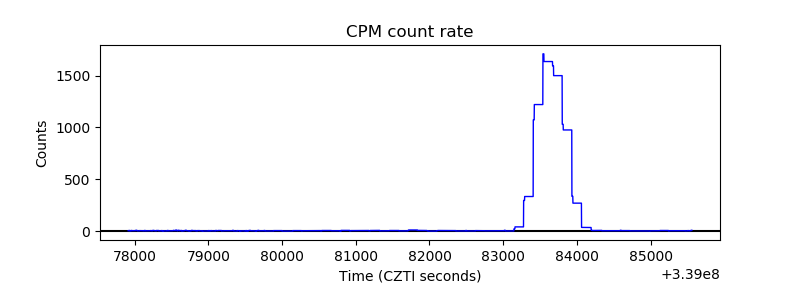 |
| CZT Counter | 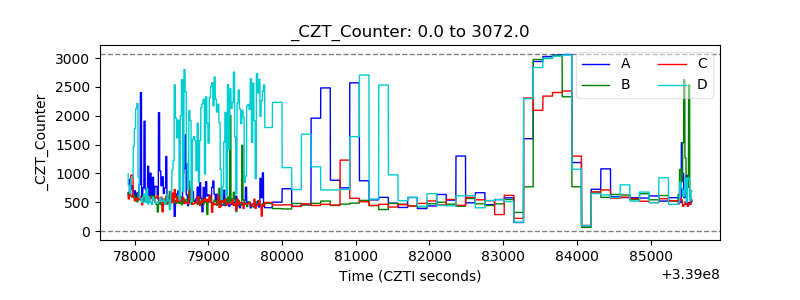 |
| +2.5 Volts monitor |  |
| +5 Volts monitor |  |
| _ROLL_ROT | 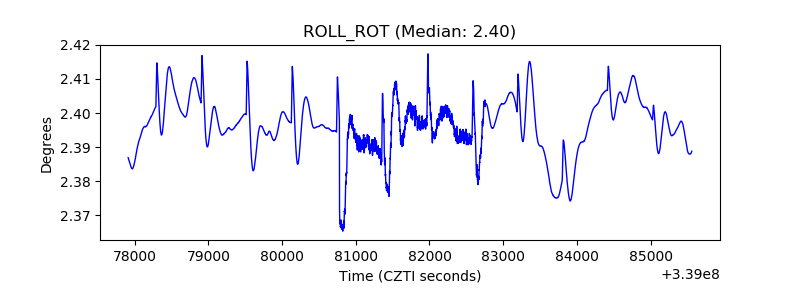 |
| _Roll_DEC | 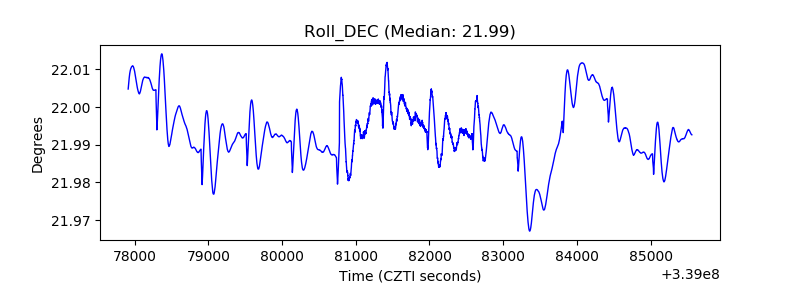 |
| _Roll_RA | 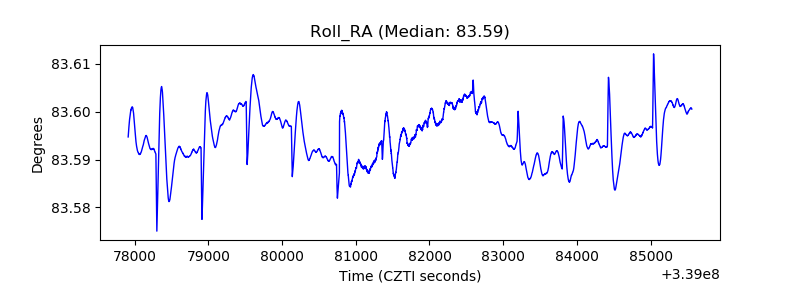 |
| Veto Counter | 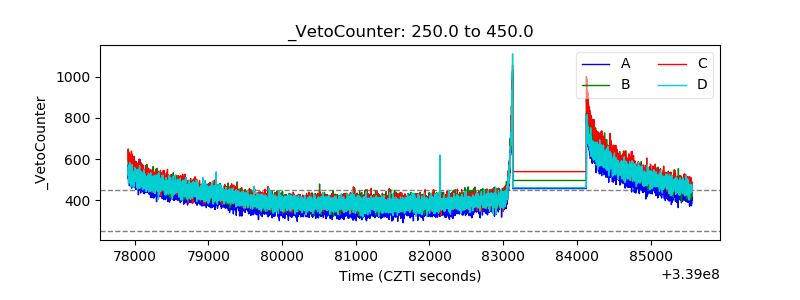 |