| Param | Original file | Final file |
|---|---|---|
| Filename | modeM0/AS1A09_120T02_9000003904_27065cztM0_level2.evt | modeM0/AS1A09_120T02_9000003904_27065cztM0_level2_quad_clean.evt |
| Size (bytes) | 737,910,720 | 70,977,600 |
| Size | 703.7 MB | 67.7 MB |
| Events in quadrant A | 4,192,780 | 460,684 |
| Events in quadrant B | 7,796,465 | 413,256 |
| Events in quadrant C | 3,599,724 | 451,887 |
| Events in quadrant D | 6,322,975 | 372,858 |
| Mode M9 | |||
|---|---|---|---|
| Quadrant | BADHDUFLAG | Total packets | Discarded packets |
| A | 0 | 16 | 0 |
| B | 0 | 17 | 0 |
| C | 0 | 17 | 0 |
| D | 0 | 17 | 0 |
| Mode M0 | |||
|---|---|---|---|
| Quadrant | BADHDUFLAG | Total packets | Discarded packets |
| A | 0 | 16650 | 0 |
| B | 0 | 27393 | 0 |
| C | 0 | 14714 | 0 |
| D | 0 | 23200 | 0 |
| Quadrant | Total seconds | Saturated seconds | Saturation percentage |
|---|---|---|---|
| A | 6443 | 162 | 2.514357% |
| B | 6443 | 2017 | 31.305293% |
| C | 6443 | 138 | 2.141859% |
| D | 6443 | 910 | 14.123855% |
Noise dominated data is calculated using 1-second bins in cleaned event files. If a bin has >2000 counts, and if more than 50% of those come from <1% of pixels, then it is considered to be noise-dominated and hence unusable.
| Quadrant | # 1 sec bins | Bins with >0 counts | Bins with >2000 counts | High rate bins dominated by noise | Noise dominated (total time) | Noise dominated (detector-on time) | Marked lightcurve |
|---|---|---|---|---|---|---|---|
| A | 7563 | 6444 | 62 | 62 | 0.82% | 0.96% | 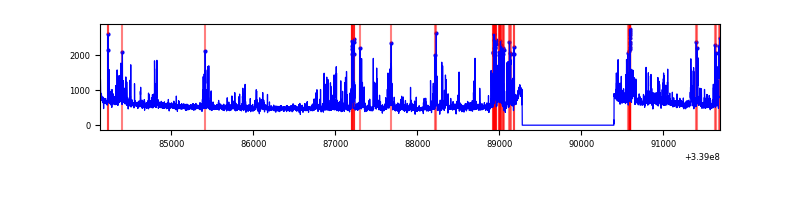 |
| B | 7563 | 6444 | 1741 | 1741 | 23.02% | 27.02% | 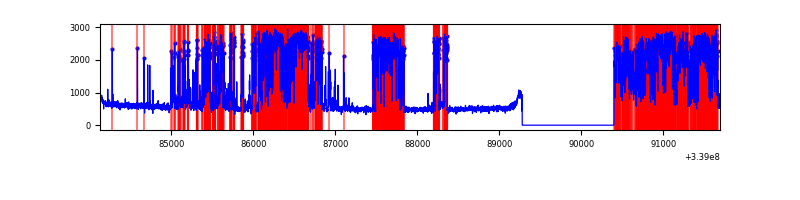 |
| C | 7563 | 6444 | 10 | 10 | 0.13% | 0.16% | 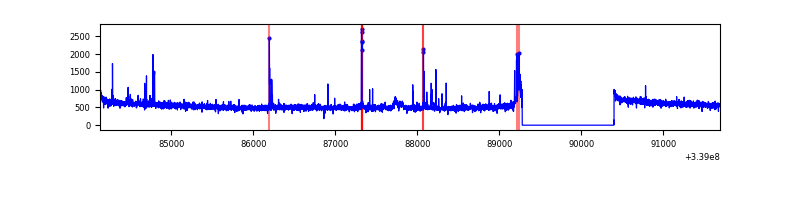 |
| D | 7563 | 6444 | 916 | 916 | 12.11% | 14.21% | 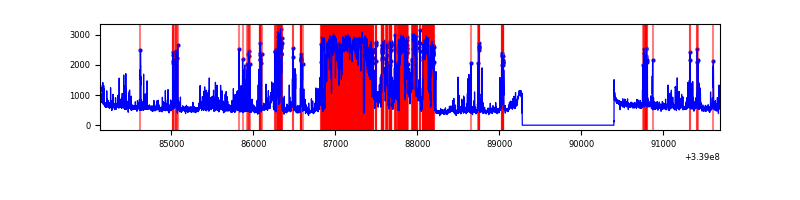 |
Top three noisy pixels from each quadrant. If the there are fewer than three noisy pixels in the level2.evt file, extra rows are filled as -1
| Pixel properties | Quadrant properties | ||||||
|---|---|---|---|---|---|---|---|
| Quadrant | DetID | PixID | Counts | Sigma | Mean | Median | Sigma |
| A | 14 | 235 | 713491 | 4092.19 | 878 | 862 | 174.1 |
| A | 6 | 16 | 86801 | 493.49 | 878 | 862 | 174.1 |
| A | 13 | 254 | 10415 | 54.86 | 878 | 862 | 174.1 |
| B | 0 | 189 | 4663938 | 32334.43 | 764 | 748 | 144.2 |
| B | 10 | 246 | 104050 | 716.29 | 764 | 748 | 144.2 |
| B | 12 | 111 | 16699 | 110.6 | 764 | 748 | 144.2 |
| C | 14 | 238 | 139487 | 696.86 | 854 | 865 | 198.9 |
| C | 15 | 208 | 128356 | 640.9 | 854 | 865 | 198.9 |
| C | 13 | 61 | 6044 | 26.04 | 854 | 865 | 198.9 |
| D | 1 | 52 | 2954439 | 15439.01 | 813 | 796 | 191.3 |
| D | 2 | 250 | 243506 | 1268.67 | 813 | 796 | 191.3 |
| D | 2 | 234 | 28702 | 145.87 | 813 | 796 | 191.3 |
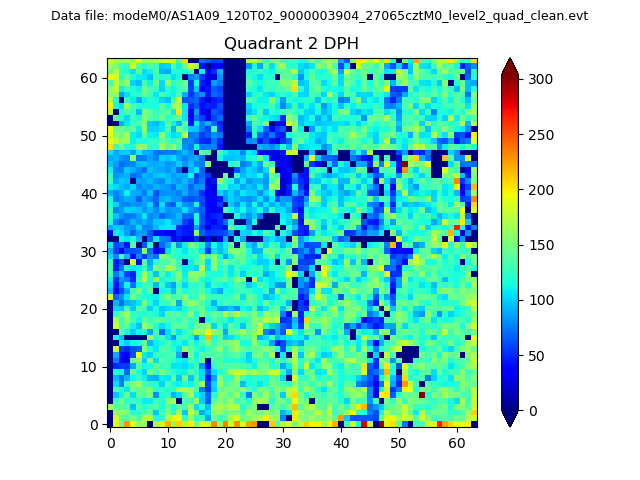
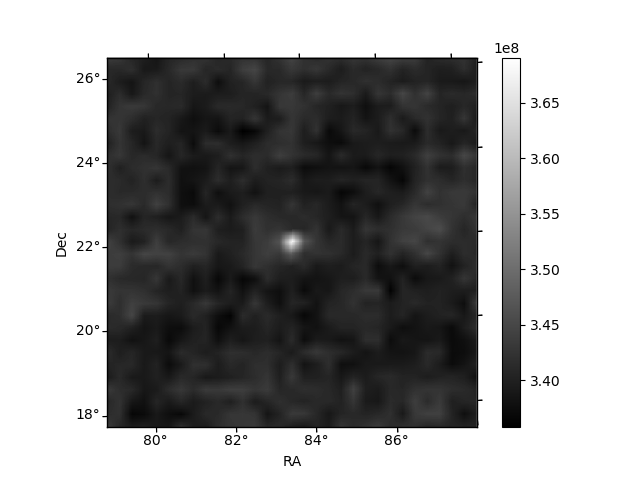
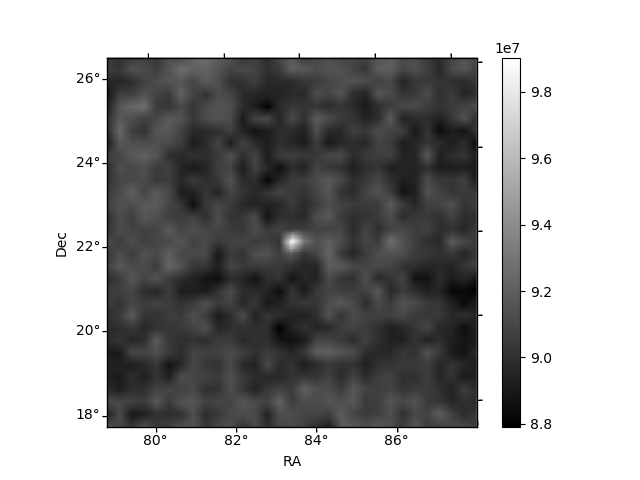
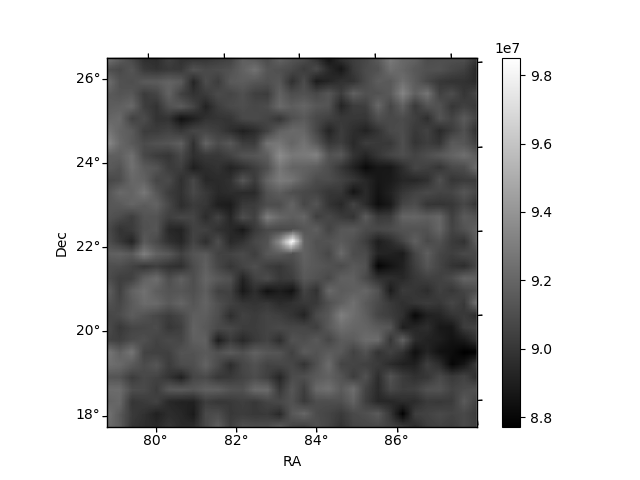
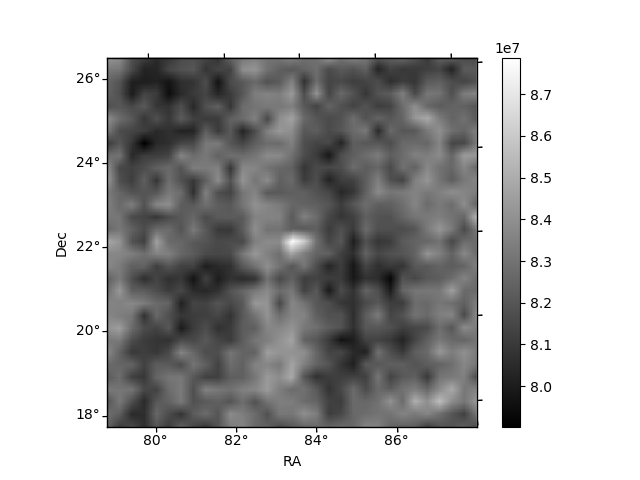
Histogram calculated using DETX and DETY for each event in the final _common_clean file
| Quadrant A | 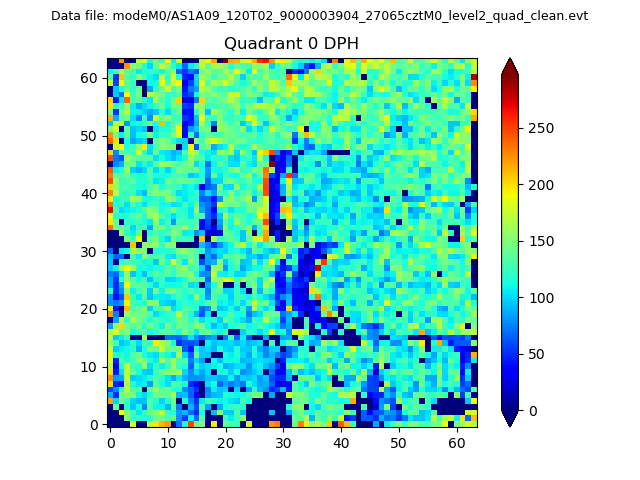 |
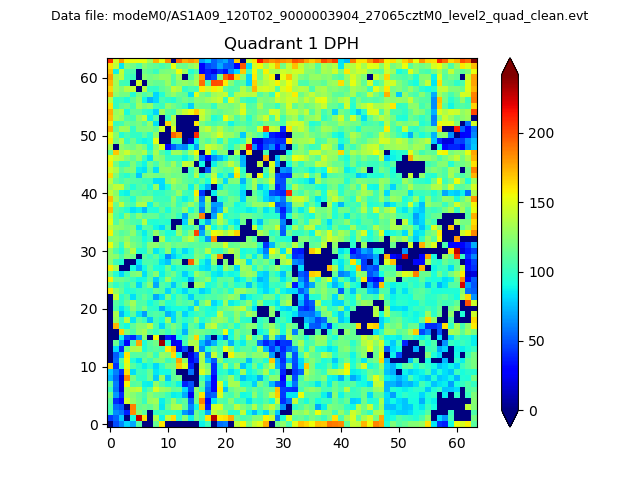 |
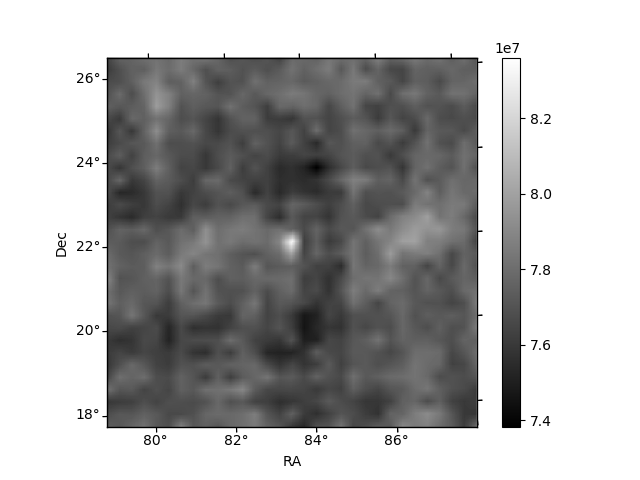
Quadrant B |
|---|---|---|---|
| Quadrant D | 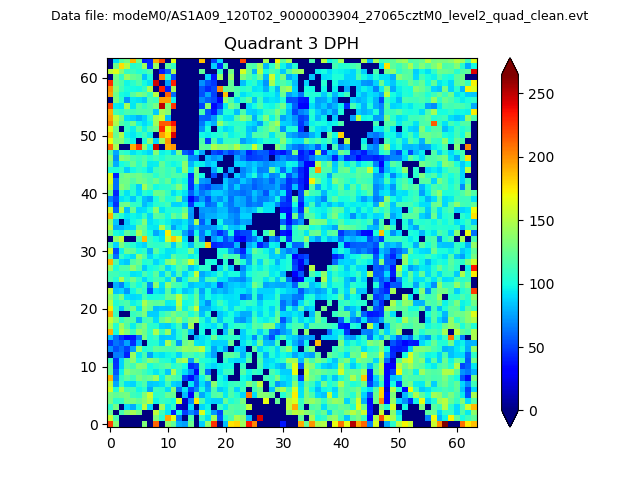 |
 |
Quadrant C |
| Plot type | Count rate plots | Images |
|---|---|---|
| Comparison with Poisson distribution Blue bars denote a histogram of data divided into 1 sec bins. Red curve is a Poisson curve with rate = median count rate of data. |
 |
 |
| Quadrant-wise count rates Data is divided into 100 sec bins |
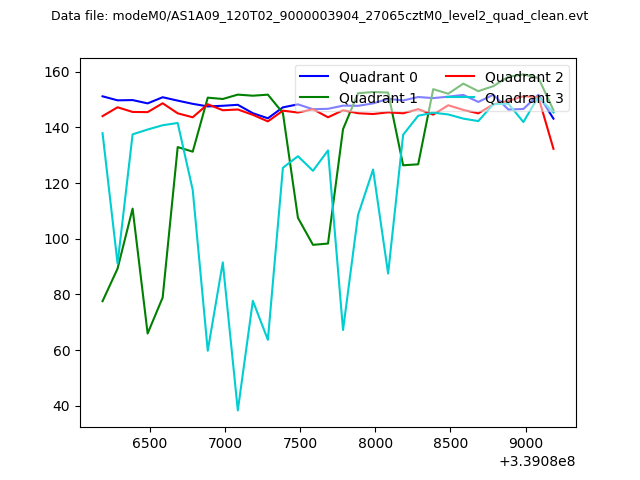 |
|
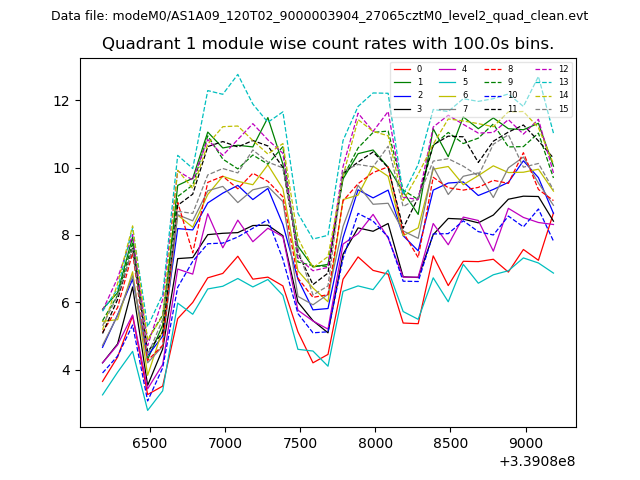
| Module-wise count rates for Quadrant A Data is divided into 100 sec bins |
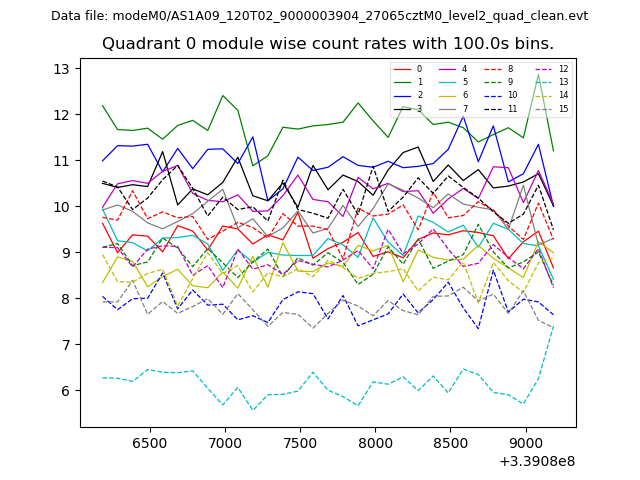 |
 |
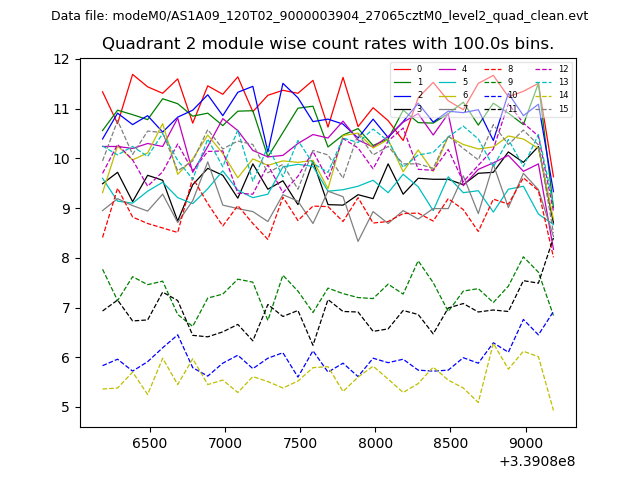
| Module-wise count rates for Quadrant B Data is divided into 100 sec bins |
 |
 |
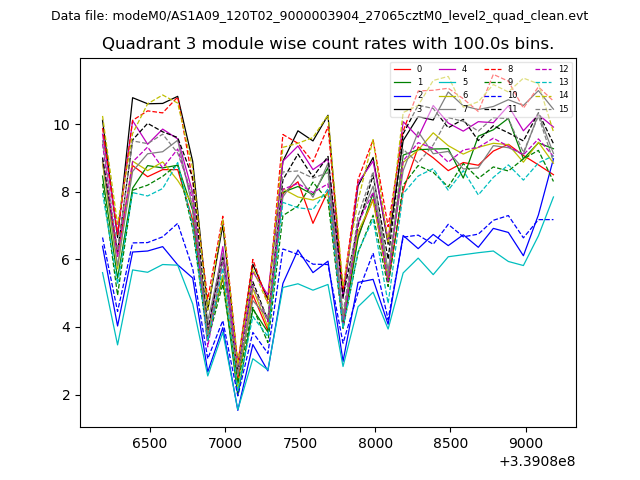
| Module-wise count rates for Quadrant C Data is divided into 100 sec bins |
 |
 |
| Module-wise count rates for Quadrant D Data is divided into 100 sec bins |
 |
 |
| Parameter | Plot |
|---|---|
| CZT HV Monitor | 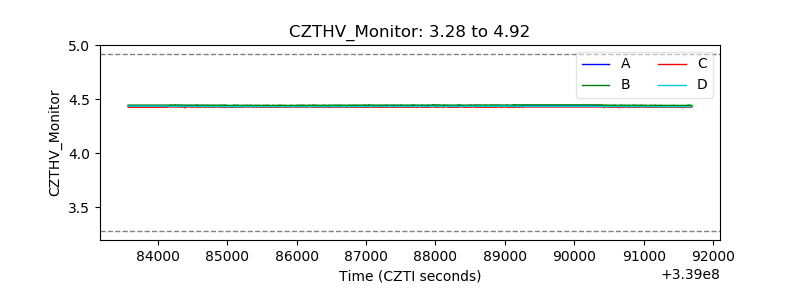 |
| D_VDD | 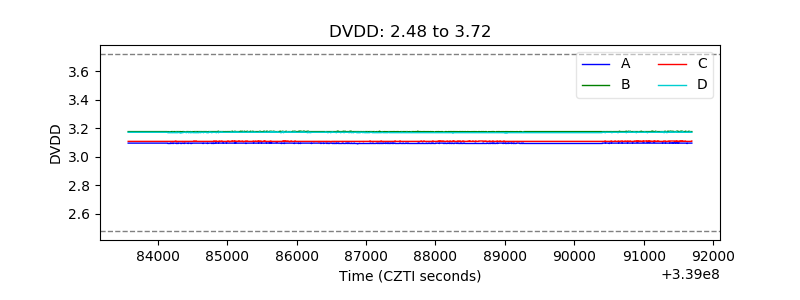 |
| Temperature 1 | 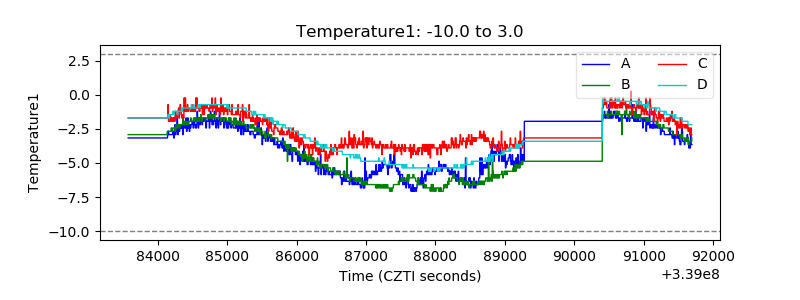 |
| Veto HV Monitor |  |
| Veto LLD | 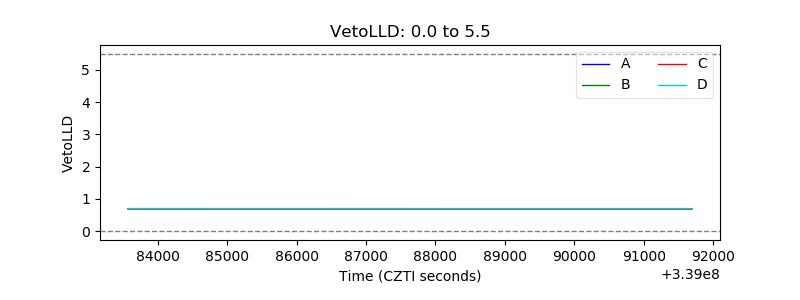 |
| Alpha Counter |  |
| _CPM_Rate |  |
| CZT Counter | 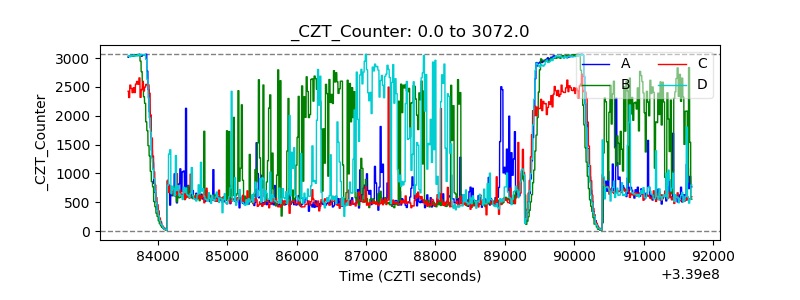 |
| +2.5 Volts monitor |  |
| +5 Volts monitor |  |
| _ROLL_ROT | 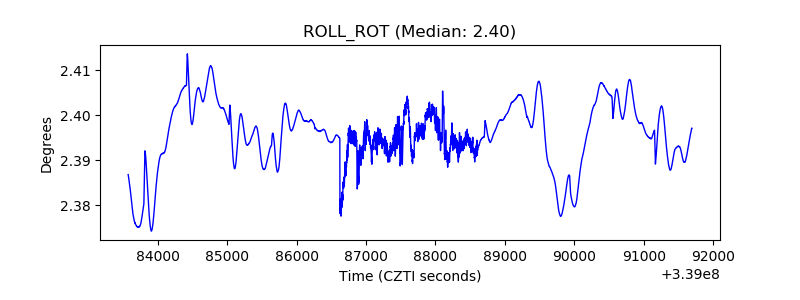 |
| _Roll_DEC | 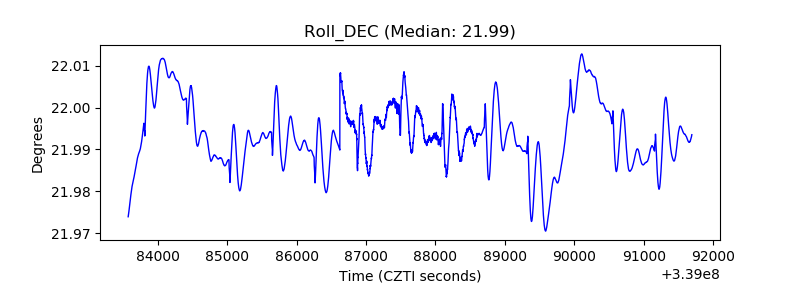 |
| _Roll_RA | 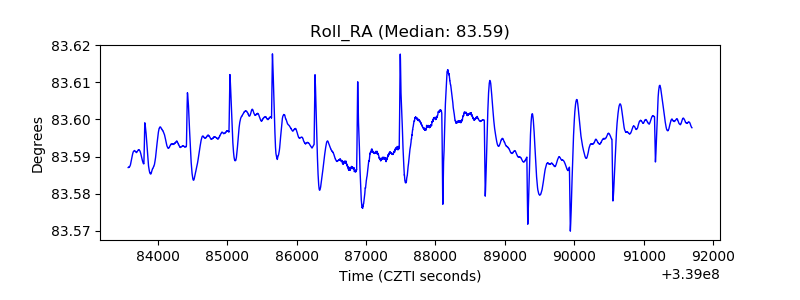 |
| Veto Counter | 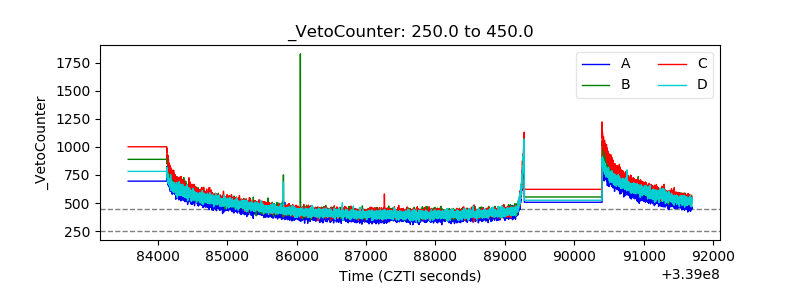 |